Open Access
Fig. 19
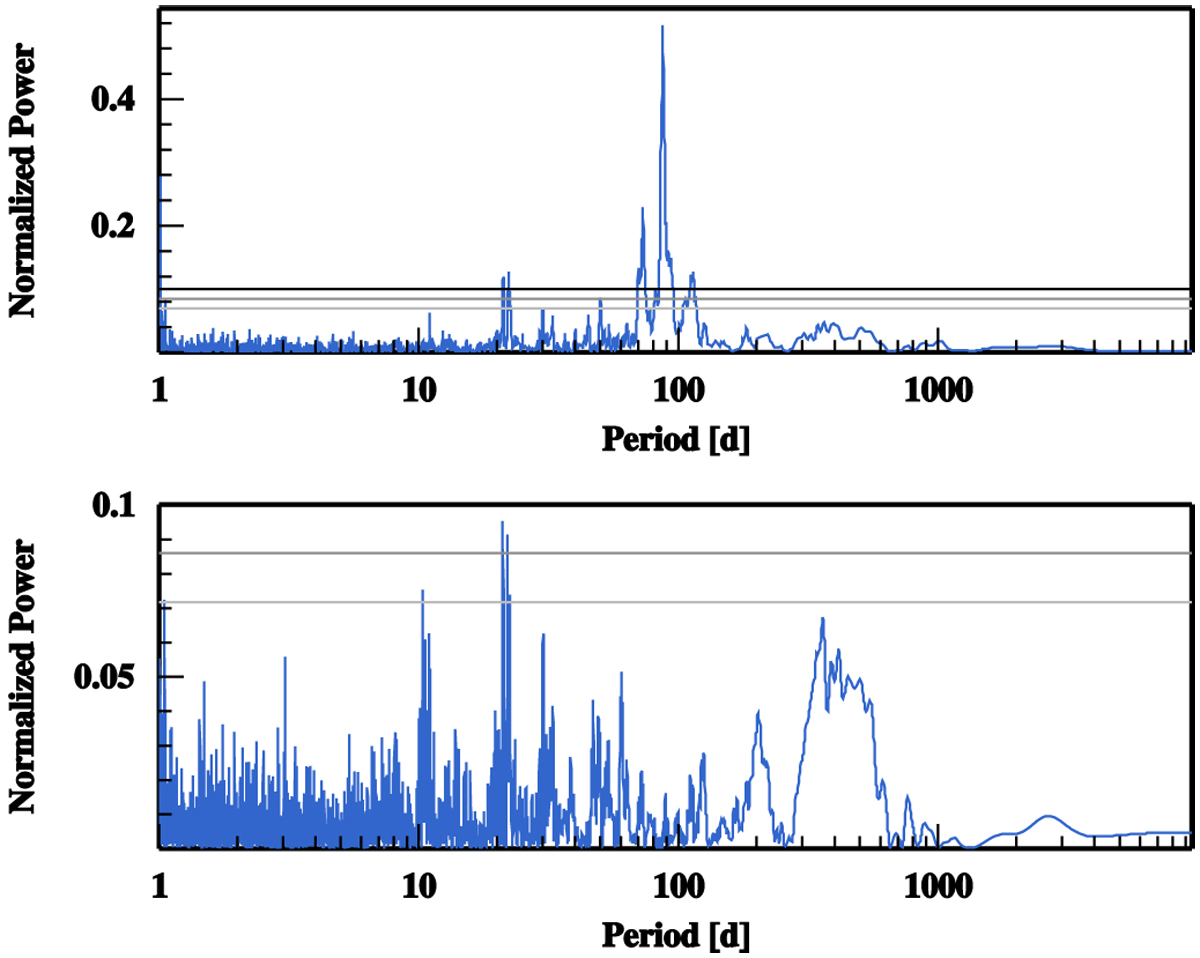
Periodograms: combined SOPHIE, CARMENES, and KECK radial velocities of Gl617A (top panel); bottom panel: residuals of a Keplerian fit with P = 86d to the data. The horizontal lines correspond to 50%, 10%, and (top panel only) 1% FAP, respectively.
Current usage metrics show cumulative count of Article Views (full-text article views including HTML views, PDF and ePub downloads, according to the available data) and Abstracts Views on Vision4Press platform.
Data correspond to usage on the plateform after 2015. The current usage metrics is available 48-96 hours after online publication and is updated daily on week days.
Initial download of the metrics may take a while.