Fig. 9
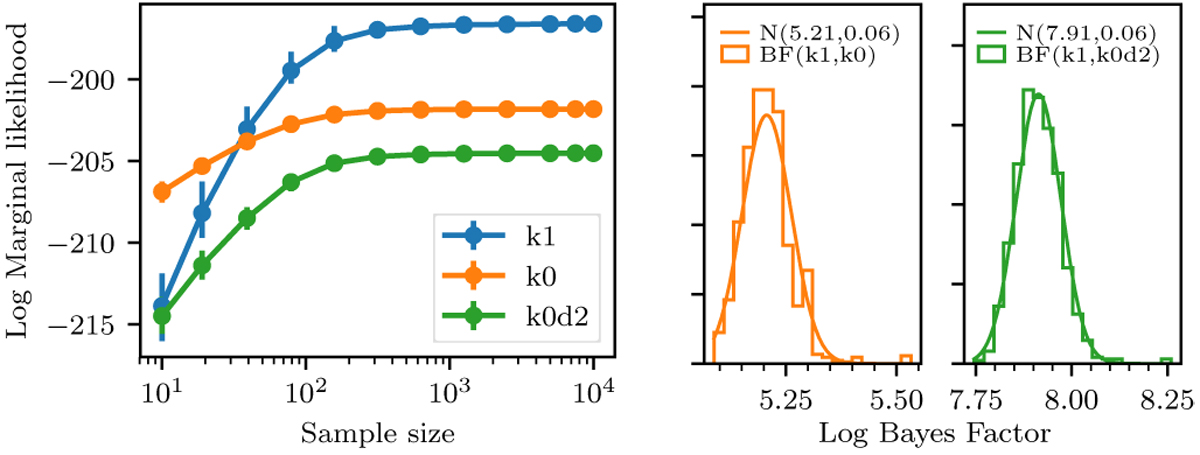
Left panel: marginal likelihood estimated by the Perrakis method vs. sample size for three models: a single Keplerian plus white noise (k1; blue), a quadratic drift plus white noise (k0d2; green), and pure white noise (k0; orange). The one-Keplerian model is clearly favoured by the data. The error bars correspond to the 95% confidence interval. Right panel: histogram of 1000 Monte Carlo realisations of the Bayes factor between model k1 and k0 (orange) and k0d2 (green); the solid curves are normal distributions with the mean and variance equal to those of the Monte Carlo sample.
Current usage metrics show cumulative count of Article Views (full-text article views including HTML views, PDF and ePub downloads, according to the available data) and Abstracts Views on Vision4Press platform.
Data correspond to usage on the plateform after 2015. The current usage metrics is available 48-96 hours after online publication and is updated daily on week days.
Initial download of the metrics may take a while.