Open Access
Fig. 4
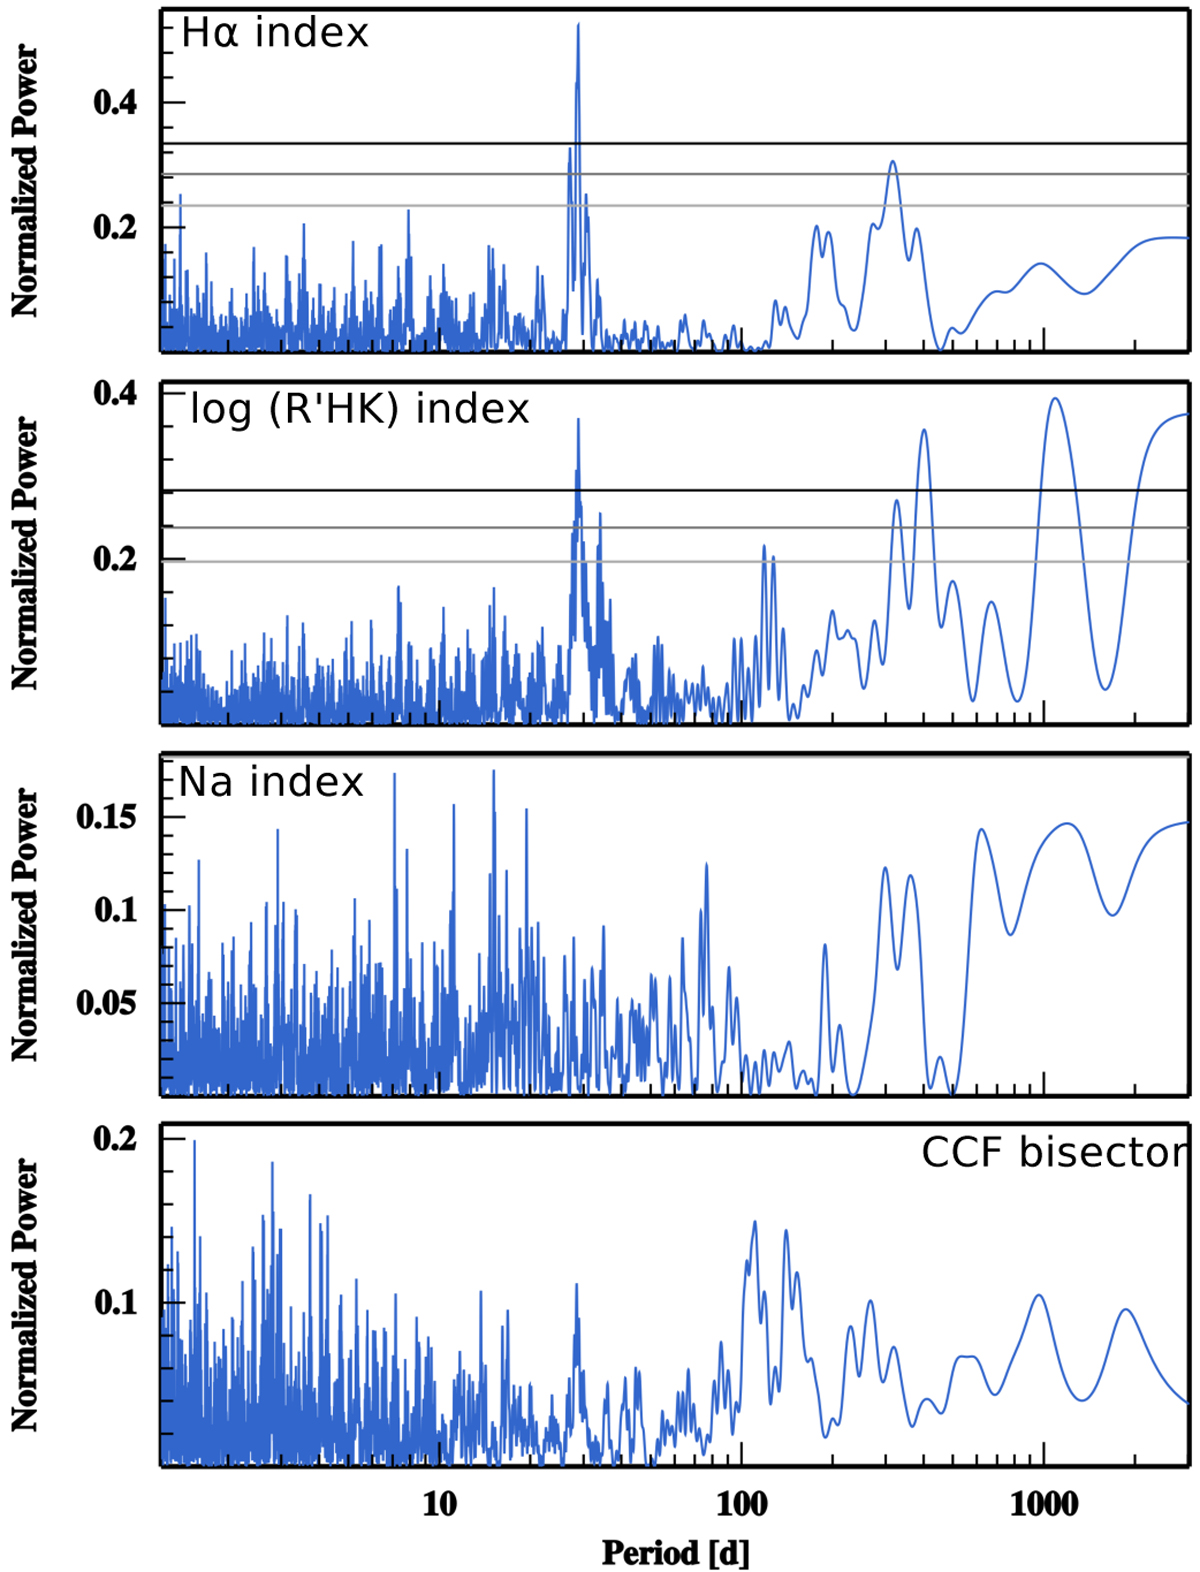
Periodograms of activity indicators for Gl96 – from top to bottom panels: Hα
index, ![]() index, NaI index, and CCF bisector. The horizontal lines correspond to 50%, 10%, and 1% FAP, respectively. For the NaI index and CCF bisector, no horizontal lines are visible because the entire periodogram is beneath the 50% FAP line.
index, NaI index, and CCF bisector. The horizontal lines correspond to 50%, 10%, and 1% FAP, respectively. For the NaI index and CCF bisector, no horizontal lines are visible because the entire periodogram is beneath the 50% FAP line.
Current usage metrics show cumulative count of Article Views (full-text article views including HTML views, PDF and ePub downloads, according to the available data) and Abstracts Views on Vision4Press platform.
Data correspond to usage on the plateform after 2015. The current usage metrics is available 48-96 hours after online publication and is updated daily on week days.
Initial download of the metrics may take a while.