| Issue |
A&A
Volume 616, August 2018
|
|
|---|---|---|
| Article Number | A130 | |
| Number of page(s) | 13 | |
| Section | Stellar structure and evolution | |
| DOI | https://doi.org/10.1051/0004-6361/201832639 | |
| Published online | 04 September 2018 | |
KIC 8553788: A pulsating Algol with an extreme mass ratio
Institute for Astronomy, Astrophysics, Space Applications and Remote Sensing, National Observatory of Athens, Metaxa & Vas. Pavlou St., 15236 Penteli, Athens, Greece
e-mail: This email address is being protected from spambots. You need JavaScript enabled to view it.
Received:
13
January
2018
Accepted:
30
April
2018
Abstract
Context. The present research paper focuses on the eclipsing binary KIC 8553788 which belongs to two different types of binary systems regarding its physical properties. In particular, it is one of the 71 oscillating stars of Algol-type that have been discovered so far and one of the six that have been published based on high-cadence photometric data of the Kepler mission. In addition, it is one of the four semi-detached binaries of the group of R CMa-type systems, while its pulsating component has the fourth fastest frequency among the δ Scuti stars-members of semi-detached binaries. Detailed light curves as well as spectroscopic and pulsation analyses are presented, while possible explanation scenarios for the evolution of the system involving past mass transfer, mass loss, and/or angular momentum loss due to the presence of a tertiary component are discussed.
Aims. The goal of the study is to extract the pulsational characteristics of the oscillating star of the system, to estimate the absolute parameters of its components, and to provide a possible explanation for its extreme evolutionary status.
Methods. Ground-based spectroscopic observations using the 2.3 m “Aristarchos” telescope were obtained and used for the estimation of the spectral type of the primary component and to model the light curves of the system with higher certainty. The short-cadence photometric data provided by the Kepler mission were analysed using standard eclipsing binary modelling techniques, while Fourier analysis was applied on their residuals aiming to reveal the properties of the intrinsic oscillations. The resulting photometric model was combined with a published radial velocity curve to obtain accurate absolute parameters for the components of the system.
Results. The results show that the primary component of the system is of A8 spectral type, has a mass of 1.6 M⊙, and a radius of 2 R⊙. It is a relatively fast pulsator of δ Scuti type that oscillates in 89 frequency modes with the dominant one being 58.26 cycles day−1. On the other hand, the secondary component has a mass of only 0.07 M⊙, a radius of 1 R⊙, and a temperature of 4400 K. In addition, it was found to be magnetically active with migrating cool spots on its surface.
Conclusions. KIC 8553788, according to its geometrical configuration and its pulsational properties, belongs to the group of oscillating stars of Algol type, while according to its very low mass ratio and its relatively short orbital period belongs also to the group of R CMa stars. If confirmed by radial velocity data of the secondary component, the system would have the lowest mass ratio that has ever been found in semi-detached systems and could therefore be considered as one of the most extreme cases.
Key words: binaries: eclipsing / stars: fundamental parameters / binaries: close / stars: oscillations / stars: variables: delta Scuti / stars: individual: KIC 8553788
© ESO 2018
1. Introduction
Generally, eclipsing binary systems (EBs) can be considered as the ultimate tools for the calculation of stellar absolute parameters that are needed to check the current stellar evolutionary models. Photometric and spectroscopic observations of EBs can be used to directly derive stellar masses, radii, luminosities, and so on. In particular, the light curves (LCs) analysis provides the means to derive the geometrical configuration (e.g. detached, semi-detached), the inclination, the orbital period of the system, and so on. Moreover, short- to medium-timescale (i.e. from days to a few years) photometric observations offer the opportunity to check for the existence of physical mechanisms that occur in the components (e.g. magnetic activity, intrinsic variability). Another valuable photometric application is the eclipse timing variations (ETV) method that provides us with information regarding long-timescale (i.e. many years) physical mechanisms (e.g. mass transfer, additional components) that also contribute to the evolution of the system. Also, spectroscopy is another key method to obtain accurate results, especially when measuring the radial velocities (RVs) of both components. Although this method is often used to study the spectra of systems with large temperature differences between their components, where the light of the brighter star dominates, it is feasible to proceed in the absolute parameters determination using fair assumptions based on the stellar evolution theory.
The oscillating stars of δ Scuti type are multiperiodic variables pulsating in radial and non-radial modes driven mostly by the κ-mechanism (Balona et al. 2015) in the frequency range 4–80 cycle d−1 (Breger 2000). They are located in the classical instability strip, range between A and F spectral types and luminosity classes III and V, and have masses in the range 1.4–3 M⊙.
Asteroseismic studies of pulsating stars that are members of EBs are quite important, mainly because using the binarity as a tool is feasible to calculate the absolute parameters of the pulsator, which is essential for asteroseismic evolutionary models. In particular, δ Scuti stars in binaries have become targets of great scientific interest during the last two decades, especially after the availability of high-quality data from space missions. Although some cases have been known since the 1970s, the interest for this kind of system was not that great, probably because of the low-quality data that led to ambiguous results. However, following the year 2000 there was a growth of interest in these systems, that led Mkrtichian et al. (2002) to propose them as a separate group of EBs; they defined them as the classical Algol-type systems with mass accreting pulsators of (B)A–F spectral type, commonly known as oEA stars (oscillating eclipsing binaries of Algol type). Systematic observations aiming to discover such systems increased their number and, later, led many researchers to focus on their properties (e.g. Orbital-pulsational periods, log g – pulsational period correlations, Soydugan et al. 2006a; Liakos et al. 2012; Zhang et al. 2013; Liakos & Niarchos 2017; Kahraman Aliçavu¸s et al. 2017). The most complete catalogue (204 δ Scuti stars in 199 binaries) for these systems to date, which also includes updated correlations between their fundamental parameters, was published by Liakos & Niarchos (2017) and is also available in an online form1. It should to be noted that nine more systems of this type have been discovered after that publication with the total number of systems increased to 208.
The R CMa systems were introduced by Budding & Butland (2011) as the classical Algol EBs with an unusual combination of very low mass ratio and relatively short orbital period. There are only 11 members of this group so far, namely R CMa (Budding & Butland 2011), OO Dra (Lee et al. 2018), AS Eri (Mkrtichian et al. 2004; İbanoǧlu et al. 2006), KIC 8087799 (Zhang et al. 2017), KIC 8262223 (Guo et al. 2017), KIC 9285587 (Faigler et al. 2015), KIC 10661783 (Lehmann et al. 2013), KIC 10989032 (Zhang et al. 2017), KIC 11401845 (Lee et al. 2017), OGLEGC 228 (Kaluzny et al. 2007), and WASP 1628+10 (Maxted et al. 2014). R CMa and AS Eri are also oEA stars, while KIC 8087799, KIC 8262223, KIC 9285587, and WASP 1628+10 are detached systems with a δ Scuti component and a He white dwarf (WD) component. Therefore, it should to be noted that all R CMa systems, except for OGLEGC 228, include a pulsating component of δ Scuti type. Figure 1 shows the overlap between the groups of binaries hosting a δ Scuti component (oEA and detached systems) and the R CMa systems.
 |
Fig. 1. Overlap between the groups of oEA stars (71 members, denoted by dots), detached binaries with a δ Scuti component (58 members, denoted by triangles), and R CMa systems. Squares and diamonds represent the systems that belong to two different groups and the cross symbol the system OGLEGC 228, which is the only R CMa system that does not exhibit pulsations. The red star denotes KIC 8553788. |
The Kepler space mission could plausibly be considered as the most valuable data trove for asteroseismic studies. In particular, the high accuracy of the measurements (~10−4 mag), the continuous monitoring of targets for several days, and the time resolution (~1 min) of the short-cadence (SC) data provide the means for very detailed pulsation modelling. In addition, the monitoring of a target during the various quarters of the mission offers the opportunity to study its behaviour on medium timescales (i.e. a few years). Especially for the EBs, the excellent online database should be emphasised, namely Kepler Eclipsing Binary Catalog2 (KEBC, Prša et al. 2011), which includes all the preliminary information and the data for several thousands binaries.
KIC 8553788 (= 2MASS J19174291+4438290, α2000 = 19h17m42.914s, δ2000 = +44°38′29.08″) was discovered as an EB with an orbital period of ~1.606 days by the ASAS project (ASAS J191743+4438.5, Pigulski et al. 2009). It was included in the long-cadence data of all quarters (i.e. Q0–Q17) of the Kepler mission between 2009 and 2013, and, during the quarters Q5 and Q14, was also observed in SC mode. Gies et al. (2012) mentioned, for the first time, the possible existence of pulsations and starspots in the system and their affect on the minima timings. Additionally, they published the ETV analysis of the system proposing the “Light-travel” effect due to a tertiary component as the most realistic solution for the cyclic changes of its orbital period. Later on, Gies et al. (2015), Zasche et al. (2015), and Borkovits et al. (2016) confirmed that result and determined the period of the third body as 8.6, 9.1, and 12.5 yr, respectively. Frasca et al. (2016), based on two spectra obtained by the LAMOST survey, classified the system between A5IV and A8III spectral types, while Matson et al. (2017) included it in their spectroscopic survey on Kepler EBs and published the RV of the primary component.
The motivation for this work is based on the rarity of the nature of KIC 8553788. On one hand, only another five oEA systems observed by the Kepler mission have been announced so far (Liakos & Niarchos 2017; Lee et al. 2016; Liakos 2017) (the total known are 70) and only three semi-detached systems of R CMa type are known to date (see Fig. 1). On the other hand, KIC 8553788 has potentially the smallest mass ratio that has ever been found (see Fig. 2; for details see Sect. 3) in semi-detached systems of these kinds, whose mass ratio is known. Its primary component exhibits pulsations, while its secondary has the smallest mass value ever found among such systems and, in general, in semi-detached systems. Undoubtedly, this EB can be considered as one of the most extreme cases of binaries hosting a pulsating component.
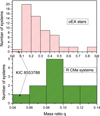 |
Fig. 2. Mass ratio distribution for oEA stars (upper section) and R CMa systems (lower section). The position of KIC 8553788 is also indicated. |
Here, a detailed analysis of the SC Kepler LCs of KIC 8553788 is presented. Based on the published RV (Matson et al. 2017) and ground-based spectroscopic observations, it is feasible for the first time to obtain an accurate photometric model of the system and calculate the absolute parameters of its components with relatively high precision. Also, a detailed asteroseismic analysis on the light curve residuals follows the LC solution, and, additionally, the variation of magnetic spots is also presented. Finally, the physical properties of the system are compared with those of other systems of both oEA and R CMa type and its extraordinary evolutionary status involving mass transfer, mass loss, and angular momentum redistribution scenarios is discussed.
2. Ground-based spectroscopy
Spectroscopic observations were made in 2016 with the 2.3 m Ritchey–Cretien “Aristarchos” telescope at Helmos Observatory in Greece using the Aristarchos Transient Spectrometer3 (ATS, Boumis et al. 2004). The ATS is a low-to-medium dispersion fibre spectrometer that consists of 50 fibres (50 μm diameter each) providing a field-of-view of ~10 arcsec on the sky and is equipped with the U47-MB Apogee (Back illuminated, 1024 × 1024 pixels, 13 μm2 pixel size) CCD camera. The low-resolution grating (600 lines mm−1) was used for the observations, which provided a spectral coverage between approximately 4000 and 7260 Å and a resolution of ~3.2 Å pixel−1.
The observations were aimed towards the spectral classification of the primary component of KIC 8553788 in order to use it later for the photometric modelling (see Sect. 3). For this, approximately 45 spectroscopic standard stars, suggested by GEMINI Observatory4, ranging from B0V to K8V spectral types were observed between July and October with the same instrumental set-up as that of the target star. The system was observed on 6 Oct 2016 during the orbital phase ~0.31. Two spectra with an integration time of 15 min were obtained and stacked in order to achieve a better signal-to-noise ratio (S/N). The prereduction of the images containing science and calibration spectra, which includes bias, dark, and flat-field corrections, was made using the MaxIm DL software, while the data reduction (wavelength calibration, cosmic ray removal, spectra normalization, sky background removal) was performed using the RAVERE v.2.2c software (Nelson 2009).
All spectra were normalized in order to be directly comparable, and then shifted using the Balmer lines as reference, to compensate for the relative Doppler shifts of each standard and the system under study. The Balmer (i.e. Hα–Hδ) and many strong metallic lines (e.g. MgI-triplet, NaI-doublet), which are sensitive to temperature, were used for the spectral classification. In particular, the depths of the aforementioned lines were calculated in each spectrum of the standard stars and compared with those of KIC 8553788 deriving sums of squared residuals (Σ res2) in each case. The least squares sum guided us to the closest match between the spectra of target and standards.
The best match of the spectrum of the system was found with that of an A8V standard star. Comparison spectra of KIC 8553788 and standard stars with the closest spectral types are illustrated in Fig. 3. The respective spectral type-search plot that shows the differences in terms of Σ res2 between the spectra of the system under study and the standard stars is given in Fig. 4. Although the spectra of KIC 8553788 were obtained during an out of eclipse phase, it can plausibly be assumed that they reflect the spectral type of its primary component (i.e. more luminous), since, as shown in the following section, the secondary contributes less than 4% to the total luminosity.
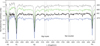 |
Fig. 3. Comparison spectra of KIC 8553788 and standard stars with the closest spectral types. The Balmer and some strong metallic lines are also indicated. The A7V spectrum belongs to HIP 13904, the A8V to HIP 90345, and the A9V to HIP 10830. |
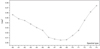 |
Fig. 4. Spectral type-search plot for KIC 8553788. Points denote the differences between the spectrum of the system and those of the standard stars of various spectral types. The comparison is shown only between A and F spectral types due to scaling reasons. |
Concluding, according to the above method and the effective temperature-spectral type relation of Cox (2000), the primary component of KIC 8553788 is an A8V star with a formal error of one subclass and is assigned a temperature of 7600 ± 200 K. This result comes in slight disagreement with the temperature given in the KEBC catalogue (8045 K, Prša et al. 2011, photometry based method), in very good agreement with the spectral type given in the Tycho catalogue (A7V, Pickles & Depagne 2010, color index based method), and is quite close to the classification based on the LAMOST data (A5IV–A8III, Frasca et al. 2016, spectroscopic method).
3. Light curve modelling and absolute parameters calculation
KIC 8553788 was included in all long-cadence quarters of the Kepler mission, but during Q5 and Q14 the observations were made in SC mode. Given that two of the main goals of the present paper are (a) the very accurate LC modelling, leading to (b) a high precision asteroseismic modelling, only the SC data (taken from KEBC, Prša et al. 2011) were used. The SC data offer continuous recording of a target (i.e. no time gaps) with a relatively high time resolution and provide the means to detect both slow and fast pulsation frequencies. In particular, 46154 and 34832 points, which correspond to Q5 and Q14 data sets, respectively, were used to obtain the LC models. The observations cover 19 full LCs during Q5 and 14 during Q14; therefore approximately 2350 points per LC are available. It should be noted that according to the MAST archive, the level of light contamination of the system is zero.
The first step for the LC modelling was the creation of one simple mean LC in order to apply the “q-search” method and roughly estimate the photometric mass ratio of the system, since only one RV curve was available (see Sect. 1). The main problem was that the LCs are superimposed by the pulsation features, which, in general, negatively affect the modelling, while, additionally, photospheric spots produce extra asymmetries. In order to overcome the aforementioned inhomogeneities, all the LCs were folded into the EB’s orbital period and average points (i.e. approximately 1 mean point every 135 original points) were calculated. The final binned LC contained approximately only 600 data points. The ephemeris used for the phase folding is given in the KEBC (Prša et al. 2011) and is also included in Table 1.
The second step was the rough estimation of the photometric mass ratio of the system. For this, the software PHOEBE v.0.29d (Prša & Zwitter 2005), which is based on the 2003 version of the Wilson–Devinney (W–D) code (Wilson & Devinney 1971; Wilson 1979, 1990), was used. In absence of spectroscopic mass ratio, the “q-search” method (for details see Liakos & Niarchos 2012) was applied in modes 2 (detached system), 4 (semi-detached system with the primary component filling its Roche lobe) and 5 (conventional semi-detached binary). The step of q change was 0.05–0.1 starting from q = 0.025. The effective temperature of the primary was given the present spectroscopic value (see Sect. 2) and the third light option was initially enabled, given that the system may have a tertiary component (see Sect. 1). The method followed for the LC fitting regarding the fixed (filter, albedos A, gravity g, and limb darkening x coefficients) and the adjusted parameters (inclination i, Roche potentials Ω, relative luminosities, temperature of the secondary component) is described in detail in Liakos (2017).
The “q-search” method showed very good results for both modes 2 and 5. The difference in terms of Σ res2 is small, as shown in the q-search plot in Fig. 5, with the solution of mode 5 being marginally better. In particular, the minimum Σ res2 was found for q = 0.05 in mode 5 and for q = 0.25 in mode 2. Initially, it seemed that the mean LC of this system could be described sufficiently by both modes. Therefore, potentially, we would not be able to determine the properties of its components with a unique solution. Fortunately, the answer to this dilemma was given by the RV of the primary component (K1 = 8.6 ± 0.7 km s−1, Matson et al. 2017). If the model of mode 2 was adopted, then the derived absolute parameters of the components would result in very unrealistic values (i.e. the masses derived are M1 = 0.012 M⊙ and M2 = 0.003 M⊙). Therefore, mode 5 was selected as the most appropriate solution. It should be noted that we also attempted to fit the LC in mode 2 using very low q values (i.e. 0.02–0.1), following the works of Lehmann et al. (2013) and Lee et al. (2017, 2018), but after each iteration the secondary component was always overflowing its Roche lobe. The latter was also tested with and without the use of the third light parameter but the results did not show any significant difference.
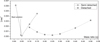 |
Fig. 5. q-search plots for KIC 8553788 in detached (squares) and semidetached modes (circles). |
The final model of each individual LC in mode 5 was achieved by setting q = 0.05 as the initial mass ratio value, which was adjusted later during the iterations. Similarly, the rest parameters were initially given values that derived from the best solution of the “q-search” method and then were left free during the iterations. Due to maxima brightness changes between successive LCs, one photospheric spot on the surface of the secondary component was assumed for the data of Q5, while two spots on the same star were needed for the Q14 data set. The selection of the magnetically active component was based on the temperature values. The primary star is of A8 spectral type (see Sect. 2), therefore, it is very unlikely to host a convective envelope, which is required for photospheric spots, in contrast with the secondary, which is much cooler. Moreover, as is shown in the following section, the primary is a δ Sct pulsator and therefore magnetic activity exhibition is quite unlikely. The third light parameter was also adjusted, but since it resulted in unrealistic values, it was omitted from the final solutions.
Three sets of parameters are presented in Table 1: (a) the system parameters, (b) the component parameters, and (c) the absolute parameters of the components. The (a) and (b) sets contain both assumed and derived values for all the parameters used for the LCs models. However, since 19 and 14 models for Q5 and Q14 data sets, respectively, were derived, the values of the adjusted parameters are the averages of the same parameters of the individual LC models, while the errors are the standard deviation of them, except for the T2 and q quantities, which are discussed below. In order to achieve a more realistic error for T2, the error of T1 was taken into account. Tests on individual LCs showed that T2 is very sensitive to T1 changes, and specifically that for a 200 K decrease or increase of T1 (i.e. the spectroscopic error of T1), the value of T2 follows a respective change of approximately 100 K. Therefore, this error was summed in quadrature to the standard deviation of T2 as derived from the LC fittings. Moreover, the error of mass ratio is another matter of discussion. In particular, the value derived as the standard deviation of the respective q values from all the LC models was 0.001, which seems too low when compared with spectroscopically determined mass ratio errors (c.f. Matson et al. 2017). This is obviously correlated with the density of the data points available for an RV fit (i.e. a few dozen at best) and the respective data point density of a photometric LC (i.e. order of several thousands). However, in order to obtain a more realistic error value for q, the mass function is taken into account using the Porb and K1 values and their errors: (1)
(1)
where M1, M2, K1, i, and Porb are explained in Table 1 and G is the gravitational constant. Following the error propagation method and assuming M1 = 1.6 M⊙, then according to the definition of mass ratio (Table 1), the error of q is derived as 0.0031, which is adopted as the final value. The parameters of the set (c) were calculated using the software ABSPAREB (Liakos 2015) in mode 2 and they have the usual meaning. In Fig. 6, we show the photometric model on one LC and the three-dimensional (3D) Roche geometry representation of the system, while in Fig. 7 (upper and middle panels) and Fig. 8 we illustrate the SC data and their residuals after the subtraction of the theoretical LCs for the two data sets.
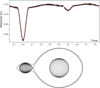 |
Fig. 6. Upper panel: theoretical (solid line) over observed (points) LC for KIC 8553788. Lower panel: 3D representation of the Roche geometry of the system at orbital phase 0.75. |
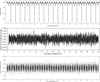 |
Fig. 7. Upper panel: short cadence LCs of Q5 for KIC 8553788. Middle panel: LC residuals after the subtraction of the binary models. Bottom panel: LC residuals after the subtraction of the pulsation model. |
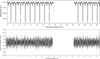 |
Fig. 8. Upper panel: short cadence LCs of Q14 for KIC 8553788. Bottom panel: LC residuals after the subtraction of the binary models. |
During the modelling of the individual LCs, it was noticed that the spots migrate from one day to another; although this is a by-product result and a detailed study is not an aim of the present paper, their parameters are listed in Table B.1. Moreover, in the same appendix, plots are given showing the location changes of the spots as well as their location on the surface of the secondary component on the first and the last days of each data set (Figs. B.1–B.3).
The reliability of the solution, especially for the extremely low value of the mass ratio, may be checked in the future using the RVs of the secondary component. However, it should to be noted that according to Kallrath & Milone (1999, their Sect. 4.1.1.1) the photometric mass ratio can be determined with great confidence for lobe-filling or overcontact systems when at least one light curve and one RV curve exist. Moreover, another useful and recent example regarding the reliability of the “q-search” method concerns the semidetached systems KIC 10581918 and KIC 10619109. Liakos (2017) determined their mass ratio values based only on their Kepler LCs and without any use of RVs. These photometric values of q were later seen to be in very close agreement with the spectroscopically determined ones of Matson et al. (2017).
Concluding, KIC 8553788 was found to be in a semi-detached state, with the less massive and cooler component filling its Roche lobe, and to have a very low mass ratio of 0.043. Its primary component is a dwarf star, while its secondary, although much less massive, is more evolved, and, additionally, presents magnetic activity. The evolution of this EB is discussed further in Sect. 5.
Light curve and absolute parameters for KIC 8553788.
4. Pulsations analysis
Except for the light variations due to successive eclipses between the components of the system and the magnetic activity of its secondary, more periodic variations of much shorter timescales were found to occur. This is obvious also in the upper section of Fig. 6, especially in the phase parts between the eclipses. The short-term variability is clearly attributed to intrinsic pulsations.
In order to identify these oscillations, a frequency analysis was carried out on the LC residuals with the software PERIOD04 v.1.2 (Lenz & Breger 2005), which is based on classical Fourier analysis. The typical frequency range for δ Sct stars is between 4 and 80 cycle d−1 (Breger 2000). The analysis should, therefore, be made for this regime. Moreover, taking into account the fact that in many δ Sct stars in binary systems, g-mode pulsations, which are connected to their Porb, may occur or that these stars may even be γ Dor-δ Sct hybrids, the search was extended to 0–80 cycle d−1.
Although the SC data of Q14 cover adequate observational time (~31 days), they present a long time gap of approximately 7 days between the 16th and 22nd days of observations. Given the critical role of continuous data points in the frequency search (e.g. false detections of alias frequencies, Breger 2000), the data of Q14 were not included in the analysis. On the other hand, the data of Q5 do not suffer from any gaps; they cover a time period of ~32 days, therefore, they serve much better the purposes of such an analysis. The LC residuals derived from the subtraction of the photometric model from the observed data points (see Sect. 3) are considered unaffected by any binary influences (e.g. eclipses, asymmetries due to spots). However, although the secondary component has a very small light contribution to the total light of the EB, it was thought wise to exclude the data obtained during the eclipses (i.e. between 0.445–0.555 and 0.940–1.060 phase parts), since the pulsations that occur in these phase parts are affected in a non-uniform way, in contrast with those in the other regions (i.e. constant light from both components).
In order to calculate all the significant pulsation frequencies, the same method for the background noise estimation as stated in Liakos (2017) was followed. In particular, the background noise was calculated in the range 70–80 cycle d−1, where no obvious frequencies exist; a spacing of 2 cycle d−1 and a box size of 2 were used and it was found to be 9.18 μmag. Regarding the significance of a detected frequency, the same limit (i.e. 4σ, S/N > 4) as that suggested by the software was adopted. Therefore the threshold for a validated frequency was 3.67 × 10⁻² mmag. The Nyquist number of the data set was 725.02 and the frequency resolution according to the Rayleigh-Criterion (i.e. 1.5/T, where T is the observation time range in days) was 0.0469 cycle d−1. Finally, after the first frequency computation, the residuals were subsequently pre-whitened for the next one until the detected frequency had S/N ~ 4.
Six independent frequencies were found in the range 45–59 cycle d−1, while another 83 were also detected and identified as a combination or harmonics of others. The independent frequencies are listed in Table 2, while the others are shown in Table A.1. Both tables include the frequency values fi (where i is an increasing number), the semi-amplitudes A, the phases Φ, and S/N. Additionally, the last two columns of Table 2 include the pulsation constants (Q) and the Ppul/Porb ratio of each frequency, while the last column of Table A.1 contains the frequency combination. In Fig. 9, we present the Fourier Fit on individual data points for two different days of observations, and in Fig. 10 the periodogram of the frequency search is illustrated. Furthermore, the bottom section of Fig. 7 shows the residuals after subtracting the Fourier model.
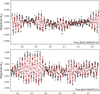 |
Fig. 9. Fourier fit (solid line) on various data points of Q5 for KIC 8553788. |
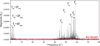 |
Fig. 10. Periodogram for KIC 8553788 for the Q5 data. The independent frequencies, the strong frequencies, that are connected to the Porb, and the 4-σ significance level are also indicated. |
Although the system lacks total eclipses, which would directly enable us to understand which of its components presents the pulsational activity (i.e. during the total eclipse of the pulsator the light variations due to the oscillations disappear), the most probable candidate for exhibiting those pulsations is the primary component. In particular, the evolutionary properties of this star, derived from the spectroscopic and LC analyses (Sects. 2 and 3), and the frequency ranges, where the independent frequencies exist, are consistent with the primary being a pulsating star of δ Sct type (see Sect. 1).
As shown in Fig. 10, there are clearly two groups of frequencies; one is located in the range 0–5 cycle d−1 and the other in the range 42–61 cycle d−1. In total, 19 frequencies were detected in the first regime, 68 in the second, and two more between 26 and 30 cycle d−1 (i.e. f62 and f74). The relatively large number of frequencies detected in the slow oscillations regime (0–5 cycle d−1) suggests a possible δ Sct-γ Dor hybrid behavior for the pulsator. However, none of these frequencies was identified as independent and the majority are connected to the orbital frequency of the system (forb = 0.62260 cycle d−1). Therefore, according to the criteria of Uytterhoeven et al. (2011) for characterising possible hybrid pulsators, together with the present results, we come to the conclusion that the primary of this system is a pure δ Sct pulsating star.
The characterisation of the oscillation modes (i.e. radial, non-radial) of the independent frequencies was based on two methods. The first concerns the comparison of the pulsation constants of the independent frequencies (see Table 2) with those predicted by the theoretical models of Fitch (1981) for M = 1.5 M⊙. The second one compares the ratios Ppul/Porb for each frequency with those of other, similar systems (Zhang et al. 2013). For the calculations of Q, the relation of Breger (2000) was used: (2)
(2)
where f is the pulsation frequency, and log g, Mbol, and Teff denote the standard quantities (see Table 1). All frequencies, except for f5, were identified as non-radial p-modes of l = 3 degrees (p7l3), while f5 was identified as the seventh harmonic of the radial fundamental (R7H) mode. It should be noted that the ratio f5/f1 ~ 0.78 has the closest value to 0.77, which was defined by Stellingwerf (1979) as the typical ratio for the radial fundamental to the first overtone mode. For the second method, regarding the empirical limit of Zhang et al. (2013; i.e. frequencies with Ppul/Porb < 0.07 potentially belong to the p-mode region), it was found that the independent frequencies are below that threshold, and therefore may simply be p-modes.
According to the results of the frequency analysis (i.e. frequency values, frequency ranges) it can plausibly be concluded that the pulsating component of the system is a multiperiodic δ Sct star that oscillates mainly in five pressure modes and probably one radial mode accompanied by slower oscillations related to the presence of the companion star.
Independent oscillation frequencies for KIC 8553788.
5. Evolution
This section includes all the possible scenarios for the physical and orbital evolution of the system under study.
Figures 11 and 12 show the locations of both components of KIC 8553788 within the mass–radius (M–R) and Hertzsprung–Russell (HR) evolutionary diagrams, respectively, along with stars that belong to oEA and R CMa systems. Zero and Terminal Age (ZAMS and TAMS, respectively) main-sequence lines (for solar metallicity composition) for these diagrams were taken from Girardi et al. (2000), the positions of the stars of oEA systems from Liakos & Niarchos (2017), and those of R CMa systems from the literature (see Sect. 1 for individual systems). In both diagrams, the pulsator of the studied system is shown to lie well inside the main-sequence boundaries. The best theoretical evolutionary model (Girardi et al. 2000), which best fits its position in the HR diagram, is that of a star with mass M = 1.7 M⊙, which is very close to the value derived in the present study (i.e. M1 = 1.6 ± 0.4 M⊙), also showing that this component is slightly more luminous for its mass. On the other hand, the secondary component was found oversized and overluminous for its mass (M2 = 0.07 ± 0.01 M⊙). It is located on the left side in the M–R diagram far away from the other secondary components of oEA and R CMa systems, and on the lower right part in the HR diagram where it can be identified as the second least luminous component of all systems and the least luminous among the secondaries that are not yet in the WD stage.
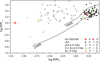 |
Fig. 11. Location of the components of KIC 8553788 (star symbols) within the Mass–Radius diagram among others of oEA systems (dot symbols) and others that belong to both oEA and R CMa systems (square symbols). The diamond symbols denote the detached systems with a δ Scuti primary component that are also members of the R CMa group, while the hexagon symbol shows the only semi-detached R CMa system that does not exhibit pulsations. Filled and open symbols represent the primary and the secondary components, respectively. Theoretical ZAMS and TAMS lines were taken from Girardi et al. (2000). |
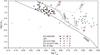 |
Fig. 12. Location of the components of KIC 8553788 within the HR diagram. The dashed line denotes the best fit theoretical model for the primary component and the coloured lines the Blue (B) and the Red (R) edges of the instability strip (IS). Symbols and rest lines represent the same as in Fig. 11. |
The most likely explanation scenario for the system regarding its Porb, q, and the properties of the secondary component is the case-B of binary evolution on a nuclear timescale as given by de Loore & Doom (1992). According to this scenario, a mass ratio inverse took place in the system in the past. In particular, the present secondary component was initially the primary one (more massive) and its critical Roche lobe radius became larger than its stellar radius at the end of the core hydrogen burning but smaller than that at the beginning of He fusion. Therefore, the mass transfer began when the outer layers of the star were expanding, its luminosity decreased, reached a minimum and started to rise again. The core of the star may have became degenerated as the hydrogen shell decreased but given that this process was slow (i.e. slow decrease of core radius), there was probably no rapid expansion of the envelope, and therefore no rapid mass transfer.
However, this very low q value also supports a hypothesis of non-conservative mass transfer accompanied by mass loss due to magnetic braking from the system. It seems that this scenario can be potentially supported by the current finding of magnetic activity in the secondary component. Unfortunately, the ETV diagram of the system covers only approximately a decade of its life, therefore no sign of mass transfer/loss can be verified yet via steady increase/decrease of the Porb, but only cyclic changes, which are discussed below. However, a further argument regarding the absence of secular changes of the Porb in the ETV can be considered useful. For this the formula for secular period changes (ΔPorb/Porb) suggested by Erdem et al. (2005) will be used: (3)
(3)
where k is the gyration constant of the mass donor, a the semimajor axis of the EB, ṁtrans the mass transfer rate from the less to the more massive component, and ṁloss the mass loss rate from the system up to the Alfvén radius rA. Using the parameters of Table 1, assuming typical values for the k and rA parameters (cf. k = 0.32, rA = 10a, Erdem et al. 2005), and adopting a typical ṁtrans for Algols (i.e. 10−8M⊙ yr−1), which will lead to very low ΔPorb (i.e. ~5 × 10⁻¹⁰ d yr−1) being detected in a few years, a mass loss rate of ~10−9M⊙ yr−1 is derived. Therefore, according to these assumptions, the hypothesis of non-conservative mass transfer may be possible but not yet detectable.
Zasche et al. (2015) and Borkovits et al. (2016) published the ETV analysis of the system resulting in the potential presence of a third body in a highly eccentric orbit. The mass functions for the tertiary (f (m3)) derived from these studies were 0.043 M⊙ and 0.07 M⊙, respectively. Moreover, Zasche et al. (2015), assuming equal mass values for the components and a detached configuration for the system, found a third light contribution of ~6.6%. Borkovits et al. (2016), based on an assumption of a total mass of 2 M⊙ for the components of the EB, suggested a minimum mass of m3,min ~ 0.81 M⊙. In order to calculate the updated minimum mass of the third body, the derived parameters of the present study (Table 1), and the third body’s mass function formula of Mayer (1990) were used. Assuming a coplanar orbit of the tertiary component, minimum masses of m3,min = 0.61 M⊙ and 0.74 M⊙ were derived for each f (m3) of the aforementioned studies, respectively. Therefore, following the method of Liakos et al. (2011) (i.e. assuming the main-sequence nature of the third component) and using the InPeVEB software (Liakos 2015), it was found that for the first case, the third light contribution should be ~1.5%, while for the second this should be ~3%. These values can be considered, on one hand, as relatively low for the third component to be detected photometrically, but, on the other hand, not impossible. Therefore, the absence of a third light from the present photometric solution enables a few scenarios regarding the nature of the additional member. This component could be either an evolved star (e.g. WD), that is less luminous, or it could be a low-mass binary system with late-type components that emit an undetectable amount of light. However, since the mass of the tertiary can be increased significantly by rejecting the coplanar orbit assumption, further speculation regarding its nature was found to be meaningless.
Since it was found that there is magnetic activity in the system (see Sect. 3), the Applegate’s mechanism (i.e. quadrupole moment variation ΔQ, Applegate 1992) was also tested as an alternative explanation for the cyclic orbital period changes. For this, the ETV amplitudes and the periods of the cyclic modulation given in the works of Zasche et al. (2015) and Borkovits et al. (2016), and the absolute parameters of the secondary component (Table 1) were used in the formula of Lanza & Rodonò (2002), which is applied in the INPEVEB software (Liakos 2015). The results showed that ΔQ is of the order of 1049 gr cm2, which is too low (criterion established by Lanza & Rodonò 2002) to modulate the Porb of the EB.
In conclusion, the existence of a third component in a wide eccentric orbit is speculated, but so far neither its presence nor its nature can be verified with direct measurements (photometry, spectroscopy). However, the low q, Porb values of the EB can be somehow connected to this unseen member. According to Budding & Butland (2011), conservative mass transfer scenarios for the R CMa systems do not reflect their past and a non-conservative angular momentum redistribution between the tertiary component and the EB might be the explanation for the combination of low q, Porb.
6. Discussion and conclusions
This paper focuses on the detailed analyses of KIC 8553788, an EB that was observed by the Kepler mission. The SC data of Kepler along with ground-based spectroscopic observations that allowed the estimation of the spectral type of the brighter star of the system, and the literature RV curve of the primary component provided the means for the most accurate photometric modelling to be performed to date. Consequently, the absolute parameters of both components were derived revealing a very low mass ratio for the system (q = 0.043). Moreover, it was found that the primary component is a δ Scuti-type star that pulsates in six independent frequencies and in another 83 dependent ones or harmonics of others. The secondary component was found to have an extremely low mass value (M2 = 0.07 M⊙), while migrating photospheric spots on its surface were also detected.
Comparison between the results from the present LC analysis and those of Zasche et al. (2015) shows large discrepancies due to the different approach followed in each case. In particular, the temperature ratio (T2/T1) and the inclination were found to be ~0.58 and ~75° in the present study, respectively, while Zasche et al. (2015) found ~0.64 and ~70°, respectively. In addition, Zasche et al. (2015) found a third light contribution of ~6.6%, something that was not confirmed by the present results. The main reason for these differences concerns the inclusion of spectroscopic data in the present analysis. Zasche et al. (2015) assumed a priori a detached system with q = 1, while the present results are strongly based on the RV curve (Matson et al. 2017) and the spectroscopically determined temperature (see Sect. 2) of the primary component and on the “q-search” method.
The system was found to be in a conventional semi-detached status, and therefore, according to the definition of oEA stars (Mkrtichian et al. 2002), it can be considered as a member of this group. Moreover, its classical Algol-type status, its relatively short Porb and its low q are characteristics that lie well inside the regime of properties of the group of R CMa-type systems as defined by Budding & Butland (2011). The rarity of this system is owed to the fact that it is a member of two different groups at the same time, with only two other systems, namely R CMa and AS Eri, showing similar characteristics (see Fig. 1).
The primary component of the system was found to be the 4th fastest δ Scuti star (f1 = 58.26 cycle d−1) among the oEA systems that have been found to date. According to the catalogue of Liakos & Niarchos (2017), there are only another four oEA systems with components that pulsate between 58 and 65 cycle d−1, namely KIC 11175495 (64.44 cycle d−1, Liakos 2017), RZ Cas (64.20 cycle d−1, Soydugan & Soydugan 2007), AS Eri (59.03 cycle d−1, Mkrtichian et al. 2004; İbanoǧlu et al. 2006), and AU Lac (58.22 cycle d−1, Liakos et al. 2012), while below that range there is a gap between 53 and 58 cycle d−1, where no systems have been found. In Fig. 13 we show the location of the pulsator of KIC 8553788 within the Porb–Ppul correlation diagram for oEA stars along with the empirical fit of Liakos & Niarchos (2017). The system is one of the most deviating cases from the fit, because of its very fast pulsating frequency that does not follow the trend between orbital and pulsation periods. One possible explanation for this system, but also for the other deviating ones (i.e. very fast pulsators), might be the mass accretion from the secondary components. However, this cannot be verified yet, since the ETV diagrams of the aforementioned systems (see Kreiner et al. (2001, for RZ Cas, AS Eri, and AU Lac), Gies et al. (2015, for KIC 11175495)) do not show any significant parabolic trend that could be attributed to mass transfer. In Fig. 14, we provide the distribution of the pulsators of oEA systems in the log g–log Ppul diagram. The oscillating member of KIC 8553788, although it is very close to the fit of Liakos & Niarchos (2017, updated by Liakos 2017), is the only one below that, in contrast with the other four similar stars (upper-left part of Fig. 14). If confirmed by spectroscopic measurements of the secondary component, this system would have the smallest mass ratio among these four EBs and although its primary has the smallest mass among the other pulsators, it would be the most evolved. This fact probably shows that the mass transfer in KIC 8553788 has greater rate or began earlier in comparison with the other systems and has led the primary to evolve faster.
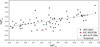 |
Fig. 13. Location of the pulsating component of KIC 8553788 within the Porb–Ppul diagram among others of oEA systems and others that belong to both oEA and R CMa systems. The star, dot, and square symbols have the same meaning as in Fig. 11. Dashed line denotes the empirical fit of Liakos & Niarchos (2017). |
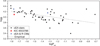 |
Fig. 14. Location of the pulsating component of KIC 8553788 within the log g–Ppul diagram among other stars of systems of similar types. Symbols and line represent the same as in Fig. 13. |
Possible evolutionary scenarios with respect to the present status of the system were discussed. Although there is lack of evidence in its ETV diagram of a secular modulating mechanism of the Porb, it seems that non-conservative mass transfer, mass loss from the system, and/or angular momentum redistribution from the EB to the tertiary component are the mechanisms that drove the system to have this extremely low mass ratio value.
Comparison of the mass ratio of KIC 8553788 was made with the semi-detached systems included in the catalogues of Budding et al. (2004), İbanoǧlu et al. (2006), and Soydugan et al. (2006b). Results show that, indeed, this EB has the lowest value among them, therefore it can be fairly considered as a potentially (i.e. RV data of the secondary component are needed to confirm it) extreme case (cf. Gullikson et al. 2016; Ducati et al. 2011; Boffin 2010).
Undoubtedly, KIC 8553788 is a very rare case of binary systems in terms of evolutionary and physical properties. In can be considered as a valuable case for the binary evolution modelling theorists, especially for its very low mass ratio. Long-term monitoring (e.g. decades) of the system for eclipse-timing acquisitions will probably shed light on its orbital evolution and help us to further constrain the current evolutionary scenarios. In general, both the groups of oEA and R CMa systems are still small, therefore any enrichment can be considered as very valuable and scientifically extremely important.
Acknowledgments
The author acknowledges financial support by the European Space Agency (ESA) under the Near Earth object Lunar Impacts and Optical TrAnsients (NELIOTA) programme, contract no. 4000112943. The author also wishes to thank Dr. Panayotis Boumis for his suggestions, Mrs Maria Pizga and Mrs Joanne Barton for proofreading the text, and the anonymous reviewer for the valuable comments. The “Aristarchos” telescope is operated on Helmos Observatory by the Institute for Astronomy, Astrophysics, Space Applications and Remote Sensing of the National Observatory of Athens. This research has made use of NASA’s Astrophysics Data System Bibliographic Services, the SIMBAD, the Mikulski Archive for Space Telescopes (MAST), and the Kepler Eclipsing Binary Catalog databases.
References
- Applegate, J. H. 1992, ApJ, 385, 621 [NASA ADS] [CrossRef] [Google Scholar]
- Balona, L. A., Daszyńska-Daszkiewicz, J., & Pamyatnykh, A. A. 2015, MNRAS, 452, 3073 [NASA ADS] [CrossRef] [Google Scholar]
- Boffin, H. M. J. 2010, A&A, 524, 14 [Google Scholar]
- Borkovits, T., Hajdu, T., Sztakovics, J., et al. 2016, MNRAS, 455, 4136 [NASA ADS] [CrossRef] [Google Scholar]
- Boumis, P., Meaburn, J., & Goudis, C. D. 2004, in Hellenic Astronomical Society Sixth Astronomical Conf., ed. P. Laskarides, 313 [Google Scholar]
- Breger, M. 2000, in Delta Scuti and Related Stars, eds. M. Breger, & M. Montgomery, ASP Conf. Ser., 210, 3 [Google Scholar]
- Budding, E., & Butland, R. 2011, MNRAS, 418, 1764 [NASA ADS] [CrossRef] [Google Scholar]
- Budding, E., Erdem, A., Çiçek, C., et al. 2004, A&A, 417, 263 [NASA ADS] [CrossRef] [EDP Sciences] [Google Scholar]
- Cox, A. N. 2000, Allen’s Astrophysical Quantities, 4th edn. (New York: Springer-Verlag) [Google Scholar]
- de Loore, C. W. H., & Doom, C. 1992, Structure and Evolution of Single and Binary Stars (Dordrecht, The Netherlands: Kluwer Academic Publishers) [Google Scholar]
- Ducati, J. R., Penteado, E. M., & Turcati, R. 2011, A&A, 525, 26 [Google Scholar]
- Erdem, A., Budding, E., Demircan, O., et al. 2005, Astron. Nachr., 326, 332 [Google Scholar]
- Faigler, S., Kull, I., Mazeh, T., et al. 2015, ApJ, 815, 26 [Google Scholar]
- Fitch, W. S. 1981, ApJ, 249, 218 [NASA ADS] [CrossRef] [Google Scholar]
- Frasca, A., Molenda-Żakowicz, J., De Cat, P., et al. 2016, A&A, 594, 39 [Google Scholar]
- Gies, D. R., Williams, S. J., Matson, R. A., et al. 2012, AJ, 143, 137 [NASA ADS] [CrossRef] [Google Scholar]
- Gies, D. R., Matson, R. A., Guo, Z., et al. 2015, AJ, 150, 178 [NASA ADS] [CrossRef] [Google Scholar]
- Girardi, L., Bressan, A., Bertelli, G., & Chiosi, C. 2000, A&AS, 141, 371 [NASA ADS] [CrossRef] [EDP Sciences] [Google Scholar]
- Gullikson, K., Kraus, A., & Dodson-Robinson, S. 2016, AJ, 152, 40 [NASA ADS] [CrossRef] [Google Scholar]
- Guo, Z., Gies, D. R., Matson, R. A., et al. 2017, ApJ, 837, 114 [NASA ADS] [CrossRef] [Google Scholar]
- İbanoǧlu, C., Soydugan, F., Soydugan, E., & Dervişoǧlu, A. 2006, MNRAS, 373, 435 [NASA ADS] [CrossRef] [Google Scholar]
- Kahraman Aliçavu¸s, F., Niemczura, E., Polińska, M., et al. 2017, MNRAS, 470, 4408 [NASA ADS] [CrossRef] [Google Scholar]
- Kallrath, J., & Milone, E. F. 1999, Eclipsing Binary Stars: Modeling and Analysis (New York: Springer) [CrossRef] [Google Scholar]
- Kaluzny, J., Thompson, I. B., Rucinski, S. M., et al. 2007, AJ, 134, 541 [NASA ADS] [CrossRef] [Google Scholar]
- Kreiner, J. M., Kim, C.-H., & Nha I.-S. 2001, An Atlas of O–C Diagrams of Eclipsing Binary Stars (Cracow, Poland: Wydawnictwo Naukowe Akademii Pedagogicznej) [Google Scholar]
- Lanza, A. F., & Rodonò, M. 2002, Astron. Nachr., 323, 424 [NASA ADS] [CrossRef] [Google Scholar]
- Lee, J.-W., Hong, K., Kim, S.-L., & Koo, J.-R. 2016, MNRAS, 460, 4220 [NASA ADS] [CrossRef] [Google Scholar]
- Lee, J.-W., Hong, K., Kim, S.-L., & Koo, J.-R. 2017, ApJ, 835, 189 [NASA ADS] [CrossRef] [Google Scholar]
- Lee, J.-W., Hong, K., Koo, J.-R., & Park, J.-H. 2018, AJ, 155, 5 [NASA ADS] [CrossRef] [Google Scholar]
- Lehmann, H., Southworth, J., Tkachenko, A., & Pavlovski, K. 2013, A&A, 557, 79 [Google Scholar]
- Lenz, P., & Breger, M. 2005, Commun. Asteroseismol., 146, 53 [NASA ADS] [CrossRef] [Google Scholar]
- Liakos, A. 2015, in Living Together: Planets, Host Stars and Binaries, eds. S. M. Rucinski, G. Torres, & M. Zejda, ASP Conf. Ser., 496, 286 [Google Scholar]
- Liakos, A. 2017, A&A, 607, 85 [Google Scholar]
- Liakos, A., & Niarchos, P. 2012, New Ast., 17, 634 [NASA ADS] [CrossRef] [Google Scholar]
- Liakos, A., & Niarchos, P. 2017, MNRAS, 465, 1181 [NASA ADS] [CrossRef] [Google Scholar]
- Liakos, A., Zasche, P., & Niarchos, P. 2011, New Ast., 16, 530 [NASA ADS] [CrossRef] [Google Scholar]
- Liakos, A., Niarchos, P., Soydugan, E., & Zasche, P. 2012, MNRAS, 422, 1250 [NASA ADS] [CrossRef] [Google Scholar]
- Matson, R. A., Gies, D. R., Guo, Z., & Williams, S. J. 2017, AJ, 154, 216 [NASA ADS] [CrossRef] [Google Scholar]
- Maxted, P. F. L., Serenelli, A. M., Marsh, T. R., et al. 2014, MNRAS, 444, 208 [NASA ADS] [CrossRef] [Google Scholar]
- Mayer, P. 1990, Astron. Inst. Czechaslovokia Bull., 41, 231 [Google Scholar]
- Mkrtichian, D. E., Kusakin, A. V., Gamarova, A. Y., & Nazarenko, V. 2002, in Radial and Nonradial Pulsations as Probes of Stellar Physics, eds. C. Aerts, T. R. Bedding, & J. Christensen-Dalsgaard, ASP Conf. Ser., 259, 96 [Google Scholar]
- Mkrtichian, D. E., Kusakin, A. V., Rodríguez, E., et al. 2004, A&A, 419, 1015 [NASA ADS] [CrossRef] [EDP Sciences] [Google Scholar]
- Nelson, B. 2009, RaVeRe (Radial Velocity Reductions) [Google Scholar]
- Pickles, A., & Depagne, E. 2010, PASP, 122, 1437 [NASA ADS] [CrossRef] [Google Scholar]
- Pigulski, A., Pojmański, G., Pilecki, B., & Szczygieł, D. M. 2009, Acta Astron., 59, 33 [NASA ADS] [Google Scholar]
- Prša, A., & Zwitter, T. 2005, ApJ, 628, 426 [NASA ADS] [CrossRef] [Google Scholar]
- Prša, A., Batalha, N., Slawson, R. W., et al. 2011, AJ, 141, 83 [NASA ADS] [CrossRef] [Google Scholar]
- Soydugan, E., & Soydugan, F. 2007, in Solar and Stellar Physics Through Eclipses, eds. O. Demircan, S. O. Selam, & B. Albayrak, ASP Conf. Ser., 370, 344 [Google Scholar]
- Soydugan, E., İbanoǧlu, C., Soydugan, F., Akan, M. C., & Demircan, O. 2006a, MNRAS, 366, 1289 [NASA ADS] [CrossRef] [Google Scholar]
- Soydugan, E., Soydugan, F., Demircan, O., & İbanoǧlu, C., 2006b, MNRAS, 370, 2013 [NASA ADS] [CrossRef] [Google Scholar]
- Stellingwerf, R. F. 1979, ApJ, 227, 935 [NASA ADS] [CrossRef] [Google Scholar]
- Uytterhoeven, K., Moya, A., Grigahcéne, A., et al. 2011, A&A, 534, A125 [NASA ADS] [CrossRef] [EDP Sciences] [Google Scholar]
- Wilson, R. E. 1979, ApJ, 234, 1054 [NASA ADS] [CrossRef] [Google Scholar]
- Wilson, R. E. 1990, ApJ, 356, 613 [NASA ADS] [CrossRef] [Google Scholar]
- Wilson, R. E., & Devinney, E. J. 1971, ApJ, 166, 605 [NASA ADS] [CrossRef] [Google Scholar]
- Zasche, P., Wolf, M., Kučáková, H., et al. 2015, AJ, 149, 197 [NASA ADS] [CrossRef] [Google Scholar]
- Zhang, X.-B., Luo, C.-Q., & Fu, J.-N. 2013, ApJ, 777, 77 [NASA ADS] [CrossRef] [Google Scholar]
- Zhang, X.-B., Fu, J.-N, Liu, N., Luo, C.-Q., & Ren, A. B. 2017, ApJ, 580, 125 [NASA ADS] [Google Scholar]
Appendix A: List of combined frequencies
This appendix includes in Table A.1 the depended frequency values fi (where i is an increasing number), semiamplitudes A, phases Φ, S/N and their combinations. Details for the method followed for their derivation can be found in Sect. 4.
Combined frequencies of KIC 8553788.
Appendix B: Spot migration
This appendix includes information on the spot migration for the studied system during the Q5 and Q14 quarters of the Kepler mission. Tables B.1 and B.2 include the co-latitude (co-lat.), longitude (long.), radius, and temperature factor (Tf) of each spot. The first timing given in the Time column is the starting time of the respective data set plus the half of the Porb of the EB. Each following timing has been calculated by simply adding the Porb value to the previous one.
Spot parameters for KIC 8553788 during the Q5.
Spot parameters for KIC 8553788 during the Q14.
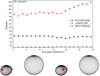 |
Fig. B.1. Upper panel: spot migration diagram for KIC 8553788 during Q5. Lower panels: location of the spot (crosses) on the surface of the secondary component during the first day (left) and the last day (right), when the system is at orbital phase 0.85. |
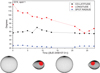 |
Fig. B.2. Upper panel: spot migration diagram for the first spot of the secondary of KIC 8553788 during Q14. Lower panels: location of the spot (crosses) on the surface of the secondary component during the first day (left) and the last day (right), when the system is at orbital phase 0.24. |
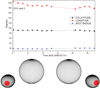 |
Fig. B.3. As in Fig. B.2, but for the second spot of KIC 8553788, when the system is at orbital phase 0.91 (lower left) and at 0.09 (lower right). |
All Tables
All Figures
|
Fig. 1. Overlap between the groups of oEA stars (71 members, denoted by dots), detached binaries with a δ Scuti component (58 members, denoted by triangles), and R CMa systems. Squares and diamonds represent the systems that belong to two different groups and the cross symbol the system OGLEGC 228, which is the only R CMa system that does not exhibit pulsations. The red star denotes KIC 8553788. |
| In the text | |
|
Fig. 2. Mass ratio distribution for oEA stars (upper section) and R CMa systems (lower section). The position of KIC 8553788 is also indicated. |
| In the text | |
|
Fig. 3. Comparison spectra of KIC 8553788 and standard stars with the closest spectral types. The Balmer and some strong metallic lines are also indicated. The A7V spectrum belongs to HIP 13904, the A8V to HIP 90345, and the A9V to HIP 10830. |
| In the text | |
|
Fig. 4. Spectral type-search plot for KIC 8553788. Points denote the differences between the spectrum of the system and those of the standard stars of various spectral types. The comparison is shown only between A and F spectral types due to scaling reasons. |
| In the text | |
|
Fig. 5. q-search plots for KIC 8553788 in detached (squares) and semidetached modes (circles). |
| In the text | |
|
Fig. 6. Upper panel: theoretical (solid line) over observed (points) LC for KIC 8553788. Lower panel: 3D representation of the Roche geometry of the system at orbital phase 0.75. |
| In the text | |
|
Fig. 7. Upper panel: short cadence LCs of Q5 for KIC 8553788. Middle panel: LC residuals after the subtraction of the binary models. Bottom panel: LC residuals after the subtraction of the pulsation model. |
| In the text | |
|
Fig. 8. Upper panel: short cadence LCs of Q14 for KIC 8553788. Bottom panel: LC residuals after the subtraction of the binary models. |
| In the text | |
|
Fig. 9. Fourier fit (solid line) on various data points of Q5 for KIC 8553788. |
| In the text | |
|
Fig. 10. Periodogram for KIC 8553788 for the Q5 data. The independent frequencies, the strong frequencies, that are connected to the Porb, and the 4-σ significance level are also indicated. |
| In the text | |
|
Fig. 11. Location of the components of KIC 8553788 (star symbols) within the Mass–Radius diagram among others of oEA systems (dot symbols) and others that belong to both oEA and R CMa systems (square symbols). The diamond symbols denote the detached systems with a δ Scuti primary component that are also members of the R CMa group, while the hexagon symbol shows the only semi-detached R CMa system that does not exhibit pulsations. Filled and open symbols represent the primary and the secondary components, respectively. Theoretical ZAMS and TAMS lines were taken from Girardi et al. (2000). |
| In the text | |
|
Fig. 12. Location of the components of KIC 8553788 within the HR diagram. The dashed line denotes the best fit theoretical model for the primary component and the coloured lines the Blue (B) and the Red (R) edges of the instability strip (IS). Symbols and rest lines represent the same as in Fig. 11. |
| In the text | |
|
Fig. 13. Location of the pulsating component of KIC 8553788 within the Porb–Ppul diagram among others of oEA systems and others that belong to both oEA and R CMa systems. The star, dot, and square symbols have the same meaning as in Fig. 11. Dashed line denotes the empirical fit of Liakos & Niarchos (2017). |
| In the text | |
|
Fig. 14. Location of the pulsating component of KIC 8553788 within the log g–Ppul diagram among other stars of systems of similar types. Symbols and line represent the same as in Fig. 13. |
| In the text | |
|
Fig. B.1. Upper panel: spot migration diagram for KIC 8553788 during Q5. Lower panels: location of the spot (crosses) on the surface of the secondary component during the first day (left) and the last day (right), when the system is at orbital phase 0.85. |
| In the text | |
|
Fig. B.2. Upper panel: spot migration diagram for the first spot of the secondary of KIC 8553788 during Q14. Lower panels: location of the spot (crosses) on the surface of the secondary component during the first day (left) and the last day (right), when the system is at orbital phase 0.24. |
| In the text | |
|
Fig. B.3. As in Fig. B.2, but for the second spot of KIC 8553788, when the system is at orbital phase 0.91 (lower left) and at 0.09 (lower right). |
| In the text | |
Current usage metrics show cumulative count of Article Views (full-text article views including HTML views, PDF and ePub downloads, according to the available data) and Abstracts Views on Vision4Press platform.
Data correspond to usage on the plateform after 2015. The current usage metrics is available 48-96 hours after online publication and is updated daily on week days.
Initial download of the metrics may take a while.