Free Access
Fig. 12.
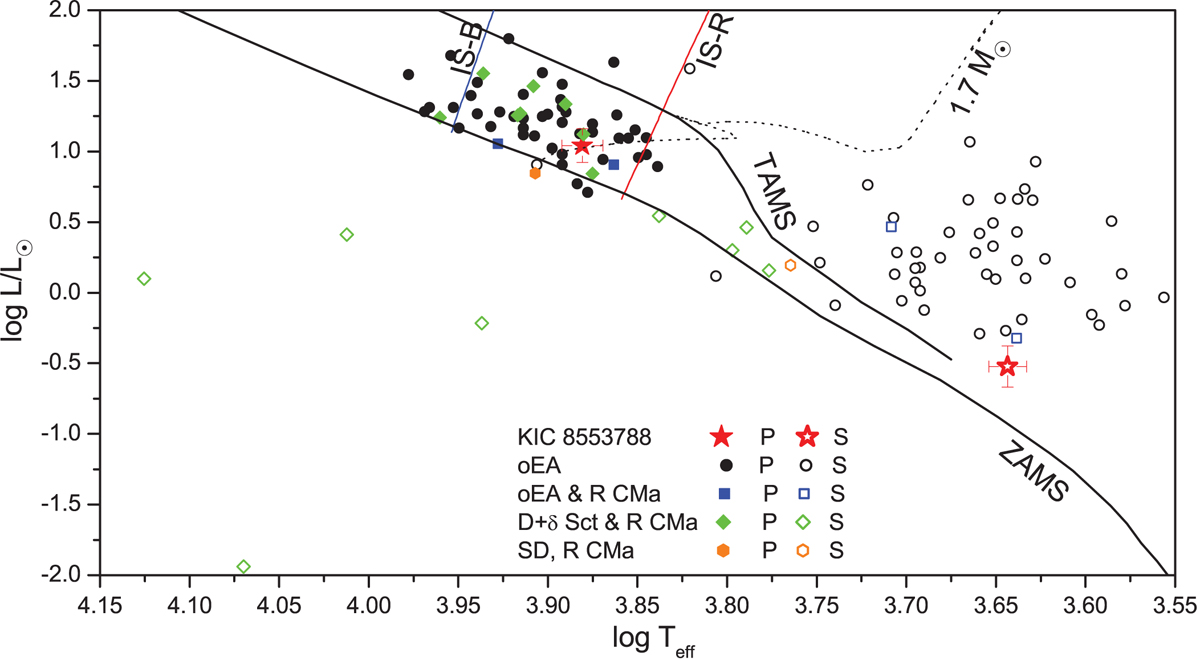
Location of the components of KIC 8553788 within the HR diagram. The dashed line denotes the best fit theoretical model for the primary component and the coloured lines the Blue (B) and the Red (R) edges of the instability strip (IS). Symbols and rest lines represent the same as in Fig. 11.
Current usage metrics show cumulative count of Article Views (full-text article views including HTML views, PDF and ePub downloads, according to the available data) and Abstracts Views on Vision4Press platform.
Data correspond to usage on the plateform after 2015. The current usage metrics is available 48-96 hours after online publication and is updated daily on week days.
Initial download of the metrics may take a while.