Free Access
Fig. B.1.
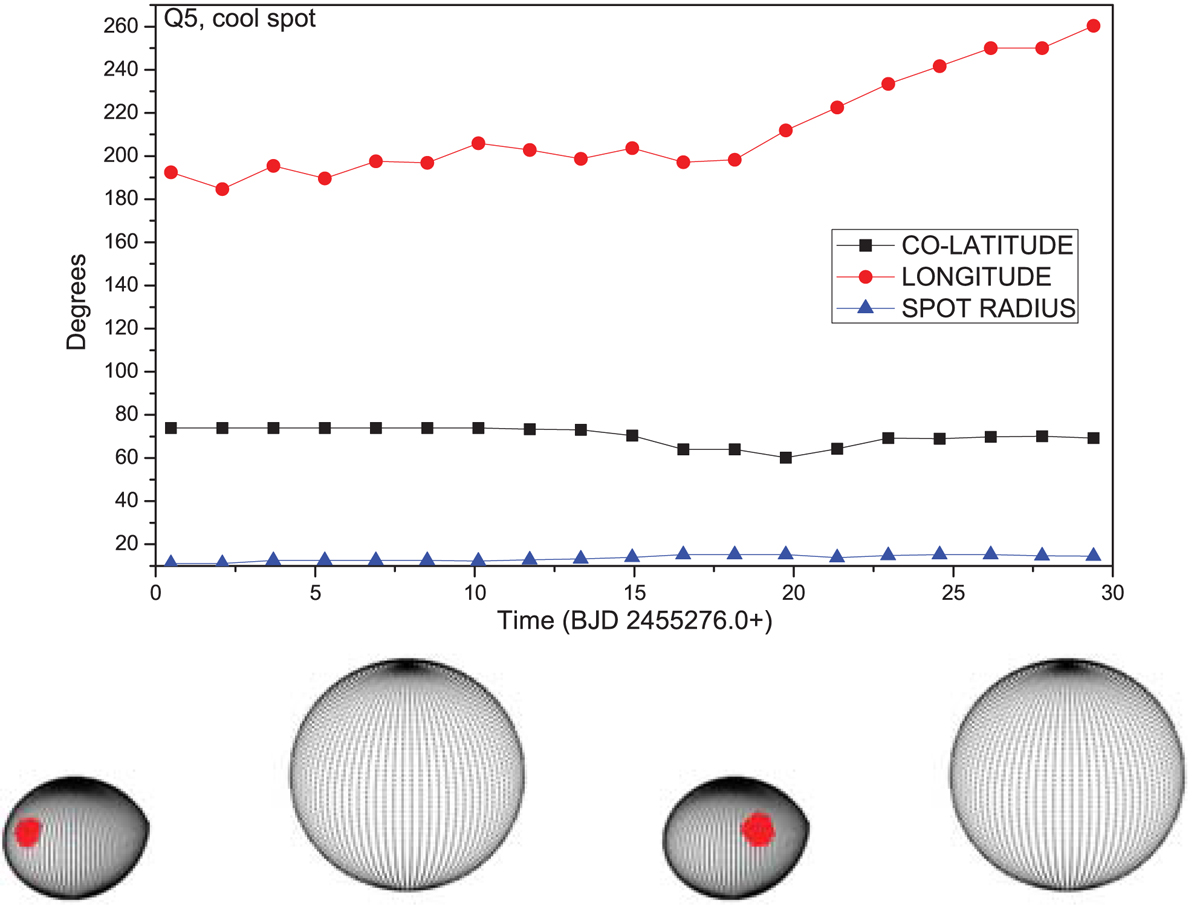
Upper panel: spot migration diagram for KIC 8553788 during Q5. Lower panels: location of the spot (crosses) on the surface of the secondary component during the first day (left) and the last day (right), when the system is at orbital phase 0.85.
Current usage metrics show cumulative count of Article Views (full-text article views including HTML views, PDF and ePub downloads, according to the available data) and Abstracts Views on Vision4Press platform.
Data correspond to usage on the plateform after 2015. The current usage metrics is available 48-96 hours after online publication and is updated daily on week days.
Initial download of the metrics may take a while.