| Issue |
A&A
Volume 615, July 2018
|
|
|---|---|---|
| Article Number | A126 | |
| Number of page(s) | 9 | |
| Section | The Sun | |
| DOI | https://doi.org/10.1051/0004-6361/201732444 | |
| Published online | 26 July 2018 | |
Spectral variation of suprathermal protons associated with stream interaction regions: STEREO A/PLASTIC observations
Institut für Experimentelle und Angewandte Physik (IEAP), Christian-Albrechts-Universität zu Kiel, Leibnizstrasse 11, 24118 Kiel, Germany
e-mail: This email address is being protected from spambots. You need JavaScript enabled to view it.
Received:
10
December
2017
Accepted:
23
March
2018
Abstract
Context. The observation of power-law spectra of suprathermal particles is typically associated with the occurrence of stream interaction regions (SIRs), indicating that these particles are accelerated close to the observer. However, recent observations have identified the existence of sunwards streaming particles at low suprathermal energies following SIRs. In addition, the observational evidence for turnover spectra in the low suprathermal energies has also been presented, suggesting that these particles might be accelerated at remote shocks and travel back to the Sun along the interplanetary magnetic field lines.
Aims. We investigate the spectral evolution and variation of suprathermal protons from SIR to SIR as the observer moves from inside the compression regions of SIRs to the outside undisturbed solar wind regions away from the reverse shocks.
Methods. The spectral analysis in the range from solar wind to suprathermal energies was based on proton data, which are obtained by the Plasma and Suprathermal Ion Composition instrument (PLASTIC) on the Solar Terrestrial Relations Observatory mission (STEREO).
Results. All spectra in the compressed fast wind regions (F′ regions) of twelve SIRs exhibit power-law suprathermal tails. Six of them show clear turnover spectra at velocities below 2500 km s−1 in the undisturbed fast solar wind regions (F regions) following the compression regions, while the remaining six events exhibit continuous power-law spectra. Overall, the spectra at velocities higher than 2500 km s−1 harden in the F regions, consistent with previous observations.
Key words: acceleration of particles / shock waves / Sun: heliosphere / Sun: rotation / solar wind
© ESO 2018
1. Introduction
A stream interaction region (SIR) commonly forms when a stream of fast solar wind runs into a stream of slow solar wind. Due to the high conductivity, the two streams of plasma can not interpenetrate but instead form a compression region around their interface (Gosling et al. 1978). During solar minimum, the fast solar wind originates from solar coronal holes, which are relatively stable. Then SIRs can evolve into a spiral pattern which corotates with the Sun, called corotating interaction regions (CIRs). As two interacting streams of solar wind propagate outwards, the magnetic and plasma pressure continuously increases. The forwards and reverse waves at the leading and trailing edges of the compression region will eventually steepen into forwards and reverse shocks at heliocentric distances greater than about two astronomical units (AU; Hundhausen & Gosling 1976; Smith & Wolfe 1976; Gosling & Pizzo 1999).
The flux enhancements of tens of keV to several MeV nuc−1 energetic particles are often observed to be associated with SIRs (McDonald et al. 1976; Van Hollebeke et al. 1978; Mason et al. 1997, 2008; Reames et al. 1997; Chotoo et al. 2000; Ebert et al. 2012). The long-standing theoretical interpretation for these enhancements is given by Fisk & Lee (1980), who suggest that these energetic particles are accelerated via the diffusive shock acceleration mechanism at the forwards or reverse shock, and then propagate back to the inner heliosphere along the interplanetary magnetic field (IMF). The spectral shape described by the Fisk & Lee (1980) model, a power law multiplied by an exponential component, has been widely observed (Reames et al. 1997; Chotoo et al. 2000; Mason et al. 1997, 2008; Desai et al. 1999). However, the turnover of spectra at low suprathermal energies also predicted by this model has not been observed, until recently, Yu et al. (2016, 2017) and Zhao et al. (2016) reported turnover spectra of helium in the undisturbed fast wind regions following CIRs at around 40 and 100 keV nuc−1 respectively. The observations of Zhao et al. (2016) fit well with their own theoretical model, which is based on the transport equation and calculates the particle differential intensities using a Monte Carlo simulation. Both the Fisk & Lee (1980) model and the Zhao et al. (2016) model assume that particles move only along the IMF and experience no cross-field diffusion. However, three intensive CIR events studied by Dwyer et al. (1997) show that the flow anisotropy of the suprathermal particles at 1 AU is significantly inclined with respect to the local average magnetic field, indicating substantial transport of these particles across the magnetic field. Similar to the diffusive shock acceleration, Giacalone et al. (2002) proposed another mechanism, which considers the nondiffusive magnetic mirroring effect in the region between the compression and the Sun, where trapped ions can be effectively accelerated by scattering between converging scattering centres. Another well-known acceleration mechanism is stochastic acceleration, for example, acceleration through the transit-time damping of magnitude variations of the magnetic field in the CIR compression regions (Schwadron et al. 1996) and the Fisk & Gloeckler (2006, 2007, 2008, 2012a, b, 2014) mechanism, which describes that suprathermal particles are accelerated in the compressive and thermally isolated turbulence, producing a power law in particle speed with a spectral index of –5.
In this work, we have investigated the spectral variation and evolution of H+ during twelve SIRs, all of which show the typical SIR structure and are bounded by a reverse shock. The SIRs were observed by the Solar Terrestrial Relations Observatory Ahead spacecraft (STEREO A). While the term “suprathermal energy” is ill-defined, for this work, we use the term for particles which appreciably exceed the bulk solar wind speed. This is typically around twice the solar wind speed. The phase space density of suprathermal protons during all these events show power-law tails in the downstream regions of the reverse shocks which are the compressed and decelerated fast wind regions (hereafter F′ regions), consistent with previous observations. After the passage of the reverse shocks, spectra of six events evolve to show a clear signature of a turnover at low suprathermal energies in the upstream regions of the reverse shocks which are the undisturbed fast wind regions (hereafter F regions), while the other six events show continuous power-law spectra. Furthermore, we used spectra in the F region normalized by those in the F′ region to study the spectral evolution, assuming power-law spectra at suprathermal velocities in the F′ region. This approach eliminates any effects of the poorly known instrumental efficiency. We found that the above turnover signature is not due to the instrument efficiency. This work therefore verifies that the case study for turnover spectra during CIRs by Yu et al. (2016), Zhao et al. (2016) is not a unique event, but can often be observed.
2. Instrumentation and event selection
Spectral investigations as well as solar wind parameter measurements presented in this paper are based on the Plasma and Suprathermal Ion Composition (PLASTIC) instrument onboard the STEREO A spacecraft. PLASTIC is a time-of-flight mass spectrometer, providing a nominal energy-per-charge coverage from 0.3 to 80 keV e−1 (Galvin et al. 2008). Equipped with a stepped E/q electrostatic analyser, a time-of-flight and solidstate detector system, PLASTIC can determine uniquely the mass, charge, and energy of an incident ion (see details in Galvin et al. 2008). The proton data in the following analysis are collected with the solar wind section (SWS) of PLASTIC, which is centred along the line connecting the Sun and the spacecraft, providing a field of view of 45° in the ecliptic and ±20° in the polar direction towards the Sun. SWS is equipped with two entrance apertures: the main channel and the small channel. During operation, PLASTIC can alternate between these two channels autonomously by monitoring the count rate. This special design allows PLASTIC to measure the bulk solar wind as well as its suprathermal tail with comparable counting statistics, providing us a good opportunity to understand how the source particles inject into the acceleration process and form the suprathermal tail. The measurements of the IMF were performed by the Magnetometer (MAG) of the In-situ Measurements of Particles and CME Transients (IMPACT) suite (Luhmann et al. 2008), which is also onboard the STEREO spacecraft (Kaiser et al. 2008).
All these events in Table 1 are bounded by reverse shocks and exhibit the typical structure of SIRs, as the example shown in Fig. 1. The boundaries between four regions of SIR 1 (S, S′, F′, and F) are determined with the variations of the specific entropy (Burlaga et al. 1990; Siscoe & Intriligator 1993; Burton et al. 1999; Pagel et al. 2004) and the total pressure (Jian et al. 2006). More specifically, the stream interface is clearly indicated with an abrupt increase in the specific entropy (Burlaga et al. 1990; Siscoe & Intriligator 1993; Burton et al. 1999; Pagel et al. 2004), see the middle vertical dashed line in Fig. 1. We notice that the proton density suddenly decreases as both the bulk and thermal wind speed apparently increase at the interface of SIR 1. These variations of proton density, bulk and thermal velocity also used to be considered as a marker of the stream interface (Burlaga et al. 1990; Siscoe & Intriligator 1993; Burton et al. 1999; Pagel et al. 2004). The boundaries of the SIR compression region, the leading and trailing edges, are determined by the total pressure P (Jian et al. 2006), which is the sum of the plasma and magnetic field pressure. The blue horizontal dashed line in Fig. 1 indicates the 50 pPa threshold suggested by Bučík et al. (2009). Regions above this line can be considered as compressed ones. The mean charge state of iron is used for the event selection to check a possible effect on SIRs from interplanetary coronal mass ejection (ICME) during which the charge state of iron often increases from ~10+ to ~15+ (Lepri et al. 2001; Lepri & Zurbuchen 2004). The temporal variations of the proton flux in the range of 10–80 keV are shown in the lowest panel of Fig. 1. We clearly see that the count rate of suprathermal protons peaks inside the F′ region, close to the reverse shock, and persists within the leading parts of the fast wind region. This kind of time profile of suprathermal particles was also observed in many other SIR events (Mason et al. 1997; Reames et al. 1997; Chotoo et al. 2000; Bučík et al. 2009; Ebert et al. 2012; Yu et al. 2016, 2017).
Stream interaction regions at STEREO/A.
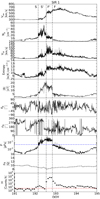 |
Fig. 1. Time profile of SIR 1 identified by PLASTIC and MAG during the period from DOY 191 to DOY 195, 2007. From top to bottom: 1-min averaged bulk speed of solar wind (Vsw), proton density (Np), thermal speed (Vth), specific entropy (derived with Np and Vth), IMF magnitude, IMF polar angle, IMF azimuth angle, total pressure (P derived from |
In this work, we have used pulse height analysis (PHA) data of PLASTIC which provide the most detailed information for each incident ion (Galvin et al. 2008; Drews 2013). The proton data are extracted from a square shape of region on the mass vs. mass-per-charge plot (like Fig. 1 of Yu et al. 2017). The corresponding proton area on the plot of electrostatic analyser channel (ESA) vs. time-of-flight channel (TOF) is indicated with two black dashed lines in Fig. 2. It shows a colour coded intensity map of the number of ions measured at a given ESA step (Y axis) and TOF value (X axis). The blue “counts” are measured by the small channel, the red ones by the main channel. The blue “cloud” around ESA step ~75 and 100 < TOF < 160 is due to solar wind bulk protons. The blue cloud at ESA channel ~60 and 160 < TOF < 240 is due to solar wind bulk He2+ ions. The red clouds are due to He2+ and heavy ions. As shown in this figure, the small channel mainly measure the protons and alpha particles at the solar wind bulk energies while the main channel mostly records heavy ions (bulk as well as suprathermal part) and suprathermal protons. The measurements of the small and the main channel have an overlap at TOF channels between 150 and 250 and ESA channels between 52 and 74, as can be seen by the “blue” He2+. The measurement of the solar wind bulk protons is used as an illustration in this work only. While not all protons fell in this band, we find that we get the best signal to noise with it. The incomplete coverage is compensated by considering it in the instrumental efficiency. For this work, we used mainly the “red” proton counts which correspond to suprathermal protons as can be seen by the Y axis on the right. In addition, we find that the proton data between ~45 and ~60 ESA channels has a contribution from heavy ions, He2+. However, the contamination of alpha particles does not affect our study of suprathermals at velocities higher than 1400 km s−1. Due to the limited telemetry of PLASTIC, only a sample of PHA events can be transmitted to Earth. Thus, in Fig. 2 we have applied a so-called base rate weighting defined by Drews (2013) to the transmitted PHA data. The proton area defined in this work includes as many suprathermals as possible for good counting statistics, meanwhile, excludes the contamination of alpha particles and instrument background as much as we can.
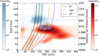 |
Fig. 2. PLASTIC PHA data measured with the Solar Wind Section accumulated during the three time intervals (the blue, green and cyan coloured regions in Fig. 3) in the F region of SIR 2. All the PHA events are weighted by the base rate (Drews 2013) and shown with blue and red colour for the small (CountsS ) and the main channel (CountsM) respectively. Measurements of the two channels overlap at around the TOF channels from 150 to 250 and the ESA channels from 52 to 74. The expected positions for H+, He2+, and O6+ are shown with green, yellow and magenta dashed lines. The proton data extracted for this work is indicated with two black dashed lines while the corresponding proton velocities are given at the right Y axis. |
The criterion of our data selection for this work is: (a) the SIR events exhibit typical structure, for example, well-formed compression regions and clear stream interfaces without ICME influences; (b) the suprathermal proton count rate in the F region exceeds five per hour (the red dashed line in Fig. 1) for at least half a day in order to provide sufficient counting statistics for our spectral analysis; (c) each SIR is bounded by a reverse shock; (d) no contamination of alpha particles at velocities higher than 1400 km s−1. According to the comprehensive statistical survey of SIRs at 1 AU by Jian et al. (2006), the occurrence rate of shocks at SIRs is roughly 24%. Only around 30% of their selected SIRs with shocks have reverse shocks. Our selection criterion is therefore strict, and rejects most SIR events. The reason for that is the instrumental detection efficiency has not been well identified so far. Therefore, we need to choose a reference, power-low spectra in the compression region of SIRs, for our spectral study in the undisturbed fast wind regions associated with SIRs. Given that power-law spectra are often observed in association with interplanetary shocks (McDonald et al. 1976, Van Hollebeke et al. 1978; Reames et al. 1997; Chotoo et al. 2000; Mason et al. 1997, 2008; Desai et al. 1999), we only choose the SIRs bounded with reverse shocks for this work.
3. Observations
Figures 3 and 4 display the SIR events listed in Table 1. Each subfigure contains three panels with the corresponding event number in the upper right corner, showing the measurements of the bulk speed of the solar wind, the specific entropy and four H+ spectra. The stream interface is indicated with the black dashed line in each plot. The vertical red region in the upper two panels of each event denotes a two-hour time interval immediately downstream of the reverse shock, that is, two hours before the passage of the shock. The other three coloured regions (blue, green, and cyan) represent three time intervals upstream of the reverse shock. The reverse shock (RS) is right between the red and the blue regions and is indicated by a black triangle. The durations of three time intervals in the F regions are not the same for all SIRs. Because the count rate of suprathermal protons decreases with time after the spacecraft crosses the reverse shock (as Fig. 1 shows), we use larger and larger time intervals in the undisturbed fast wind region, in order to obtain comparable counting statistics. The lowest panel of each subfigure presents the measurements of phase space density for protons, plotted as a function of υion, where υion is the ion speed in the spacecraft frame. Four spectra are marked with the colours corresponding to the four coloured time intervals in the upper two panels. We aim to illustrate the spectral variation and evolution from the downstream to upstream of the reverse shock. The phase space density of H+ is shown in arbitrary units. We used the same correction to convert from counts to phase space density for all panels in Figs. 2 and 3. We did not correct for instrumental detection efficiency which decreases on time scales of years. This means that the spectra in each panel can be compared with each other. However, the absolute values should not be compared among different SIRs. In addition, at velocities roughly between the solar wind and the suprathermal tail, large variations and deviations can be seen. These are due to the contribution of He2+ and the base rate weighting for the measurements obtained around the channel switch between of the two entrance apertures of PLASTIC’s SWS, respectively.
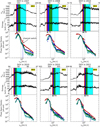 |
Fig. 3. Spectral evolution of INDIVIDUAL SIR events. Spectral evolution of each SIR event is given from the downstream to upstream of the reverse shock, with the event number in the upper right corner. In each plot, a vertical black dashed line indicates the stream interface while two vertical dotted lines show a range where the channel switch happened during this event. The time interval marked with red colour denotes the downstream, followed by three time intervals with blue, green, and cyan colours inside the upstream region. Four spectra are shown with the same colours as their corresponding time intervals. |
Throughout all the SIR events in Figs. 3 and 4, we find some common features. First of all, at the location of the reverse shock a jump of the solar wind velocity is apparent. At the stream interfaces of SIRs, which are marked with black dashed lines, the specific entropy clearly shows an abrupt increase from below 10 to ~12 [ln(K cm−3/2)]. The values of the specific entropy remain stable through the F′ and the F regions, except for SIRs 5, 7, 9, and 11, in which the entropy exhibits a slight decrease at the shock, but is still higher than that prior to the stream interface. For the spectra downstream of the reverse shocks, we always select data in the two hours just before the shock. Given that all the dashed lines lie to the left of the red bars, we can be assured that all the spectra in the F′ regions of this work are purely of fast wind origin. More common characteristics can be found in the spectral measurements. In the solar wind energies, PLASTIC observed a Maxwellian distribution of spectra in all SIR events. At suprathermal energies, we clearly see that all the SIR events exhibit power-law tails in the F′ regions, when the ion speed is higher than around 1500 km s−1. Only the spectrum of SIR 8 has a possible rollover at higher velocities (υion > 2500 km s−1). The power-law tails presented here are consistent with the classic theoretical models (Fisk & Lee 1980; Jones & Ellison 1991) and previous observations (Mason et al. 1997, 2004, 2008; Desai et al. 1999; Reames et al. 1997; Chotoo et al. 2000).
The focus of this study is to investigate spectral variations of suprathermal tails in the F regions, which differ from SIR to SIR. Spectra of SIRs 1 and 4 show good counting statistics and contain continuous power-law suprathermal tails in the F regions.
In comparison, spectral measurements of SIRs 5, 6, 9, and 10 show large errorbars in some υion channels (particularly in high υion channels), which indicates that only few counts were recorded. Although all the spectra of these four SIRs look like power-law shapes at suprathermal velocities, this could be due to statistical effects. Because if all the υion channels have one count, the index of spectra will be fixed at –4 (Ipavich 1974). Very interesting shapes of suprathermal tails can be seen in SIRs 2, 3, 7, 8, 11, and 12. Three spectra of SIR 2 in the F region exhibit apparent turnovers in the low suprathermal range, around 1500 to 2500 km s−1. The PHA data during these three time intervals in the F region of SIR 2 are also shown in Fig. 2 where we clearly see that the turnovers are neither affected by the channel switch nor the contamination of He2+. The same spectral variations are visible in SIRs 7 and 8, although less clearly for the first time period in the F region. SIR 3 shows a power-law tail during the first two hours after passing the reverse shock, however, the turnover shapes at low suprathermal velocities again show up during the two following periods. In SIR 11, two and six hours averaged spectra after the reverse shock show almost the same power law index, while the six-hour averaged spectrum lies slightly lower than the two-hour averaged one. However, in the third stage of the F region, the low suprathermal part of the spectrum eventually evolves into a turnover below roughly 2000 km s−1. In the case of SIR 12, spectra behave very similarly to those of SIR 11.
In summary, in the F′ regions of twelve SIRs we have found that power-law shapes of spectra are a common feature. However, the spectra in the F regions do not always have a powerlaw shape. A spectral turnover in the low suprathermal velocity range (<2500 km s−1) exists in six events.
4. Discussion
Power-law suprathermal tails are often found to be associated with interplanetary shocks, independent of whether the shocks are driven by solar flares (Mazur et al. 1992), coronal mass ejections (CMEs; Mewaldt et al. 2005; Tylka & Lee 2006), or CIRs (Mason et al. 1997, 2008; Reames et al. 1997; Desai et al. 1999; Chotoo et al. 2000; Yu et al. 2016, 2017). These power-law tails are typically believed to be the result of diffusive shock acceleration or first-order Fermi acceleration (Fermi 1949). In addition, a break or rollover of spectra at a few to a few tens of MeV nuc−1 is always observed (Li et al. 2009). Because the energy coverage of PLASTIC is far below the range of the spectral break or rollover, we only measure the power-law part of suprathermal spectra in this work. For the CIR study, Reames et al. (1997) have found that the spectra in the F region of a CIR event in May of 1995 harden with time in the energy range from 40 keV nuc−1 to around 1 MeV nuc−1. The hardening spectra of suprathermal helium with time were also recently observed in the energy range of 0.137–0.193 MeV nuc−1 by Ebert et al. (2012). With the data from the Wind spacecraft at around 1 AU, Ebert et al. (2012) have identified anti-sunwards flows of suprathermal helium in the compression downstream of a CIR-driven reverse shock, which transitioned to sunwards flows after passing the shock. These observations suggest that the shock is a local source for suprathermal particles in CIR events, which lie inside 1 AU prior to the shock arrival and beyond 1 AU after its passage.
The phase space density of suprathermal protons f (υion) in this work is derived as (1)
(1)
where C(υion) is the measured counts, VP(υion) is the differential volume in velocity space, VS (υion) is the differential volume in position space, and η(υion) is the instrument efficiency, referring to Drews (2013). Except for (ηion), all the other items can be derived with PLASTIC’s measurements. For the power-law tails at velocities higher than 2500 km s−1 shown in Figs. 3 and 4, it is difficulty to determine the absolute values of their spectral indices due to the poorly known instrument efficiency, η(υion), which is a function of υion. In order to eliminate the effect of instrumental efficiency on the spectral shape, we only focus on the variations of the relative ratios of the phase space density from the F region to the F′ region, that is, we discuss only the three normalized spectra in the F region (with the spectrum measured in the F′ region) for each SIR event. Based on the obvervations discussed above, we would expect to see a power-law spectrum in the F′ regions with a spectral index γdown. The phase space density, fdown(υion), in F′ can then be written as (2)
(2)
where  is the uncorrected phase space density in the F′ region as shown in Figs. 3 and 4. Similarly, if the spectra in the F region upstream of the shock are also power-law shapes,
 (3)
(3)
where γup is the spectral index in the F region and  is uncorrected fup(υion). Then the ratio of the phase space densities in the F to the F′ region should also exhibit the power-law shape with the index κ = γup − γdown. The instrumental efficiency (ηion) cancels out in this normalization process,
 (4)
(4)
Figure 5 shows the fitting results of three normalized spectra of each SIR event in the F regions at υion > 2500 km s−1. The maximum likelihood estimations (Mattox et al. 1996) of κ are shown with squares and triangles in the upper and lower panels respectively. Events in the upper panel are those showing continuous power-law tails in the F regions, while events in the lower panel evolve into a spectral turnover at υion < 2500 km s−1. The errorbars are estimated by adding Poisson noise to the measured data. In the F regions of the upper panel we observed decreasing κ with time in SIRs 1, 4, 6, and 9 except for those of SIRs 5 and 10. With κ = γup − γdown decreasing with time, we see that γup must decrease with time or increasing distance from the reverse shock because γdown is fixed in the F′ region. This indicates a hardening of the spectrum as the observer moves away from the reverse shock, which is consistent with previous observations (Reames et al. 1997; Ebert et al. 2012). SIR 5 exhibits slightly harder suprathermal tail in the second time interval than that in the first and third intervals of the F regions. SIR 10 has a softer spectrum in the second time interval compared with that in the other two periods. However, considering the error estimation of SIR 10, the spectra might also continuously harden with time. Similar results can also be seen in the lower panel, where SIRs 2, 3, 7, and 12 exhibit hardening spectra. Especially the counting statistics of SIRs 2 and 7 are good enough to show this behaviour. The index variation of SIR 8 is similar to that of SIR 5, while the case in SIR 11 is similar to that in SIR 10. In short, we observe a overall trend (eight in twelve SIRs) of the spectral hardening in the F regions. This trend is consistent with previous observations of Reames et al. (1997), Ebert et al. (2012) with Wind data and extends their work to a lower velocity range down to 2500 km s−1. The hardening spectra as we move away from the shock is probably indicative of the increasing importance of transport effects as the shock is rotated further away from the observer. Compared with high-energy suprathermal particles, low-energy suprathermal particles suffer from more scattering on the sunwards propogating path before they reach the observer at 1 AU. In addition, the hardening spectra in the F regions can be due to the strengthening reverse shock with helioscentric distance according to the (Fisk & Lee 1980) model.
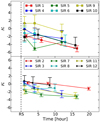 |
Fig. 5. Temporal variations of κ of normalized spectra in the F regions at velocities higher than 2500 km s−1. The upper panel shows the SIR events that exhibit continuous power laws in both F and F′ regions in Figs. 3 and 4, while the other events with turnover spectra at velocities lower than 2500 km s−1 are given in the lower panel. |
In Fig. 6, we show two normalized spectra as examples. In order to guide the eyes, we extrapolate the power laws down to 1500 km s−1. We can clearly see that all the normalized spectra of SIR 1 in Fig. 6 have positive exponents, which means harder spectra in the F regions compared with those in the F′ regions. The low-velocity parts (υion < 2500 km s−1) of the spectra during the first and second period of SIR 1 are around or slightly below the extended lines. But the overall shapes are more like power laws. The spectrum in the third time interval of SIR 1 lies around the dashed power-law line at υion > 2000 km s−1. At lower velocities, the relative ratios lie above the expected powerlaw line, which could be the effect of the solar wind bulk (see Fig. 3). There are more suprathermal particles in the downstream regions, F′, than in the upstream regions. Therefore, suprathermals impinge more into the bulk solar wind velocity range in F′ than in F. Thus the ratio of the two at low speeds is most affected by the bulk solar wind in those F regions where the flux of suprathermals is lowest. In comparison, the three spectra of SIR 2 have a common characteristic. Below 2500 km s−1, spectra start to turnover towards low velocities, which indicates that the spectra of this event in the F region are not purely of power laws shapes. Similar turnover shapes are also found in SIRs 3, 7, 8, 11, and 12, all of which have already shown the low-velocity turnover in the uncorrected phase space density (see Figs. 3 and 4). Although not all the spectra of SIRs 3, 7, 8, 11, and 12 in the F regions exhibit a turnover like those of SIR 2, they all finally evolve into shapes with turnover. For the other six SIR events, we do not find any hint of turnover spectra. But the turnover feature may be hidden due to the low counting statistics, for example, in SIRs 5, 6, 9, and 10. We note that all the turnover parts of the spectra occur at higher velocities than those affected by the channel switch and He2+. Therefore, we have verified that turnover spectra in the F regions are not an instrumental effect, but due to a real physical process.
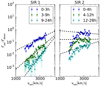 |
Fig. 6. Ratio of phase space density, |

5. Conclusions
In this paper, we investigate the spectral variation and evolution at very low energies, just above the solar wind during twelve SIR events, which are all bounded by reverse shocks. Two important spectral characters have been identified. The suprathermal tails have an overall tendency to harden with time in the F regions, consistent with previous observations. The superior counting rates resulting from PLASTIC’s large geometry factor have allowed us to fully cover the solar velocity distribution functions in SIRs from the solar wind bulk all the way up to strongly suprathermal velocities exceeding several multiples of the solar wind speed. This includes the velocity range where the transition from bulk to suprathermal (in the sense of nonthermal) takes place. This observation provides further evidence that protons at 1 AU can be accelerated to suprathermal velocities at the SIR-driven reverse shocks. The hardening spectra can be explained by two processes. On one hand, the reverse shock gets stronger as it moves out into the heliosphere. This should result in harder spectra. On the other hand, the observer is magnetically linked to the shock which is moving futher away from him. Therefore transport effects will become increasingly important. One would expect particles with the lowest energy to be most affected. The second observation is that the suprathermal tails are not always power laws in the F regions of SIRs, but half of the events exhibit turnover shapes at low suprathermal velocities. However, in contrast with combined observation from two spacecraft of Yu et al. (2016, 2017), PLASTIC can uniquely provide measurements for the spectral turnover together with much better counting statistics. The origin of the spectral turnover is still unknown. Although the theoretical model by Fisk & Lee (1980) predicts a spectral turnover in the F region, this model is only valid at high energies, where the particle velocity is much higher than the bulk speed of solar wind. Finally, we also point out that the SWS field of view is always towards the Sun, which means it can not directly view the particles scattered back towards the Sun by reverse shocks in the F regions but only those mirrored inside 1 AU to reach it.
Acknowledgments
LB and RFWS acknowledge support by grants 50OC1103 and 50OC1501 from the German Space Agency (DLR). RFWS thanks ISSI for its hospitality and its teams “Exploration of the inner heliosphere” and “Radiation interactions at planetary bodies”. JY thanks DAAD for financial support.
References
- Burlaga, L. F., Mish, W. H., & Whang, Y. C. 1990, J. Geophys. Res., 95, 4247 [NASA ADS] [CrossRef] [Google Scholar]
- Burton, M. E., Neugebauer, M., Crooker, N. U., von Steiger, R., & Smith, E. J. 1999, J. Geophys. Res., 104, 9925 [NASA ADS] [CrossRef] [Google Scholar]
- Bučík, R., Mall, U., Korth, A., & Mason, G. M. 2009, Ann. Geophys., 27, 3677 [NASA ADS] [CrossRef] [Google Scholar]
- Chotoo, K., Schwadron, N. A., Mason, G. M., et al. 2000, J. Geophys. Res., 105, 23107 [NASA ADS] [CrossRef] [Google Scholar]
- Desai, M. I., Marsden, R. G., Sanderson, T. R., et al. 1999, J. Geophys. Res., 104, 6705 [NASA ADS] [CrossRef] [Google Scholar]
- Drews, C. 2013, PhD Thesis, Christian-Albrechts-Universitaet zu Kiel, Germany [Google Scholar]
- Dwyer, J. R., Mason, G. M., Mazur, J. E., et al. 1997, ApJ, 490, L115 [Google Scholar]
- Ebert, R. W., Dayeh, M. A., Desai, M. I., & Mason, G. M. 2012, ApJ, 749, 73 [NASA ADS] [CrossRef] [Google Scholar]
- Fermi, E. 1949, Phys. Rev., 75, 1169 [NASA ADS] [CrossRef] [Google Scholar]
- Fisk, L. A., & Gloeckler, G. 2006, ApJ, 640, L79 [NASA ADS] [CrossRef] [Google Scholar]
- Fisk, L. A., & Gloeckler, G. 2007, Space Sci. Rev., 130, 153 [Google Scholar]
- Fisk, L. A., & Gloeckler, G. 2008, ApJ, 686, 1466 [NASA ADS] [CrossRef] [Google Scholar]
- Fisk, L. A., & Gloeckler, G. 2012a, AIP Conf. Ser., 1436, 116 [NASA ADS] [Google Scholar]
- Fisk, L. A., & Gloeckler, G. 2012b, Space Sci. Rev., 173, 433 [NASA ADS] [CrossRef] [Google Scholar]
- Fisk, L. A., & Gloeckler, G. 2014, J. Geophys. Res. (Space Physics), 119, 8733 [NASA ADS] [CrossRef] [Google Scholar]
- Fisk, L. A., & Lee, M. A. 1980, ApJ, 237, 620 [Google Scholar]
- Galvin, A. B., Kistler, L. M., Popecki, M. A., et al. 2008, Space Sci. Rev., 136, 437 [NASA ADS] [CrossRef] [Google Scholar]
- Giacalone, J., Jokipii, J. R., & Kóta, J. 2002, ApJ, 573, 845 [NASA ADS] [CrossRef] [Google Scholar]
- Gosling, J. T., & Pizzo, V. J. 1999, Space Sci. Rev., 89, 21 [Google Scholar]
- Gosling, J. T., Asbridge, J. R., Bame, S. J., & Feldman, W. C. 1978, J. Geophys. Res., 83, 1401 [NASA ADS] [CrossRef] [Google Scholar]
- Hundhausen, A. J., & Gosling, J. T. 1976, J. Geophys. Res., 81, 1436 [NASA ADS] [CrossRef] [Google Scholar]
- Ipavich, F. M. 1974, Geophys. Res. Lett., 1, 149 [NASA ADS] [CrossRef] [Google Scholar]
- Jian, L., Russell, C. T., Luhmann, J. G., & Skoug, R. M. 2006, Sol. Phys., 239, 337 [NASA ADS] [CrossRef] [Google Scholar]
- Jones, F. C., & Ellison, D. C. 1991, Space Sci. Rev., 58, 259 [NASA ADS] [CrossRef] [Google Scholar]
- Kaiser, M. L., Kucera, T. A., Davila, J. M., et al. 2008, Space Sci. Rev., 136, 5 [NASA ADS] [CrossRef] [Google Scholar]
- Lepri, S. T., & Zurbuchen, T. H. 2004, J. Geophys. Res. (Space Physics), 109, A01112 [NASA ADS] [Google Scholar]
- Lepri, S. T., Zurbuchen, T. H., Fisk, L. A., et al. 2001, J. Geophys. Res., 106, 29231 [NASA ADS] [CrossRef] [Google Scholar]
- Li, G., Zank, G. P., Verkhoglyadova, O., et al. 2009, ApJ, 702, 998 [NASA ADS] [CrossRef] [Google Scholar]
- Luhmann, J. G., Curtis, D. W., Schroeder, P., et al. 2008, Space Sci. Rev., 136, 117 [NASA ADS] [CrossRef] [Google Scholar]
- Mason, G. M., Mazur, J. E., Dwyer, J. R., Reames, D. V., & von Rosenvinge T. T. 1997, ApJ, 486, L149 [NASA ADS] [CrossRef] [Google Scholar]
- Mason, G. M., Mazur, J. E., Dwyer, J. R., et al. 2004, ApJ, 606, 555 [NASA ADS] [CrossRef] [Google Scholar]
- Mason, G. M., Leske, R. A., Desai, M. I., et al. 2008, ApJ, 678, 1458 [NASA ADS] [CrossRef] [Google Scholar]
- Mattox, J. R., Bertsch, D. L., Chiang, J., et al. 1996, ApJ, 461, 396 [NASA ADS] [CrossRef] [Google Scholar]
- Mazur, J. E., Mason, G. M., Klecker, B., & McGuire, R. E. 1992, ApJ, 401, 398 [NASA ADS] [CrossRef] [Google Scholar]
- McDonald, F. B., Teegarden, B. J., Trainor, J. H., von Rosenvinge, T. T., & Webber, W. R. 1976, ApJ, 203, L149 [NASA ADS] [CrossRef] [Google Scholar]
- Mewaldt, R. A., Cohen, C. M. S., Labrador, A. W., et al. 2005, J. Geophys. Res. (Space Physics), 110, A09S18 [Google Scholar]
- Pagel, A. C., Crooker, N. U., Zurbuchen, T. H., & Gosling, J. T. 2004, J. Geophys. Res. (Space Physics), 109, A01113 [NASA ADS] [CrossRef] [Google Scholar]
- Reames, D. V., Ng, C. K., Mason, G. M., et al. 1997, Geophys. Res. Lett., 24, 2917 [NASA ADS] [CrossRef] [Google Scholar]
- Richardson, I. G., Barbier, L. M., Reames, D. V., & von Rosenvinge T. T. 1993, J. Geophys. Res., 98, 13 [NASA ADS] [CrossRef] [Google Scholar]
- Schwadron, N. A., Fisk, L. A., & Gloeckler, G. 1996, Geophys. Res. Lett., 23, 2871 [NASA ADS] [CrossRef] [Google Scholar]
- Siscoe, G., & Intriligator, D. 1993, Geophys. Res. Lett., 20, 2267 [NASA ADS] [CrossRef] [Google Scholar]
- Smith, E. J., & Wolfe, J. H. 1976, Geophys. Res. Lett., 3, 137 [NASA ADS] [CrossRef] [Google Scholar]
- Tylka, A. J., & Lee, M. A. 2006, ApJ, 646, 1319 [NASA ADS] [CrossRef] [Google Scholar]
- Van Hollebeke, M. A. I., McDonald, F. B., Trainor, J. H., & von Rosenvinge T. T. 1978, J. Geophys. Res., 83, 4723 [NASA ADS] [CrossRef] [Google Scholar]
- Yu, J., Berger, L., Wimmer-Schweingruber, R. F., et al. 2016, AIP Conf. Proc., 1720 [Google Scholar]
- Yu, J., Berger, L., Wimmer-Schweingruber, R., et al. 2017, A&A, 599, A13 [NASA ADS] [CrossRef] [EDP Sciences] [Google Scholar]
- Zhao, L., Li, G., Ebert, R. W., et al. 2016, J. Geophys. Res. (Space Physics), 121, 77 [NASA ADS] [CrossRef] [Google Scholar]
All Tables
All Figures
|
Fig. 1. Time profile of SIR 1 identified by PLASTIC and MAG during the period from DOY 191 to DOY 195, 2007. From top to bottom: 1-min averaged bulk speed of solar wind (Vsw), proton density (Np), thermal speed (Vth), specific entropy (derived with Np and Vth), IMF magnitude, IMF polar angle, IMF azimuth angle, total pressure (P derived from |
| In the text | |
|
Fig. 2. PLASTIC PHA data measured with the Solar Wind Section accumulated during the three time intervals (the blue, green and cyan coloured regions in Fig. 3) in the F region of SIR 2. All the PHA events are weighted by the base rate (Drews 2013) and shown with blue and red colour for the small (CountsS ) and the main channel (CountsM) respectively. Measurements of the two channels overlap at around the TOF channels from 150 to 250 and the ESA channels from 52 to 74. The expected positions for H+, He2+, and O6+ are shown with green, yellow and magenta dashed lines. The proton data extracted for this work is indicated with two black dashed lines while the corresponding proton velocities are given at the right Y axis. |
| In the text | |
|
Fig. 3. Spectral evolution of INDIVIDUAL SIR events. Spectral evolution of each SIR event is given from the downstream to upstream of the reverse shock, with the event number in the upper right corner. In each plot, a vertical black dashed line indicates the stream interface while two vertical dotted lines show a range where the channel switch happened during this event. The time interval marked with red colour denotes the downstream, followed by three time intervals with blue, green, and cyan colours inside the upstream region. Four spectra are shown with the same colours as their corresponding time intervals. |
| In the text | |
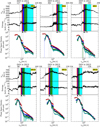 |
Fig. 4. Spectral evolution of further SIR events. Same format as Fig. 3. |
| In the text | |
|
Fig. 5. Temporal variations of κ of normalized spectra in the F regions at velocities higher than 2500 km s−1. The upper panel shows the SIR events that exhibit continuous power laws in both F and F′ regions in Figs. 3 and 4, while the other events with turnover spectra at velocities lower than 2500 km s−1 are given in the lower panel. |
| In the text | |
|
Fig. 6. Ratio of phase space density, |
| In the text | |
Current usage metrics show cumulative count of Article Views (full-text article views including HTML views, PDF and ePub downloads, according to the available data) and Abstracts Views on Vision4Press platform.
Data correspond to usage on the plateform after 2015. The current usage metrics is available 48-96 hours after online publication and is updated daily on week days.
Initial download of the metrics may take a while.