Fig. 1.
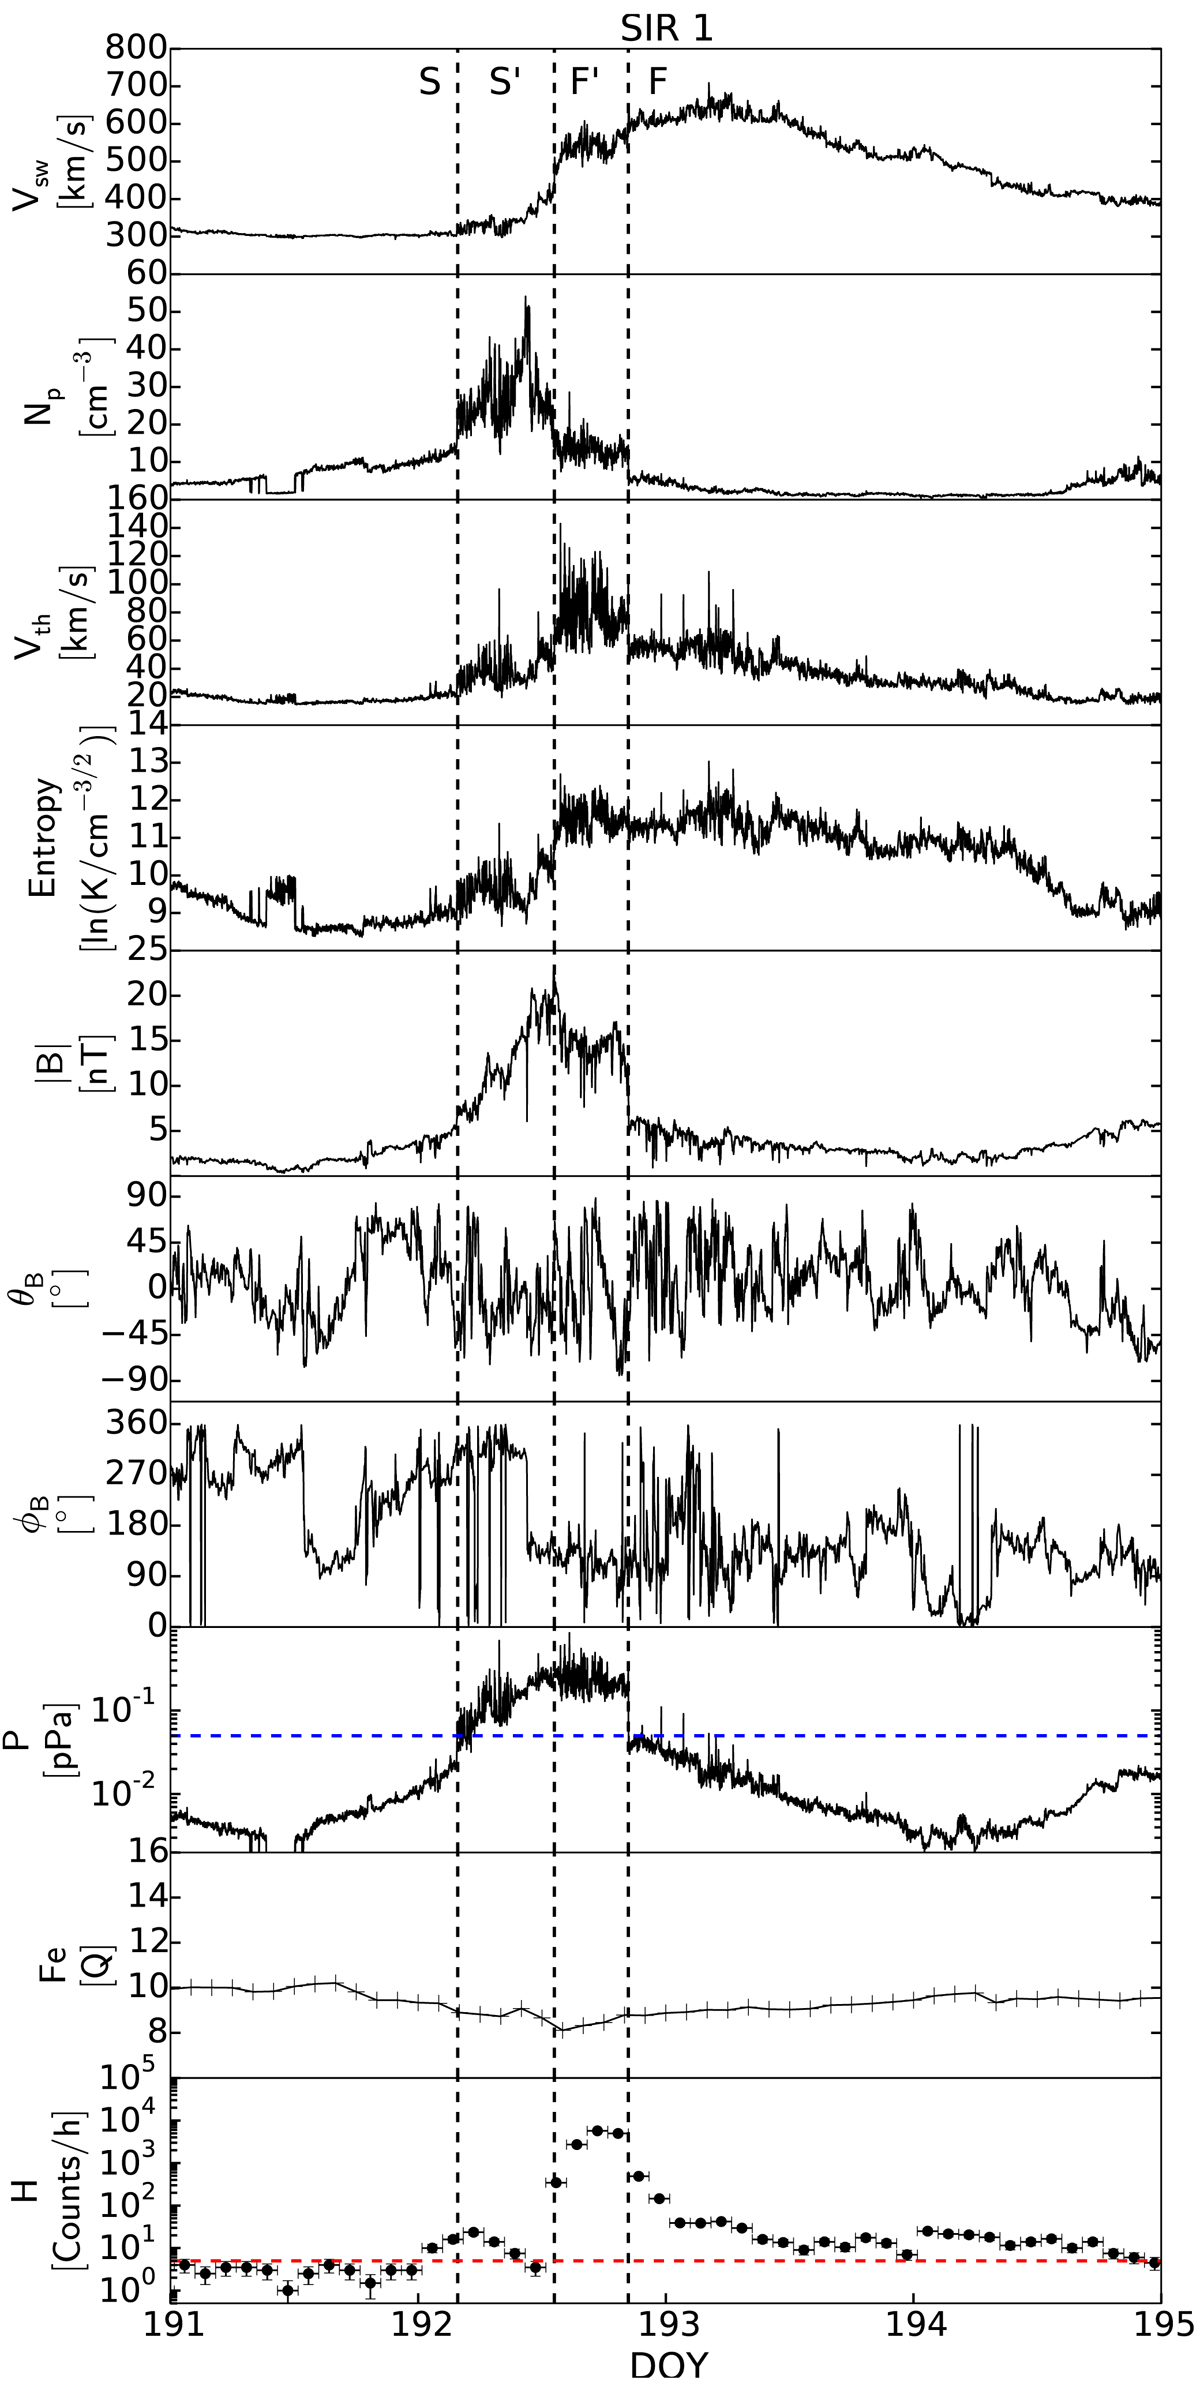
Time profile of SIR 1 identified by PLASTIC and MAG during the period from DOY 191 to DOY 195, 2007. From top to bottom: 1-min averaged bulk speed of solar wind (Vsw), proton density (Np), thermal speed (Vth), specific entropy (derived with Np and Vth), IMF magnitude, IMF polar angle, IMF azimuth angle, total pressure (P derived from ![]() ), two-hour mean charge state of iron, and count rate of suprathermal protons in the energy range of 10–80 keV. From left to right, we indicate the slow wind, compressed and accelerated slow wind, compressed and decelerated fast wind, and fast wind regions with S, S′, F′, and F respectively, following Richardson et al. (1993), Chotoo et al. (2000). Three vertical black dashed lines indicate the boundaries between these four regions of SIR 1. The horizontal blue and red dashed lines denote 50 pPa and five counts/hour respectively, and are used as thresholds in this work.
), two-hour mean charge state of iron, and count rate of suprathermal protons in the energy range of 10–80 keV. From left to right, we indicate the slow wind, compressed and accelerated slow wind, compressed and decelerated fast wind, and fast wind regions with S, S′, F′, and F respectively, following Richardson et al. (1993), Chotoo et al. (2000). Three vertical black dashed lines indicate the boundaries between these four regions of SIR 1. The horizontal blue and red dashed lines denote 50 pPa and five counts/hour respectively, and are used as thresholds in this work.
Current usage metrics show cumulative count of Article Views (full-text article views including HTML views, PDF and ePub downloads, according to the available data) and Abstracts Views on Vision4Press platform.
Data correspond to usage on the plateform after 2015. The current usage metrics is available 48-96 hours after online publication and is updated daily on week days.
Initial download of the metrics may take a while.