Fig. 2.
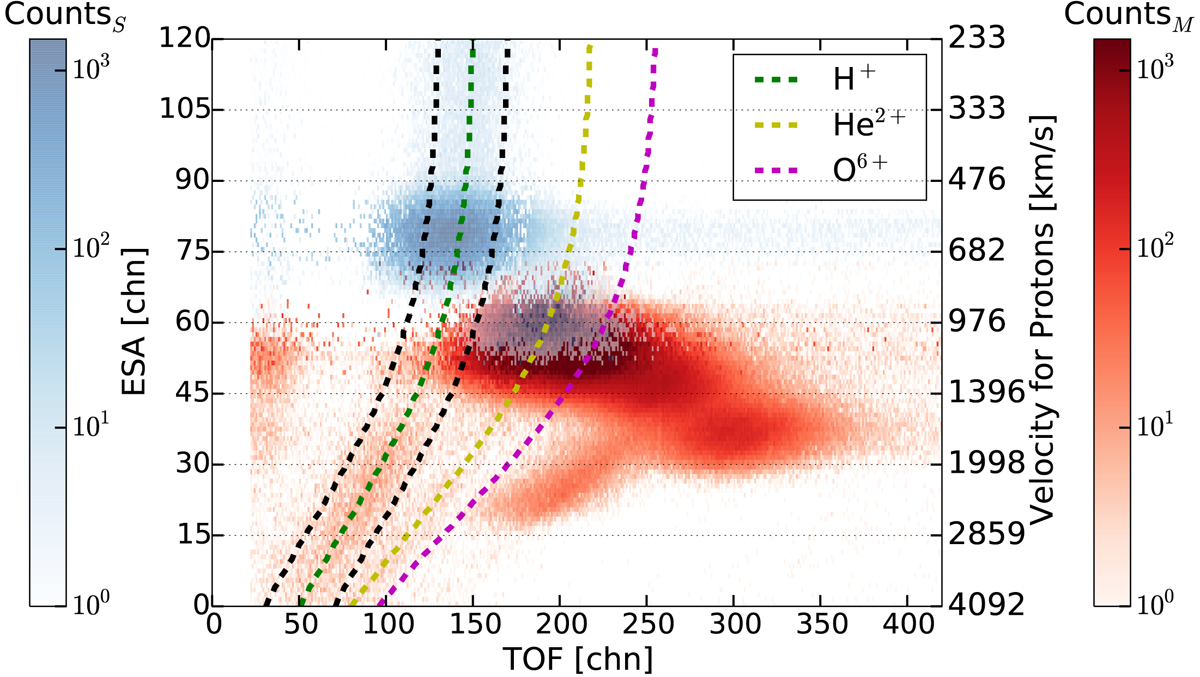
PLASTIC PHA data measured with the Solar Wind Section accumulated during the three time intervals (the blue, green and cyan coloured regions in Fig. 3) in the F region of SIR 2. All the PHA events are weighted by the base rate (Drews 2013) and shown with blue and red colour for the small (CountsS ) and the main channel (CountsM) respectively. Measurements of the two channels overlap at around the TOF channels from 150 to 250 and the ESA channels from 52 to 74. The expected positions for H+, He2+, and O6+ are shown with green, yellow and magenta dashed lines. The proton data extracted for this work is indicated with two black dashed lines while the corresponding proton velocities are given at the right Y axis.
Current usage metrics show cumulative count of Article Views (full-text article views including HTML views, PDF and ePub downloads, according to the available data) and Abstracts Views on Vision4Press platform.
Data correspond to usage on the plateform after 2015. The current usage metrics is available 48-96 hours after online publication and is updated daily on week days.
Initial download of the metrics may take a while.