Fig. 5.
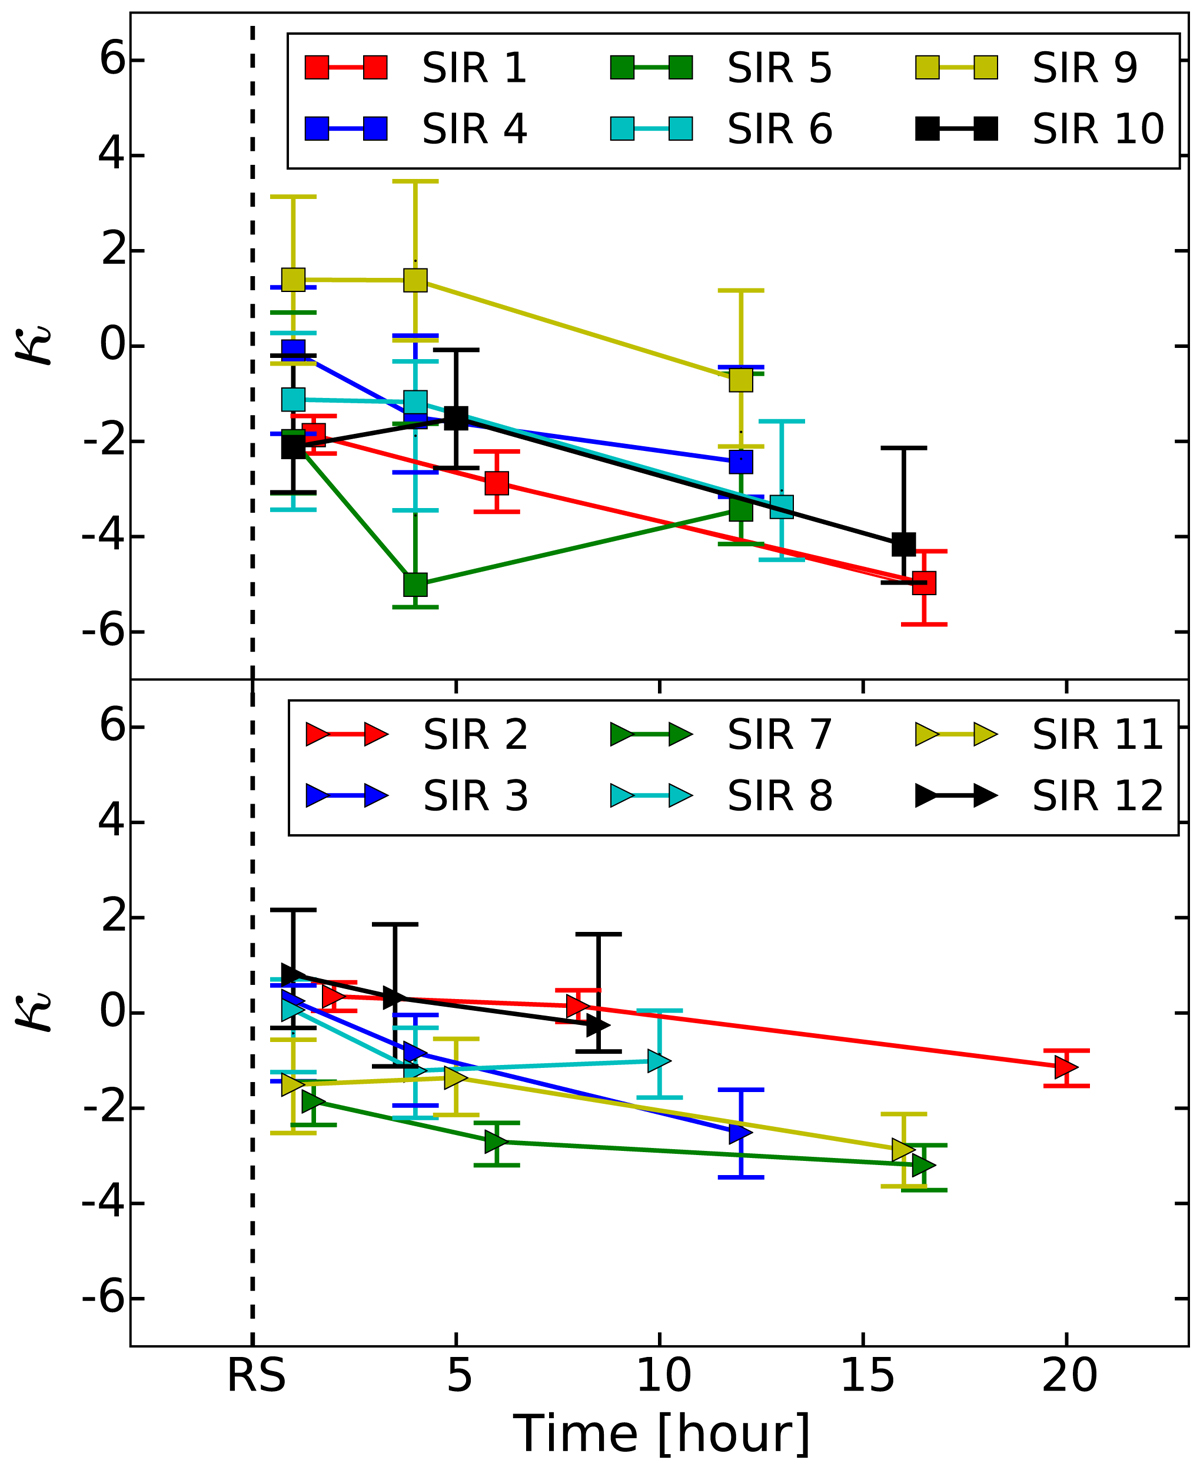
Temporal variations of κ of normalized spectra in the F regions at velocities higher than 2500 km s−1. The upper panel shows the SIR events that exhibit continuous power laws in both F and F′ regions in Figs. 3 and 4, while the other events with turnover spectra at velocities lower than 2500 km s−1 are given in the lower panel.
Current usage metrics show cumulative count of Article Views (full-text article views including HTML views, PDF and ePub downloads, according to the available data) and Abstracts Views on Vision4Press platform.
Data correspond to usage on the plateform after 2015. The current usage metrics is available 48-96 hours after online publication and is updated daily on week days.
Initial download of the metrics may take a while.