| Issue |
A&A
Volume 614, June 2018
|
|
|---|---|---|
| Article Number | A107 | |
| Number of page(s) | 5 | |
| Section | Interstellar and circumstellar matter | |
| DOI | https://doi.org/10.1051/0004-6361/201732288 | |
| Published online | 26 June 2018 | |
Reactivity in interstellar ice analogs: role of the structural evolution
1
Laboratoire Univers et Particules de Montpellier, UMR 5299, CNRS et Université de Montpellier, Place Eugène Bataillon, 34095 Montpellier Cedex 05, France
2
Max-Planck-Institut für Extraterrestrische Physik, Giessenbachstr. 1, 85748 Garching, Germany
3
Aix-Marseille Université, Physique des Interactions Ioniques et Moléculaires, PIIM UMR CNRS, 7345 Avenue Escadrille Normandie-Niémen, 13397 Marseille Cedex 20, France
email: This email address is being protected from spambots. You need JavaScript enabled to view it.
Received:
13
November
2017
Accepted:
5
February
2018
Abstract
Context. The synthesis of interstellar complex organic molecules in ice involves several types of reactions between molecules and/or radicals that are usually considered to be diffusion controlled.
Aims. We aim to understand the coupling between diffusion and reactivity in the interstellar ice mantle using a model binary reaction in the diffusion-limited regime.
Methods. We performed isothermal kinetic laboratory experiments on interstellar ice analogs at low temperatures, using the NH3:CO2:H2O model system where reactants NH3 and CO2 have a low reaction barrier and are diluted in a water-dominated ice.
Results. We found that in the diffusion-limited regime, the reaction kinetics is not determined by the intrinsic bulk diffusivity of reactants. Instead, reactions are driven by structural changes evolving in amorphous water ice, such as pore collapse and crystallization. Diffusion of reactants in this case likely occurs along the surface of (tiny) cracks generated by the structural changes.
Conclusions. The reactivity driven by the structural changes breaks the conventional picture of reactant molecules/radicals diffusing in a bulk water ice. This phenomenon is expected to lead to a dramatic increase in production rates of interstellar complex organic molecules in star-forming regions.
Key words: astrochemistry / molecular processes / ISM: molecules
Present address: Institut de Chimie Moléculaire de l’Université de Bourgogne, UMR 6302 CNRS, Université de Bourgogne Franche-Comté, 9 Avenue A. Savary, BP 47 870, 21078 Dijon Cedex, France.
Present address: Laboratoire de Physique des Lasers, Atomes et Molécules, UMR CNRS 8523, Université Lille 1 Sciences Technologies, Villeneuve d’Ascq Cedex, France
© ESO 2018
1. Introduction
Many interstellar complex organic molecules (iCOMs) are thought to form in the interstellar ice mantles (Aikawa et al. 2003; Caselli & Ceccarelli 2012). The detection of iCOMs in the interstellar medium (ISM) has been accelerated the past decades thanks to the recent availability of powerful instruments such as Herschel or ALMA (Belloche et al. 2016). The detection of iCOMs in our solar system by recent missions such as Rosetta (Quirico et al. 2016) or New Horizon (Gladstone et al. 2016), as well as the discovery of exoplanet atmospheres (Swain et al. 2009), poses a very important question about the level of molecular complexity that can be reached in space.
The low-temperature solid-state chemistry that leads to the formation of iCOMs in ice is poorly known (Bacmann et al. 2012). It occurs in amorphous ice, also called amorphous solid water (ASW) ice, which is observed both in dense molecular clouds as a frost on interstellar dust (Gibb et al. 2004) and as a cometary ice (Davies et al. 1997). This chemistry is out-of-equilibrium and therefore kinetically controlled. A set of radical-radical (Zhitnikov & Dmitriev 2002), radical-molecule (Oba et al. 2012; Borget et al. 2017), and molecule-molecule (Theulé et al. 2013) reactions takes place in the ice, with characteristic reaction barriers on the order of 0, 1, and 10 kJ mol−1 respectively, which are typically lower than the diffusion barriers of the reactants (Livingston et al. 2002). Ice chemistry is therefore largely diffusion limited. The surface diffusion is known to be much faster than the bulk diffusion (see., e.g., Livingston et al. 2002). On the other hand, the surface chemistry only affects the topmost monolayer (ML), that is, 2–3% of a typical ~100 ML thick ice, and thus 97–98% of the reactants remain in the bulk once the mantle is built up. In the conventional picture of reactants diffusing in the ice mantle and meeting each other to form iCOMs, the bulk chemistry at low or mild (before the ice desorption) temperatures should be inefficient because of the scarcity of the reactants and the slowness of their bulk diffusion. However, our previous works on diffusion of solute molecules in bulk ice show a water solvent-driven diffusion (Mispelaer et al. 2013; Ghesquière et al. 2015), which questions this conventional picture.
In this work we experimentally address the kinetics of binary reactions occurring in the bulk ice in the diffusion-limited regime. The characteristic diffusion time that is longer than the reaction time is ensured by a low reaction barrier and by a high dilution of solute reactants in water ice (the latter reduces the probability that reactions occur due to accidental closeness of the reactants). Experimentally, it is obviously easier to handle closed-shell molecules than radicals, and therefore we chose the model reaction  , where one molecule of CO2 reacts with two molecules of NH3 (ternary reaction) to form
  ammonium carbamate (AC). The measure barrier for this reaction, ≈5 kJ mol−1 (Noble et al. 2014), is lower than the bulk diffusion barriers, which is expected to be about a few tens of kJ mol−1 (Livingston et al. 2002; Smith et al. 1997a). The dilution of both CO2 and NH3 reactants was chosen to exceed 1:4 (with respect to water), since neutron beam scattering experiments show that one molecule on average has 4.2 nearest neighbors in ASW (Bowron et al. 2006; Finney et al. 2002).
Our experimental kinetic studies on this model reaction show that the consumption of the reactants and apparition of products is intimately correlated with the structural changes evolving in ASW ices. This breaches the classical picture of reactants undergoing a bulk diffusion in the ice mantles. The reactivity mechanism driven by structural changes in the bulk ice has strong astrophysical implications as it allows radical-radical, radical-molecule, and molecule-molecule reactions to occur at a rate much higher than the previously expected bulk diffusion rate. This phenomenon should stimulate production of iCOMs in star-forming regions, where the ice is warmed up, and therefore it has to be taken into account when modeling iCOM observations.
2. Experimental
Our experiments were carried out on the reactivity on interstellar grains (RING) experimental setup, which has been especially designed to study chemistry in interstellar ice analogs. A gold-plated copper surface was maintained at a low temperature using a closed-cycle helium cryostat (ARS Cryo, model DE-204 SB, 4 K cryogenerator) within a high-vacuum chamber a at a few 10−9 hPa base pressure (at room temperature). The surface temperature was controlled using a Lakeshore Model 336 temperature controller and a cylindrical heating resistance mounted inside the copper sample holder. The temperature was measured with a DTGS 670 silicon diode with a 0.1 K uncertainty. By applying Fourier-transform infrared (FTIR) spectroscopy, absorption spectra were obtained in the reflection mode with a Vertex 70 spectrometer, using either a DTGS detector or a liquid N2 cooled MCT detector (Mispelaer et al. 2013). A typical spectrum has a 1 cm−1 resolution and is averaged over 100 interferograms. Gas-phase CO2 and NH3 are commercially available in the form of 99.9995% pure gas from Air Liquide. The H2O vapor was obtained from deionized water that was purified by several freeze-pump-thaw cycles, carried out under primary vacuum. A gas mixture of NH3, CO2, and H2O was prepared in a 1 L glass vacuum line, where it was kept for one hour to ensure a homogeneous gas mixing.
A compact NH3:CO2:H2O cryogenic molecular solid was formed by low-pressure vapor deposition of the gas mixture at normal incidence on the surface at 80 K. This temperature was chosen to have a (partially) compact ASW ice while freezing CO2, which is known to desorb at 95 K (Noble et al. 2012). The initial ice thickness was estimated using the IR absorption band of the water OH stretching (band strength 2.1×10⁻¹⁶ cm mol−1 Hagen et al. 1983) at 3280 cm−1 and adopting the ASW ice density of 0.94 g cm−3 (Mayer & Pletzer 1986). The initial NH3:CO2:H2O concentration ratio in ice was deduced from the IR spectrum as illustrated in Fig. 1. The uncertainty for the concentrations and the thicknesses is estimated to be about 20%, which is primarily determined by uncertainties for the band strengths and the ice density. Then, to prevent NH3 and CO2 desorption, a “cork” of pure water ice (of a few tens of layers) was deposited on top of the initial ice mixture. According to Fraser et al. (2001), it takes about three days to desorb such a cork at 130 K. Hence, the cork ensured that the observed disappearance of the reactants at all temperatures was solely due to their reactivity.
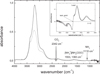 |
Fig. 1. FTIR spectrum of an NH3:CO2:H2O ice mixture at 80 K (expt 11) after the deposition (dotted lines) and after a H2O “cork” is placed on top of it (solid lines). The inset illustrates the structural evolution of ASW ice, characterized by the difference spectrum of the water ice stretching mode at constant temperature. The isobestic point at 3225 cm−1 is not affected by the evolution. |
The initial ASW ice (with a cork on it) was left to relax at 100 K for one hour to stabilize the pore network (Wu et al. 2011; Mispelaer et al. 2013; Mitchell et al. 2016) and thus to decrease the surface-to-volume ratio (Bossa et al. 2014). Working with a relaxed ice stabilizes the pore clustering and thus should improve the reproducibility of our experiments. However, Isokoski et al. (2014) showed that even after annealing at 120 K, the residual porosity remains at 17 ± 3%, which has been corroborated by Mitchell et al. (2016) and Hill et al. (2016).This means that even after one hour of relaxing at 100 K, our ice mixture may not be fully compact, and porosity is expected to affect the crystallization process (Mitchell et al. 2016). The ice was then heated to the desired temperature and kept at this level for the duration of the experiment. Table 1 summarizes the experiments performed with different NH3:CO2:H2O initial ratios, thicknesses, and temperatures. Experiments at 120 K are limited by the maximum time of stability of our experimental setup, while at 140 K, they are limited by the desorption time.
List of experiments with the corresponding temperature, initial concentration ratio, and thickness.
The diffusion-reaction isothermal kinetics is measured by monitoring the evolution of the reactants and products abundances, deduced from their characteristic IR absorption bands: the asymmetric stretching band of CO2 at 2342 cm−1 (band strength 1.4 × 10⁻¹⁷ cm mol−1 in water ice Sandford & Allamandola 1990), the NH3 umbrella mode at 1110 cm−1 (band strength 1.3 × 10⁻¹⁷ cm mol−1 Kerkhof et al. 1999), as well as the ![Mathematical equation: $ {\nu }_{{as}}({\mathrm{COO}}^{-})[{\mathrm{NH}}_4^{+}][{\mathrm{NH}}_2{\mathrm{COO}}^{-}]$](/articles/aa/full_html/2018/06/aa32288-17/aa32288-17-eq4.gif) band at 1553 cm−1 and the
band at 1553 cm−1 and the ![Mathematical equation: $ \mathrm{\nu }(\mathrm{CN})[{\mathrm{NH}}_4^{+}][{\mathrm{NH}}_2{\mathrm{COO}}^{-}]$](/articles/aa/full_html/2018/06/aa32288-17/aa32288-17-eq5.gif) band at 1393 cm−1 for ammonium carbamate (AC) (Bossa et al. 2008). While for different isothermal experiments between 120 K and 140 K the disappearance of the CO2 reactant and the appearance of the AC product yield clear curves, the time evolution of NH3 is hard to record because of the broadness of the 1110 cm−1 band and the noise from our detector in this region.
band at 1393 cm−1 for ammonium carbamate (AC) (Bossa et al. 2008). While for different isothermal experiments between 120 K and 140 K the disappearance of the CO2 reactant and the appearance of the AC product yield clear curves, the time evolution of NH3 is hard to record because of the broadness of the 1110 cm−1 band and the noise from our detector in this region.
The structural changes evolving in the ice are quantified with the difference spectrum in the OH stretching mode region: we monitored the maximum at 2900–3200 cm−1 and the minimum at 3250–3400 cm−1. The former spectral region is affected by the profile modification due to HOH…NH3 complexing, while the latter region is affected by the ammonia NH stretch (Hagen et al. 1983) and possible signal saturation. For these reasons, we followed fixed frequency points instead of integrating bands in the regions, similar to Smith et al. (2011). The isobestic point of each curve, at 3225 cm−1 in the inset in Fig. 1, was not affected by the structural changes. Each spectrum was scaled to the initial spectrum (at t = 0) at the isobestic point, to correct for small but noticeable water desorption from the cork. The deduced structural evolution encompasses different phenomena with different timescales and temperature ranges.
3. Results
We performed kinetic experiments for which the disappearance of the CO2 reactant, the appearance of the AC product, and the structural changes in the ASW sample were recorded as functions of time at a fixed temperature. The results are illustrated in Fig. 2, where all curves are normalized to unity at the maximum; the decreasing CO2 curve is flipped with respect to unity to facilitate the comparison. The results for 120 K indicate that the reactivity evolves much faster than the expected crystallization because the crystallization induction time in this case (~105 s according to Faure et al. 2015) exceeds the time of the experiment. This trend is observed in both experiments 1 and 2. At the same time, the reactivity curve follows the curve of the structural evolution. Given the 17 ± 3% residual porosity estimated by Isokoski et al. (2014) after an annealing at 120 K, the structural changes in our case can be entirely attributed to ongoing pore collapse. At 130 K, the induction is likely manifested by a kink seen in the structural evolution curve at ~104 s, which is consistent with the induction time measured for this temperature by Faure et al. (2015) (it is generally expected that the induction time depends on the host species presented in the ice). Again, we see correlated changes occurring in the reactivity and structure of the ice. At 135 K the predicted induction time becomes quite short, ~3×10³ s (Faure et al. 2015), while at 140 K it is negligibly short. Hence, unlike the case of 120 K, for experiments at 130, 135, and 140 K, crystallization is expected to be the leading mechanism of the structural evolution. Still, at all temperatures we clearly observe a strong correlation between the reaction kinetics and the structural changes, regardless of the leading mechanism behind the latter process.
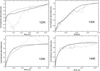 |
Fig. 2. Kinetics of the decay of the CO2 reactant (band at 2342 cm−1 flipped for a better comparison, dashed line), formation of the AC product (band at 1553 cm-1, dotted line), and structural evolution of ASW ice (point at 3307 cm−2, solid line) at 120 K (expt 2), 130 K (expt 7), 135 K (expt 8), and 140 K (expt 10). |
To quantify this correlation better, we fit the reaction and structural curves against an empirical 1 − exp(−t/τk) function, and evaluated the resulting characteristic time τk for the whole set of experiments summarized in Table 1 (where k stands for SE, CO2, or AC). The uncertainty on the structural evolution (SE) and CO2 timescales is estimated at 30% and at up to 100% on the AC timescale. The uncertainties mainly come from the choice of the boundary conditions, from the desorption correction, and from the smallness of band integral variations compared to the baseline changes. Since the CO2 is consumed at the same rate as the carbamate is produced, the apparent difference between their kinetics clearly reflects difficulties of monitoring the evolution of different bands.
The characteristic times for the whole set of experiments are plotted in Fig. 3 versus the temperature. The temperature depen-dencies for the CO2 consumption and AC production follow, within the experimental dispersion, the dependence for the ASW structural evolution. The structural evolution times for 130 K, 135 K, and 140 K are comparable to the crystallization times derived by Smith et al. (2011) and Faure et al. (2015); note that these authors fit their kinetics data with an Avrami law (while we used an exponential law). On the other hand, the characteristic times for 120 K and 125 K are substantially shorter than the crystallization times, presumably because the pore collapse becomes the dominant process governing the structural evolution at lower temperatures. Figure 3 also illustrates the spread of timescales between the experiments at a given temperature. Such a large dispersion is typical for amorphous solids and for ASW crystallization in the presence of impurities (Johari 1991; Faure et al. 2015).
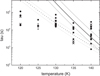 |
Fig. 3. Comparison of different characteristic timescales, plotted vs. temperature for the experiments listed in Table 1: CO2 reactant decay (circle), AC production (square), and ASW structural evolution (cross). The typical uncertainty on each timescale is illustrated for T = 125 K (the uncertainty is similar for other temperatures). The crystallization timescales derived from measurements by FaureIcar15 (FaureIcar15; dashed line) and SmithJPCA11 (SmithJPCA11; solid line) are also depicted, along with their respective uncertainties. |
4. Discussion
The experiments presented above demonstrate a strong correlation between the reaction kinetics in bulk ices and their structural evolution. The observed behavior is very different from a clas-sical picture of reactants diffusing through a bulk network of fixed hydrogen-bonded water molecules, until they occasionally meet to form the reaction products. The results would rather be interpreted as an effect of emerging structural features (such as crack opening) induced in the ASW mantle by crystallization or pore collapse. We point out that structural features are generally known to critically affect transport properties of solids: for instance, diffusion occurring in alloys along microstructural defects, such as grain boundaries or dislocation pipes, can be dramatically faster than bulk diffusion through a monocrystal (Stechauner & Kozeschnik 2014).
ASW ice is a kinetically metastable solid phase, slowly (≃10 million years at 80 K Baragiola 2003) transforming into thermodynamically stable crystalline ice. During the crystalliza-tion process, cracks are formed throughout the ice that suddenly increase the inner surface-to-volume ratio (May et al. 2012). The cracks may span the entire volume of the ice, to form percolat-ing pathways. A part of these cracks open to an outer surface, leading to an episodic release of trapped gases (Smith et al. 1997b; May et al. 2013). The pathways of inner cracks give rise to a long-range diffusion throughout their surface. This suggests that ASW exhibits liquid-like translational diffusion, ~ 10(6±1) greater than the bulk diffusion in crystalline ice (Smith et al. 1997a). The hypothesis that the enhanced reactivity is due to surface diffusion along the inner crack walls is further supported by the agreement between the values of CO diffusion coefficient measured at temperatures where ASW ice is still porous (Mispelaer et al. 2013; Karssemeijer et al. 2014; Lauck et al. 2015) and the surface diffusion calculations (Karssemeijer et al. 2014)
Structural evolution of ASW ice is a complex process. It has been shown that the crystallization has two distinct stages, induction and propagation (May et al. 2013; Faure et al. 2015; Mitchell et al. 2016), and that the initial ice porosity (external and internal) has a major influence on the crystallization kinetics (Mitchell et al. 2016), which, in turn, is affected by the presence of impurities (volatiles) in a water-dominated ice (Johari 1991; Faure et al. 2015). Moreover, although microporosity disappears during the pore collapse and the resulting ice compaction (Isokoski et al. 2014), mesoporosity (2–50 nm) may still be present at 140 (Raut et al. 2007).
The conclusion that molecular transport in ASW ice can be driven by ongoing structural changes has several implications of general importance:
-
The reactivity of diluted molecules/radicals in water ice can be dramatically enhanced compared to the case when their transport is governed by a regular bulk diffusion.
-
The diffusion throughout the surface of cracks created in ASW ice is expected to be much less dependent on a particular sort of (heavy) molecules/radicals (Mispelaer et al. 2013; Ghesquière et al. 2015).
-
Volatile molecules/radicals that do not occur at the surface of the cracks remain trapped in the ice (Collings et al. 2004; Viti et al. 2004; May et al. 2013). This affects the overall reaction yield as well as the release of volatiles from the ice (May et al. 2013). The yield is expected to depend on a number of parameters, such as the ice thickness, temperature increase rate, initial porosity, and thermal history.
5. Astrophysical relevance and conclusions
The presented results may have profound astrochemical consequences, changing traditional theoretical description of reaction-diffusion in gas-grain chemistry models (see., e.g., Tielens & Hagen 1982; Hasegawa et al. 1992). The results are particularly relevant to star-forming regions (Caselli & Ceccarelli 2012), where ice can be warmed to temperatures allowing both rotational (T ≳ 115 K) and long-range translational (T ≳ 120 K) diffusion of heavy molecules. Under such conditions, molecules or/and radicals observed in IR spectra of ices (Dartois 2005) can effectively form iCOMs in the volume of the icy mantles.
On the one hand, when interstellar grains are in a certain vicinity of a protostar, their icy mantles tend to crystallize to a thermodynamically stable cubic lattice, but on the other hand, the ice becomes amorphous due to bombardment by high-energy electrons (Dubochet & Lepault 1984) and ions (Baratta et al. 1991; Moore & Hudson 1992; Dartois et al. 2015), or due to irrad-iation by UV photons (Kouchi & Kuroda 1990; Leto & Baratta 2003). Depending on the location of dust grains with respect to the protostar, the radical creation by radiolysis and photo-chemistry and the reactivity driven by the structural changes can provide an extremely efficient combination for creating iCOMs in the icy mantles. In this context, for the theoretical descrip-tion of ice chemistry in protoplanetary disks, it can be crucial to account for the episodic changes in the ice surface-to-volume ratio caused by the temperature variations.
By lifting the constraints imposed by the conventional reaction-diffusion paradigm on the molecular transport in the bulk ice, the reactivity driven by the structural changes opens promising new ways to produce iCOMs in interstellar environment. In terms of the reaction rates and yields, this mechanism can provide a dramatic enhancement in comparison with the conventional transport models. Further experiments are certainly needed to carefully investigate the effect of different initial ice morphologies and thermal histories on the proposed reactivity mechanism, in order to implement this in the gas-grain chemistry models.
Acknowledgments
This work was supported by the Programme National Physique et Chimie du Milieu Interstellaire (PCMI) of CNRS/INSU with INC/INP co-funded by CEA and CNES.
References
- Aikawa, Y., Ohashi, N., & Herbst, E. 2003, ApJ, 593, 906 [NASA ADS] [CrossRef] [Google Scholar]
- Bacmann, A., Taquet, V., Faure, A., Kahane, C., & Ceccarelli, C. 2012, A&A, 541, L12 [NASA ADS] [CrossRef] [EDP Sciences] [Google Scholar]
- Baragiola, R. A. 2003, Planet. Space Sci., 51, 953 [NASA ADS] [CrossRef] [Google Scholar]
- Baratta, G. A., Leto, G., Spinella, F., Strazzulla, G., & Foti, G. 1991, A&A, 252, 421 [Google Scholar]
- Belloche, A., Müller, H. S. P., Garrod, R. T., & Menten, K. M. 2016, A&A, 587, A91 [NASA ADS] [CrossRef] [EDP Sciences] [Google Scholar]
- Borget, F, Müller, S., & Grote, D. et al. 2017, A&A, 598, A22 [NASA ADS] [CrossRef] [EDP Sciences] [Google Scholar]
- Bossa, J. B., Theulé, P., Duvernay, F., Borget, F., & Chiavassa, T. 2008, A&A, 492, 719 [NASA ADS] [CrossRef] [EDP Sciences] [Google Scholar]
- Bossa, J.-B., Isokoski, K., & Paardekooper, D. M., et al2014, A&A, 561, A136 [NASA ADS] [CrossRef] [EDP Sciences] [Google Scholar]
- Bowron, D. T., Finney, J. L., & Hallbrucker, A., et al. 2006, J. Chem. Phys., 125, 194502 [CrossRef] [Google Scholar]
- Caselli, P., & Ceccarelli, C. 2012, A&ARv, 20, 56 [Google Scholar]
- Collings, M. P., Anderson, M. A. & Chen, R., et al. 2004, MNRAS, 354, 1133 [NASA ADS] [CrossRef] [Google Scholar]
- Dartois, & E. 2005, Space Sci. Rev., 119, 293 [NASA ADS] [CrossRef] [Google Scholar]
- Dartois, E., Augé, B. & Boduch, P., et al. 2015, A&A, 576, A125 [NASA ADS] [CrossRef] [EDP Sciences] [Google Scholar]
- Davies, J. K., Roush, T. L., & Cruikshank, D. P., et al. 1997, Icarus, 127, 238 [NASA ADS] [CrossRef] [Google Scholar]
- de Barros, A. L. F., da Silveira, E. F., Rothard, H., Langlinay, T., & Boduch, P. 2014, MNRAS, 443, 2733 [CrossRef] [Google Scholar]
- Dubochet, J., & Lepault, J. 1984, J. Phys., 45, 85 [CrossRef] [Google Scholar]
- Faure, M., Quirico, E. & Faure, A., et al. 2015, Icarus, 261, 14 [NASA ADS] [CrossRef] [Google Scholar]
- Finney, J. L., Hallbrucker, A., Kohl, I., Soper, A. K., & Bowron, D. T. 2002, Phys. Rev. Lett., 88, 225503 [CrossRef] [PubMed] [Google Scholar]
- Fraser, H. J., Collings, M. P., McCoustra, M. R. S., & Williams, D. A. 2001, MNRAS, 327, 1165 [NASA ADS] [CrossRef] [Google Scholar]
- Ghesquière, P., Mineva, T. & Talbi, D., et al. 2015, Phys. Chem. Chem. Phys., 17, 11455 [CrossRef] [Google Scholar]
- Gibb, E. L., Whittet, D. C. B., Boogert, A. C. A., & Tielens, A. G. G. M. 2004, ApJs, 151, 35 [NASA ADS] [CrossRef] [Google Scholar]
- Gladstone, G. R., Stern, S. A. & Ennico, K., et al. 2016, Science, 351, 8866 [Google Scholar]
- Hagen, W., Tielens, A. G. G. M., & Greenberg, J. M. 1983, A&As, 51, 389 [Google Scholar]
- Hasegawa, T. I., Herbst, E., & Leung, C. M. 1992, ApJs, 82, 167 [NASA ADS] [CrossRef] [Google Scholar]
- Hill, R. C., Mitterdorfer, C. & Youngs, T. G. A., et al. 2016, Phys. Rev. Lett., 116, 215501 [CrossRef] [Google Scholar]
- Isokoski, K., Bossa, J.-B., Triemstra, T., & Linnartz, H. 2014, Phys. Chem. Chem. Phys., 16, 3456 [NASA ADS] [CrossRef] [Google Scholar]
- Jenniskens, P., Blake, D. F., Wilson, M. A., & Pohorille, A. 1995, ApJ, 455, 389 [NASA ADS] [CrossRef] [Google Scholar]
- Johari, G. P., & 1991, J. Phys. Chem., 95, 6849 [CrossRef] [Google Scholar]
- Karssemeijer, L. J., Ioppolo, S. & van Hemert, M. C., et al. 2014, ApJ, 781, 16 [NASA ADS] [CrossRef] [Google Scholar]
- Kerkhof, O., Schutte, W. A., & Ehrenfreund, P. 1999, A&A, 346, 990 [Google Scholar]
- Kouchi, A., & Kuroda, T., 1990. Nature, 344, 134 [NASA ADS] [CrossRef] [Google Scholar]
- Kouchi, A., & SironoS.-i. 2001, Geophys. Res. Lett., 28, 827 [NASA ADS] [CrossRef] [Google Scholar]
- Lauck, T., Karssemeijer, L. & Shulenberger, K., et al2015, ApJ, 801, 118 [NASA ADS] [CrossRef] [Google Scholar]
- Leto, G., & Baratta, G. A. 2003, A&A, 397, 7 [NASA ADS] [CrossRef] [EDP Sciences] [Google Scholar]
- Livingston, F. E., Smith, J. A., & George, S. M. 2002, J. Phys. Chem. A, 106, 6309 [CrossRef] [Google Scholar]
- Mate, B., Rodriguez-Lazcano, Y., & Herrero, V. J. 2012, Phys. Chem. Chem. Phys., 14, 95 [NASA ADS] [CrossRef] [Google Scholar]
- May, R. A., Smith, R. S., & Kay, B. D. 2012, Phys. Chem. Chem. Phys., 3, 327 [Google Scholar]
- May, R. A., Smith, R. S., & Kay, B. D. 2013, J. Chem. Phys., 138, 104501 [NASA ADS] [CrossRef] [Google Scholar]
- Mayer, E., & Pletzer, R.. 1986. Nature, 319, 298 [NASA ADS] [CrossRef] [Google Scholar]
- Mispelaer, F., Theulé, P. & Aouididi, H., et al. 2013, A&A, 555, A13 [NASA ADS] [CrossRef] [EDP Sciences] [Google Scholar]
- Mitchell, E. H., Raut, U., Teolis, B. D., & Baragiola, R. A. 2016, Icarus, 285, 291 [CrossRef] [Google Scholar]
- Moore, M. H., & Hudson, R. L. 1992, ApJ, 401, 353 [NASA ADS] [CrossRef] [Google Scholar]
- Noble, J. A., Congiu, E., Dulieu, F., & Fraser, H. J. 2012, MNRAS, 421, 768 [NASA ADS] [Google Scholar]
- Noble, J. A., Theulé, P. & Duvernay, F., et al. 2014, Phys. Chem. Chem. Phys., 16, 23604 [CrossRef] [Google Scholar]
- Oba, Y., Watanabe, N. & Hama, T., et al. 2012, ApJ, 749, 67 [NASA ADS] [CrossRef] [Google Scholar]
- Quirico, E., Moroz, L. V. & Schmitt, B., et al. 2016, Icarus, 272, 32 [NASA ADS] [CrossRef] [Google Scholar]
- Raut, U., Famà, M., Teolis, B. D., & Baragiola, R. A. 2007, J. Chem. Phys., 127, 204713 [NASA ADS] [CrossRef] [Google Scholar]
- Sandford, S. A., & Allamandola, L. J. 1990, ApJ, 355, 357 [NASA ADS] [CrossRef] [Google Scholar]
- Smith, R. S., Huang, C., & Kay, B. D. 1997a, J. Phys. Chem. B, 101, 6123 [CrossRef] [Google Scholar]
- Smith, R. S., Huang, C., Wong, E. K. L., & Kay, B. D. 1997b, Phys. Rev. Lett., 79, 909 [NASA ADS] [CrossRef] [Google Scholar]
- Smith, R. S., Matthiesen, J., Knox, J., & Kay, B. D. 2011, J. Phys. Chem. A, 115, 5908 [CrossRef] [Google Scholar]
- Stechauner, G., & Kozeschnik, E. 2014, J. Mater. Eng. Perform., 23, 1576 [CrossRef] [Google Scholar]
- Swain, M. R., Tinetti, G. & Vasisht, G., et al. 2009, ApJ, 704, 1616 [NASA ADS] [CrossRef] [Google Scholar]
- Theulé, P., Duvernay, F., & Danger, G., et al. 2013, Adv. Space Res., 52, 1567 [NASA ADS] [CrossRef] [Google Scholar]
- Tielens, A. G. G. M., & Hagen, W. 1982, A&A, 114, 245 [Google Scholar]
- Viti, S., Collings, M. P., Dever, J. W., McCoustra, M. R. S., & Williams, D. A. 2004, MNRAS, 354, 1141 [NASA ADS] [CrossRef] [Google Scholar]
- Wu, Y. C., Jiang, J., Wang, S. J., Kallis, A., & Coleman, P. G. 2011, Phys. Rev. B, 84, 064123 [CrossRef] [Google Scholar]
- Yuan, C., Smith, R. S.,& Kay, B. D. 2016, Surf. Sci., 652, 350 [CrossRef] [Google Scholar]
- Zhitnikov, R. A., & Dmitriev, Y. A. 2002, A&A, 386, 1129 [CrossRef] [EDP Sciences] [Google Scholar]
All Tables
List of experiments with the corresponding temperature, initial concentration ratio, and thickness.
All Figures
|
Fig. 1. FTIR spectrum of an NH3:CO2:H2O ice mixture at 80 K (expt 11) after the deposition (dotted lines) and after a H2O “cork” is placed on top of it (solid lines). The inset illustrates the structural evolution of ASW ice, characterized by the difference spectrum of the water ice stretching mode at constant temperature. The isobestic point at 3225 cm−1 is not affected by the evolution. |
| In the text | |
|
Fig. 2. Kinetics of the decay of the CO2 reactant (band at 2342 cm−1 flipped for a better comparison, dashed line), formation of the AC product (band at 1553 cm-1, dotted line), and structural evolution of ASW ice (point at 3307 cm−2, solid line) at 120 K (expt 2), 130 K (expt 7), 135 K (expt 8), and 140 K (expt 10). |
| In the text | |
|
Fig. 3. Comparison of different characteristic timescales, plotted vs. temperature for the experiments listed in Table 1: CO2 reactant decay (circle), AC production (square), and ASW structural evolution (cross). The typical uncertainty on each timescale is illustrated for T = 125 K (the uncertainty is similar for other temperatures). The crystallization timescales derived from measurements by FaureIcar15 (FaureIcar15; dashed line) and SmithJPCA11 (SmithJPCA11; solid line) are also depicted, along with their respective uncertainties. |
| In the text | |
Current usage metrics show cumulative count of Article Views (full-text article views including HTML views, PDF and ePub downloads, according to the available data) and Abstracts Views on Vision4Press platform.
Data correspond to usage on the plateform after 2015. The current usage metrics is available 48-96 hours after online publication and is updated daily on week days.
Initial download of the metrics may take a while.