Fig. 3.
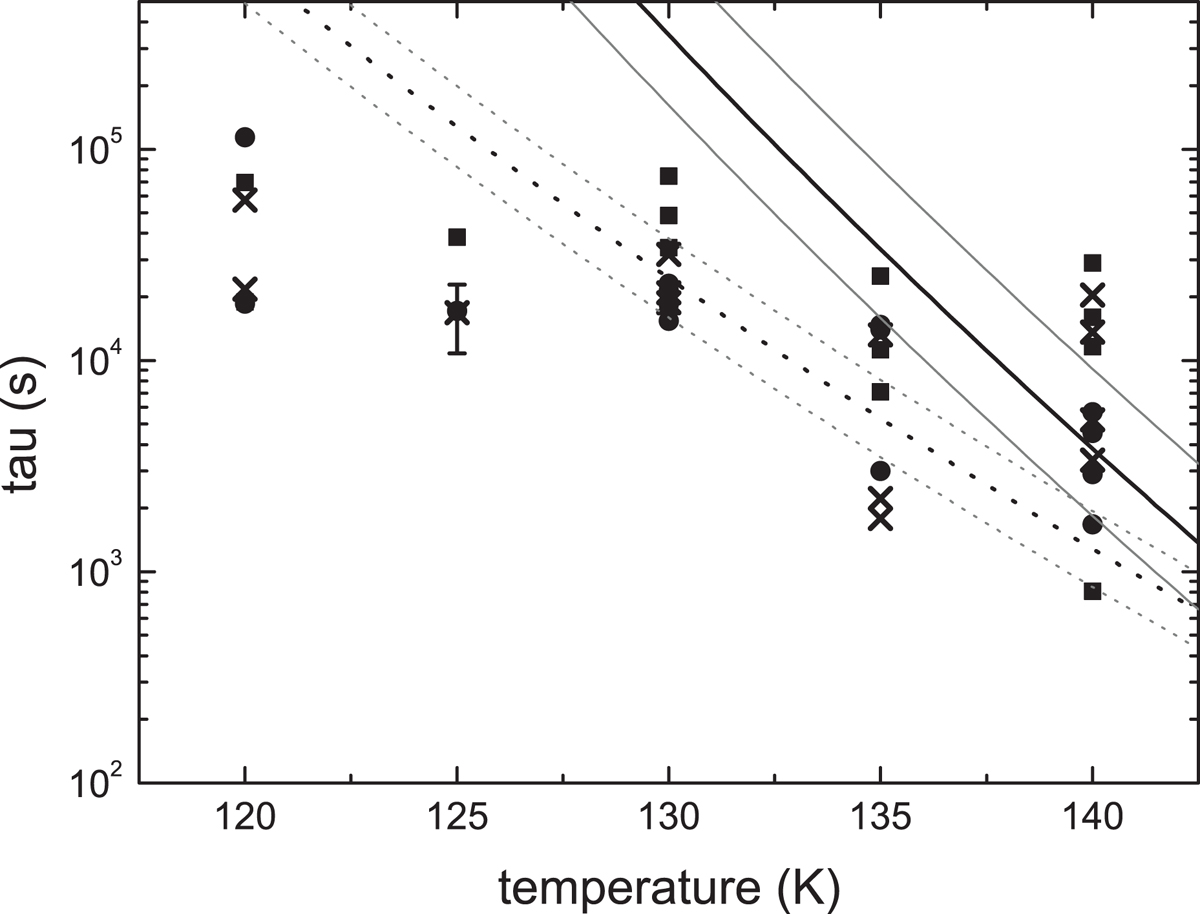
Comparison of different characteristic timescales, plotted vs. temperature for the experiments listed in Table 1: CO2 reactant decay (circle), AC production (square), and ASW structural evolution (cross). The typical uncertainty on each timescale is illustrated for T = 125 K (the uncertainty is similar for other temperatures). The crystallization timescales derived from measurements by FaureIcar15 (FaureIcar15; dashed line) and SmithJPCA11 (SmithJPCA11; solid line) are also depicted, along with their respective uncertainties.
Current usage metrics show cumulative count of Article Views (full-text article views including HTML views, PDF and ePub downloads, according to the available data) and Abstracts Views on Vision4Press platform.
Data correspond to usage on the plateform after 2015. The current usage metrics is available 48-96 hours after online publication and is updated daily on week days.
Initial download of the metrics may take a while.