| Issue |
A&A
Volume 614, June 2018
|
|
|---|---|---|
| Article Number | A143 | |
| Number of page(s) | 16 | |
| Section | Extragalactic astronomy | |
| DOI | https://doi.org/10.1051/0004-6361/201732271 | |
| Published online | 29 June 2018 | |
Systematic search for tidal features around nearby galaxies
I. Enhanced SDSS imaging of the Local Volume
1
Astronomisches Rechen-Institut, Zentrum für Astronomie der Universität Heidelberg,
Mönchhofstr. 12–14,
69120
Heidelberg, Germany
e-mail: gustavo85@gmail.com
2
Institute for Computational Cosmology, Durham University, Science Site,
South Road,
Durham
DH1 3LE, UK
3
School of Astronomy, Institute for Research in Fundamental Sciences (IPM),
Tehran
19395-5531, Iran
4
Astronomisches Institut der Ruhr-Universität Bochum,
Universitätsstr. 150,
44780
Bochum, Germany
Received:
9
November
2017
Accepted:
23
March
2018
Context. In hierarchical models of galaxy formation, stellar tidal streams are expected around most, if not all, galaxies. Although these features may provide useful diagnostics of the Λ CDM model, their observational properties remain poorly constrained because they are challenging to detect and interpret and have been studied in detail for only a sparse sampling of galaxy population. More quantitative, systematic approaches are required. We advocate statistical analysis of the counts and properties of such features in archival wide-field imaging surveys for a direct comparison against results from numerical simulations. Aims. We aim to study systematically the frequency of occurrence and other observational properties of tidal features around nearby galaxies. The sample we construct will act as a foundational dataset for statistical comparison with cosmological models of galaxy formation.
Methods. Our approach is based on a visual classification of diffuse features around a volume-limited sample of nearby galaxies, using a post-processing of Sloan Digital Syk Survey (SDSS) imaging optimized for the detection of stellar structure with low surface brightness.
Results. At a limiting surface brightness of 28 mag arcsec−2, 14% of the galaxies in our sample exhibit evidence of diffuse features likely to have arisen from minor merging events. Our technique recovers all previously known streams in our sample and yields a number of new candidates. Consistent with previous studies, coherent arc-like features and shells are the most common type of tidal structures found in this study. We conclude that although some detections are ambiguous and could be corroborated or refuted with deeper imaging, our technique provides a reliable foundation for the statistical analysis of diffuse circumgalactic features in wide-area imaging surveys, and for the identification of targets for follow-up studies.
Key words: methods: observational / techniques: image processing / galaxies: formation / galaxies: evolution / galaxies: structure / galaxies: halos
© ESO 2018
1 Introduction
In the Λ cold dark matter (ΛCDM) cosmogony, structures grow hierarchically under the influence of gravity through numerous mergers of smaller structures consisting mainly of dark matter (DM; e.g., Press & Schechter 1974; White & Rees 1978; Blumenthal et al. 1984; Davis et al. 1985; Lacey & Cole 1993). Baryonic matter collects in the potential wells of DM halos, then (in sufficiently massive halos) cools and condenses, eventually leading to star formation. State-of-the-art cosmological simulations seek to model the assembly of dark and baryonic mass, star formation, stellar evolution, and so-called “feedback” processes such as supernovae ab initio in order to demonstrate how complex interactions between these processes give rise to the observed diversity of the cosmic galaxy population (e.g., Kauffmann et al. 1993; Cole et al. 2000; Croton et al. 2006; Vogelsberger et al. 2014; Schaye et al. 2015).
In such models, the stellar content of galaxies forms partly in situ through the condensation of gas in the galaxies themselves, and partly through the accretion of stars tidally stripped from other galaxies that they encounter over cosmic time, which may be partially disrupted or have merged completely by the present day (e.g., Searle & Zinn 1978; Abadi et al. 2006; Purcell et al. 2007). The assembly histories of galaxies with a stellar mass comparable to the mass of the Milky Way vary widely in these models (Guo & White 2008). This is supported by observational results from the detailed study of nearby galaxies. Our Milky Way, for instance, appears to have experienced a relatively quiescent merger history (Hammer et al. 2007), while its neighbor M31 shows a much more extended stellar structure, including a variety of bright stellar streams with different morphologies (e.g., Zucker et al. 2004; McConnachie et al. 2009; Ibata et al. 2014; Thomas et al. 2017).
A well-established prediction is that most of the mass in stellar halos of present-day Milky Way-mass galaxies was contributed more than 9 Gyr ago by a few satellites in the mass range of 108–109 M⊙ (e.g., Bullock & Johnston 2005; De Lucia & Helmi 2008; Cooper et al. 2010; Pillepich et al. 2015; Amorisco 2017b). While stars that formed in situ are expected to dominate the stellar mass profiles of galaxies at small galactocentric radii, accreted stars have a much wider range of binding energies and can give rise to stellar halos extending as far as the virial radius of the host DM halo (e.g., Bullock et al. 2001; Font et al. 2006; Cooper et al. 2013; Rodriguez-Gomez et al. 2016). Long dynamical times in the outer regions of DM halos allow coherent structures formed by tidal stripping, such as streams and shells, to persist for many gigayears (Johnston et al. 2001). Dynamical friction causes the few most massive satellites to deposit their stars at small galactocentric radii, while the outer regions of stellar halos are more likely to consist of material contributed by a number of less massive satellites (e.g., Bullock & Johnston 2005; Amorisco 2017a). Owing to their low stellar densities and intrinsically low luminosities, it is hard to determine both the full extent of stellar halos and their contributions to the innermost regions of galaxies. Together with other difficulties, this makes it challenging to constrain stellar fractions observationally ex situ (e.g., Cooper et al. 2013; D’Souza et al. 2014; Merritt et al. 2016; Harmsen et al. 2017).
It is more straightforward to detect recent and ongoing accretion events involving satellites that are sufficiently luminous to give rise to bright tidal streams in the outskirts of massive galaxies. A growing number of such features have been detected beyond the Local Group in recent years, and further extragalactic surveys reaching sufficiently low surface brightness have recently been completed or are currently ongoing (e.g., Schweizer & Seitzer 1990; Martínez-Delgado et al. 2007, 2008; Mouhcine & Ibata 2009; Miskolczi et al. 2011; Ludwig et al. 2012; Duc et al. 2015; Okamoto et al. 2015; Merritt et al. 2016; Crnojević et al. 2016; Spavone et al. 2017; Harmsen et al. 2017).
Mergersbetween galaxies with very different stellar masses (typically mass ratios of around 1:10 or higher) are often called minor mergers. These generally involve long-period orbits, little orbital decay or angular momentum loss for the less massive galaxy (which we refer to hereafter as the “satellite”), and little disturbance of the central structure of the more massive galaxy. Consequently, thin, coherent stellar tidal streams are a distinctive observable signature of such mergers, more so for less massive, more recently accreted, and kinematically “colder” satellites (Johnston et al. 2008). Gaseous tidal streams are commonly observed around interacting galaxies and can be easily traced through 21 cm observations. They usually overlap with the stellar features unless, for instance, ram pressure separates them. Gaseous streams may also be detectable in optical data, for example, through their Hα emission or dust content. Pure gaseous streams (such as the trailing Magellanic Stream) are rare, whereas pure stellar streams are more common around massive galaxies following the dispersal of any previously associated gas, or when gas-deficient early-type satellites aredisrupted. For a review, see Duc & Renaud (2013). In the case of MW-like hosts, we expect minor merger events to be less frequent in the present-day Universe and the coherent structures they generate (such as tidal tails) to persist only for a few billion years before they become undetectable (Wang et al. 2017). Observationally, however, the frequency with which such streams occur around MW-like hosts and their distribution of morphologies are poorly constrained.
Over the past decade, the Stellar Tidal Stream Survey (STSS) has carried out an ultra-deep, wide-field imaging exploration of several nearby spiral galaxies, based on data taken with amateur robotic telescopes (Martínez-Delgado et al. 2008, 2009, 2010, 2012, 2015). This survey has revealed striking stellar tidal streams of different morphologies with unprecedented depth and detail. Subsequently, Miskolcziet al. (2011) developed a search strategy for low-surface brightness tidal structures around a sample of 474 galaxies in the Sloan Digital Sky Survey (SDSS) Data Release 7 archive (Abazajian et al. 2009). The authors calibrated images taken from the SDSS archive and processed them in an automated manner. Searching for possible tidal streams by visual inspection, they found that at least 6% of their sample showed distinct stream-like features (with a total of 19% presenting faint features of any kind). This study demonstrated that detecting a meaningful sample of tidal features close to the detection limit of the SDSS images is feasible.
Although considerable progress has been made by Miskolczi et al. (2011) and other works, studies of structure with low surfacebrightness in the outskirts of galaxies remain predominantly discovery-driven and qualitative. To enable a meaningful statistical comparison between data with low surface brightness and cosmological models of galaxy formation, two further advances are urgently required: samples with both a well-defined selection function and uniform imaging data, and the development of automated methods to detect and quantify features with low surface brightness.
The majority of existing deep-imaging studies have been targeted at galaxies that are either very nearby or have known features detected in shallower imaging. It is clearly impossible to draw any conclusions about how frequent such features are from these data alone. Furthermore, prior work has focused on structures associated with Milky Way-type galaxies. This definition is subjective; it typically includes galaxies that are sufficiently bright, morphologically regular, and have late Hubble type. Not only does a subjective selection make it harder to compare one observational sample to another, but it is almost impossible to apply a comparable qualitative selection to models. Currently, even the most sophisticated hydrodynamical simulations do not reliably reproduce the full range of morphological details that such judgments are based on. Moreover, selection of Milky Way analogues by qualitative criteria will almost certainly result in a wide sampling of the distribution of fundamental quantities such as stellar mass, and a highly incomplete sample at a given stellar mass. It is much more straightforward, and statistically sound, to carry out comparisons in terms of observable quantities that can be robustly constrained in models, stellar mass being the most obvious choice.
Therefore, to make a meaningful comparison between data and models, deep imaging surveys with simple, quantitative selection functions based on fundamental quantities are necessary. Ideally, these would exploit the statistics of brighter circumgalactic features that can be detected in large samples drawn from shallow wide-area surveys, since the expense of targeted deep imaging is often hard to justify for surveys in which substantial numbers of (statistically important) non-detections are to be expected. Low-surface-brightness features are often said to be ubiquitous, but such statements must take into account the brightness of the features and the depth of the observations. A known (and for a given sample, uniform) limit on depth is crucial to make meaningful statements about counts of structures. Finally, since the role of accretion in the galaxy formation process can be investigated through correlations between structure with low surface brightness and other galaxy properties, it will be necessary to examine large numbers of host galaxies of similar mass without restriction to specific morphologies.
In this work, we take a step toward this more systematic approach by making a statistical assessment of the number of features detected in a survey of a volume-, magnitude-, and size-limited sample of nearby Milky Way-mass (as opposed to Milky Way-type) host galaxies. To keep the study consistent, we select our sample on the basis of mass and recessional velocity. We apply a custom image reduction process uniformly to images of each galaxy in our sample from Data Release 10 of the SDSS (Ahn et al. 2014), reaching a detection limit in surface brightness of approximately 28 mag arcsec−2.
This paper presents our observational results. In subsequent work, they will form the basis of further investigations into the properties and recent evolution of stellar halos and comparisons with theoretical predictions from Λ CDM models. Stellar halos are believed to have formed through a series of accretion events occurring over the lifetime of their host galaxies. Debris associated with the most ancient mergers and those with intrinsically faint progenitors is likely to have extremely low surface brightness at the present day (below 30 mag arcsec−2). The technique we describe here is therefore well suited to studying evidence for more recent (tlookback ~ 4–5 Gyr) interactions and mergers with more massive satellite galaxies, rather than ancient, well-mixed halo components or the contributionof fainter satellites.
Several previous surveys of tidal features have been published, albeit with some key differences in sample selection. Kaviraj (2010) focused on early-type galaxies (ETGs) and found that ~ 18% of their sample exhibited signs of disturbed morphologies (e.g., shells). This sample was also based on SDSS multiband photometry, but combined with the significantly (~2 mag) deeper monochromatic images from the SDSS Stripe 82. Atkinson et al. (2013) studied faint tidal features in galaxies with a wide range of morphologies using the wide-field component of the Canada–France–Hawaii Telescope Legacy Survey. Their sample consisted of 1781 luminous galaxies in the magnitude range 15.5 < r < 17.0. A classification of tidal features according to their morphology (e.g., streams, shells, and tails) was performed, with no major interpretation in terms of their physical origin, especially when distinguishing between major and minor mergers. They found that about 12% of the galaxies in their sample showed clear tidal features at their highest confidence level. This fraction increased to about 18% when they included systems with weaker tidal features. The colors and stellar masses of central galaxies were found to influence these numbers significantly: linear features, shells, and fans were more likely in galaxies with stellar masses > 1010.5 M⊙, and red galaxies were found to be twice more likely to show tidal features than blue galaxies. Table 1 from Atkinson et al. (2013) summarizes an overview of faint substructures studies from earlier work in the literature. We note that no publication attempted a less restricted but still controlled sample, especially focused on a future comparison with state-of-the-art simulations.
Throughout the text, we use the term “overdensity” to refer to any kind of diffuse feature in the processed image that is not obviously the outward continuation of the brighter isophotes of the host galaxy, without making claims regarding their origin or nature (including whether they are real stellar features or are physically associated with the host galaxy). Minor merger signatures, and more specifically, stellar tidal streams, are understood as a particular class of overdensities, arising from stars distributed around the orbit of a current or former satellite, or else a tidal distortion of the host galaxy. In cases where a host galaxy interacts with a companion of comparable mass (typically referred to as a major merger), both may be severely distorted. Our sample contains very few of these non-equilibrium systems, which we exclude from further consideration.
In Sect. 2 we describe our sample selection and image post-processing technique. Section 3 presents our results, including the discovery of several new streams and a list of tidal feature candidates for follow-up observations. Section 4 discusses these results and directions for future work. The tables referenced throughout the paper are presented in Appendix A.
2 Data
The aim of this work is to compile a catalog of diffuse overdensities to a known, uniform limiting depth around an approximately volume- and mass-limited sample of host galaxies. This will allow us to constrain the rate of occurrence of tidal debris at the present day and hence (in future work) to test predictions for the frequency and effects of low-redshift minor mergers in galaxy formation models. This section describes how we used the Spitzer Survey of Stellar Structure in Galaxies (S4 G, Sheth et al. 2010; Querejeta et al. 2015) to select such a sample of host galaxies, and how we processed the SDSS imaging data for these galaxies in order to search for diffuse overdensities.
2.1 Sample
The S4G is a volume-, magnitude-, and size-limited (d < 40 Mpc, |b| > 30°,  , and D25 > 1′) survey of 2352 galaxies using the Infrared Array Camera (IRAC, Fazio et al. 2004) of the Spitzer Space Telescope (Werner et al. 2004) at 3.6 and 4.5 μm. The azimuthally averaged surface brightness profiles obtained by S4 G are typically robust to isophotes at μ3.6 μm(AB) ~ 27 mag arcsec−2, equivalent to a stellar mass surfacedensity of about 1 M⊙ pc−2 (Muñoz-Mateos et al. 2015). S4G thus provides an appropriate data set for the study of the distribution of stellar mass and structure in the local Universe, and it is complete for galaxies within the volume relevant to our work and for masses greater than 109.2 M⊙, allowing us to select a statistically representative sample of galaxies whose stellar masses have been measured in a uniform manner.
Our work focuses on the frequency of tidal features around galaxies at and above the stellar mass of the Milky Way, because contemporary cosmological volume simulations can readily resolve these galaxies and their brighter satellites, which give rise to the most conspicuous features. We therefore selected elliptical, spiral, and S0 galaxies (according to the morphological type code T given by S4 G) with a lower stellar mass limit of 1010 M⊙ in the S4G catalog. Constraining the sample in stellar mass limits bias when comparing with simulations, because samples can be selected using equivalent criteria in both. We excluded any galaxies in the region of the Virgo cluster from our parent sample, as defined by the Next Generation Virgo Cluster Survey (NGVS) footprint (Muñoz et al. 2014), in both projected position and line-of-sight distance (15 < dL.O.S. (Mpc) < 18). The study of diffuse circumgalactic structure in dense environments such as Virgo is complicated by additional tidal forces of the cluster potential acting on the host and its satellites. Virgo is a “rare” system in the context of the volume we study here, and excluding it allowed us to better represent the statistics of lower-mass groups and isolated galaxies. Clusters of mass comparable to Virgo (~ 1014 M⊙) can easily be identified in simulations, so this does not compromise a straightforward model-data comparison. Moreover, 17 known major mergers were removed from the final sample1. We note that S4 G already excludes targets at low Galactic latitudes (|b| < 30°), which is appropriate for our purposes because the detection of features with low surface brightness is severely limited by the presence of extended Galactic cirrus, high extinction, and stellar crowding. Finally, since we used SDSS imaging, we also excluded S4 G galaxies outside the SDSS footprint.
We processed the SDSS images of the targets selected from S4 G in two individually volume-complete chunks to obtain samples that were feasible for the observing time constraints on follow-up observations of the robotic telescope network used in the STSS, which prioritizes more nearby galaxies. In this first paper we present the results for a Local Volume sub-sample (galaxies selected with a recession velocity lower than 2000 km s−1), comprising a total of 297 galaxies. Figure 1 shows the distribution of the parent sample across the sky in celestial coordinates. As shown later, the distance distribution peaks around 20 Mpc, roughly at the boundary of the Local Volume (Karachentsev & Kashibadze 2006). The stellar mass distribution of the sample is limited to the mass range 1010−11 M⊙, which follows directly from our selection function. Both mass and distance measurements were taken directly from the S4 G catalog. Later figures (Sect. 3) show the sample distribution morphologically and in inclination angle as well.
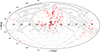 |
Fig. 1 Aitoff projection of the full S4G catalog (empty and filled red circles). The filled red circles mark our selected parent galaxy sample. The dashed lines enclose the Galactic plane area, the solid gray line encompasses the SDSS DR10 footprint, and the solid gray region encompasses the Virgo Cluster area as defined by the NGVS. |
2.2 SDSS data handling and imaging processing
We used SDSS imaging of the target galaxies selected from S4 G in order to search for faint features in their surroundings. The SDSS imaging camera worked in drift-scan mode, opening its shutter for extendedperiods and imaging a continuous strip of the sky (Gunn et al. 1998). This means that, while not very deep, the SDSS imaging survey was able to deliver data with consistently low systematic variations from field to field and excellent flat-fielding. These conditions are critical when searching for extended, diffuse-light features close to the detection limit. The SDSS imaging data also lie in the optical range and have better angular resolution than those of S4 G, which is why the latter was used to select the sample, but not for the discovery of stellar substructures. See Laine et al. (2014) for a comprehensive survey of faint structures in the S4G images.
For each of the 297 target galaxies selected from S4G, we downloaded and reprocessed the available SDSS DR10 imaging archive data. We followed the procedure described by Miskolcziet al. (2011). This consists of four steps: (1) mosaicing of the SDSS images in each bandpass; (2) stacking images in multiple bands to improve the signal-to-noise ratio (S/N), with no weighting applied; (3) two-stage source extraction, including removal of point sources; and (4) Gaussian filtering to enhance features on the scale of interest.
Square mosaics of 30 arcmin (4595 pixels) per side were created in three filters, g, r, and i, using the automatic script in the SDSS Science Archive Server that can be found online2 (at 20 Mpc, 30 arcmin corresponds to approximately 176 kpc). We used these three filters because they have the highest reported sensitivity, and because their combined transmission curve closely resembles the luminance filters used by other observational works, such as Martínez-Delgado et al. (2010). The mosaics of each filter were then stacked using the IRAF task imcombine with the default parameters, in order to improve the S/N of the image. We call this stacked image Igri.
Our analysis relies heavily on visual inspection of extended, diffuse features in moderately crowded stellar fields. We therefore processed the stacked images with SExtractor (Bertin & Arnouts 1996) using a two-stage procedure (known as “hot and cold run”, Caldwell et al. 2008) in order to remove the majorityof unsaturated point sources while preserving regions of diffuse emission. In Step 1, we extracted all sources covering an area of at least 5 pixels at a significance of 1.5σ and saved a FITS file, I5, containing these detections (including the central galaxy, which covers a significant fraction of the image). In the second run, the minimum source area was set to 800 pixels (≈30 kpc2 at 20 Mpc), so that onlythe central galaxy and any other large objects were detected. We call the corresponding FITS file I800. A final image was then created by subtracting I800 from I5, that is, the large-scale source(s) from the total detections. The image resulting from this operation contains only compact sources (mainly stars). We call this image file Is = I5 − I800. Using the IRAF task imarith, the sources previously extracted were subtracted from the original stacked image, that is, I*= Igri − Is. Thus, I* is a stacked image with most of the stars in the field masked out, replaced by the average flux of the neighboring pixels.
To enhance the visibility of faint, extended features, we then applied a circularly symmetric Gaussian filter to I*. Miskolcziet al. (2011) reported that other possible filter types are available in IRAF, including adaptive and hfilter, which are both based on the Haar-Transform (Fritze et al. 1977). By testing these filters with different settings, they reported that while both are able to enhance faint features, neither is clearly an improvement over Gaussian filtering. A Gaussian filter is then preferred because it is computationally more efficient than other filters. By experimenting with the parameters of the Gaussian filter, they also reported that the best enhancement of faint extended features is achieved with a kernel scale of σ = 7. We have carried out our own tests and reached similar conclusions, finding that the best compromise between enhancing diffuse structures and preserving image resolution can be found at a σ of 5–7 pixels, which at a distance of 20 Mpc corresponds to roughly 2–3 kpc. This works because the diffuse features of interest in this study have scales of a few kiloparsecs, therefore removing fluctuations on smaller scales makes them easier to detect by visual inspection. Convolutions with broader kernels take longer to compute without achieving higher detectability. Figure 2 shows an example of the use of this enhancement technique to reveal the giant shell around NGC 4414. Whenever possible, we have added color insets of the central galaxies to the stretched images in order to visualize the relative extent of each galaxy and its low surface brightness halo.
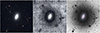 |
Fig. 2 Example of the enhancement technique described in Sect. 2.2 for NGC 4414. The field of view for each panel is ~30 × 30 arcmin (north is up, east to the left). Left panel: Original SDSS color-composite image from the public archive. Middle panel: Final resultof our image processing with an inverted, stretched grayscale showing the extent of a conspicuous shell of debris southwest of the central galaxy. For illustrative purposes, we have added a color inset of the disk of the galaxy and any stars or other objects that are masked in our analysis. Right panel: Same field taken from the STSS (Martinez-Delgado et al., in prep.), showing the same overall morphology of this substructure. Credit right panel image: Adam Block. |
2.3 Photometric calibration and distribution of the surface brightness limit
An important issue for this work is to quantify the depth to which SDSS data allow us to explore faint stellar halo structures. In addition, the mean surface brightness limits of our images must have a narrow distribution to avoid image-to-image variance biasing any statistics we derive from visual inspection. Since the SDSS data were taken over a period of several years, we have to verify that the surface brightness limits of the images of different galaxies do not reflect variations in the quality of flat-fielding and the sky conditions during the observations, such as transparency and lunar phase (we note that SDSS generally observed in dark sky conditions; e.g., Eisenstein et al. 2011; York et al. 2000; Gunn et al. 2006). Scattered light due to bright stars in the vicinity of a galaxy will also contribute to fluctuations in depth. Large differences in seeing, depth, and the variance of depth across the image can lead to an important bias in the statistics of faint overdensities in our galaxy sample, since in some cases, non-detections of streams could be due to observational effects.
To quantify this, we measured the surface brightness limit of each image in our sample as follows. First, we performed a photometric calibration to the SDSS r band for the coadded images, using the same approach as our previous studies of stellar tidal streams (Chonis et al. 2011) and dwarf satellite galaxy populations (Javanmardi et al. 2016). We chose the SDSS r band to be consistent with other optical studies. All 297 processed images were calibrated using the semi-automatic pipeline developed (and successfully demonstrated) by the DGSAT3 project (Javanmardi et al. 2016).
Given the similarity between the effective bandpass of the stacked SDSS images and the wide-band luminance filter (used in the DGSAT), the calibration of our stacked images to the r band requires a color correction, taking the form
 (1)
(1)
where rcal is the calibrated r magnitude, ℓstacked is the magnitude measured in the “pseudo-luminance” band of the stacked image, c0 fixes the linear relation between these two magnitudes, c1 corrects for a color dependence, and c2 is the magnitude zero-point correction. The constants ci are obtained using a set of calibrating stars in each image. These stars are selected using an automated statistical approach (rather than by hand), using the SDSS g and r band as standard magnitudes.
First, SExtractor (Bertin & Arnouts 1996) was used to detect all the objects in each image. The detected objects were then cross-matched with the most recent SDSS photometric catalog, and only stars with r ≥ 15, 0.08 < (r − i) < 0.5 and 0.2 < (g − r) < 1.4 passed on to the next step (see Chonis & Gaskell 2008). At this point, very many stars are available for calibration of each image. The SDSS r-band magnitudes of the stars were compared iteratively to rcal calculated from each image and the ci for each stacked image obtained by a χ2 minimization.
Next, any star with Δr ≡ rSDSS − rcal deviating by more than twice the standard deviation σ from the best-fit relation was discarded and the calibration relation was fit again to obtain new ci. This clipping was repeated until no 2σ outlier remained, which gave us the final ci for each image. The standard deviation of Δr provides an estimate of the uncertainty in the calibration and is added in quadrature when we report the uncertainty in magnitudes for each image. See Javanmardi et al. (2016) for further details of this approach to photometric calibration.
After calibrating the data set to the SDSS r band, the limiting surface brightnesses of our images were determined following the approach described in Martínez-Delgado et al. (2010). In short, to estimate the (residual) sky background, we measured the standard deviation in random sky apertures of 3 arcsec in diameter and computed the surface brightness corresponding to five times the standard deviation. Figure 3 displays the distribution of the surface brightness limit of all images in our sample due to the mean sky background, showing that the data used in this work are sufficiently homogeneous in terms of quality and depth. We conclude that the mean sky surface brightness limit of our sample in the r band is SBr,lim ≈ 28.1 ± 0.3 mag∕arcsec2. This means that for the purposes of the following analysis, we can neglect variations in depth as a significant source of bias in the statistics of low surface brightness features recovered by our visual inspection.
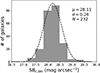 |
Fig. 3 Distribution of the surface brightness limit in our sample with a Gaussian fit, using the 232 images in the sample with Nstar > 50 stars after the σ clipping as described in Sect. 2.3. We obtained an average value of 28.11, with a standard deviation of 0.26. |
2.4 Deeper follow-up of tidal feature candidates
Although our processed SDSS images reach a surface brightness limit in the r band (SBr,lim) that would conventionally be considered “deep”, they are still only deep enough to reveal the brightest structures (if any) in the halos of our target galaxies. In some cases, the low S/N detection of a particular feature and artifacts in the image significantly reduce our confidence in the nature of the detection and/or its interpretation as a signature of tidal disruption. Better (i.e., deeper) data are necessary to improve confidence in these detections.
Figure 4 shows some examples of different types of overdensities found in our search. These illustrate cases in which it is ambiguous whether well-detected overdensities are the result of minor mergers or perturbations of the central galaxy, such as extended stellar warps (e.g., NGC 5506), rings (e.g., NGC 2859) or other tidal distortions (e.g., Trujillo et al. 2009). Significant sky background fluctuations or extended Galactic cirrus (e.g., NGC 7497) are also a well-known problem for the detection of tidal streams (e.g., Duc et al. 2015). Finally, NGC 3489 is a clear example of a typical artifact in the SDSS images, a reflection from a bright star that resembles a diffuse satellite interacting with the central galaxy.
We have explored the availability of deep images for our stream candidates in two separate sources of additional optical data described below. Unfortunately, these additional surveys currently cover a smaller sky area and have fewer bandpasses than the SDSS, and hence are not suitable for the statistical analysis we attempt with SDSS data in this paper.
2.4.1 Stellar Tidal Stream Survey
Figure 5 shows a comparison of our results to the ultra-deep observations of the STSS (Martínez-Delgado et al. 2010)for a set of well-known diffuse features. As found by Miskolczi et al. (2011), the filtering technique we used renders visible in SDSS images the majority of features reported so far by the robotic amateur telescope observations in the STSS pilot survey, although with a lower S/N because of the brighter surface brightness limit of the SDSS. The lower quality of our SDSS data compared to those of Martínez-Delgado et al. (2010) is mainly explained by the short effective exposure times of the individual broadband SDSS observations. This complicates the classification of very faint overdensities, since the lower S/N makes it harder to distinguish actual tidal features from overdensities related to Galactic cirrus or image artifacts. Deeper follow-up observations are necessary to classify these ambiguous detections.
Figure 6 illustrates the benefits of deeper follow-up with observations like those of the STSS for three galaxies in our sample. The first column presents NGC 7743, a galaxy with an apparently clear stellar tidal stream candidate in its outskirts; however, with STSS observations this feature is shown to be (at least predominantly) Galactic cirrus. The second column presents NGC 5750, which shows a remarkable irregular substructure apparently emerging from its disk; deeper STSS observationsreveal an additional overdensity on the other side of the galaxy, which is only barely visible at the detection limit of our SDSS images. Finally, the third column presents NGC 3041, in which an arc-like feature is apparent to the north of the galaxy. The amateur telescope data strongly support the interpretation of this feature as a great-circle stream.
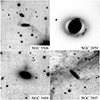 |
Fig. 4 Examples of very faint diffuse overdensities of different types found during our analysis: (i) giant stellar warps of a galactic disk(NGC 5506); (ii) a stellar ring with two seemingly interacting, partially disrupted cores embedded in it (NGC 2859); (iii) an image artifact resembling a giant satellite (NGC 3489); and (iv) extensive Galactic cirrus around NGC 7497. All these images have been processed with our technique, adapted from Miskolczi et al. (2011), using stacked SDSS g, r, an i band images, with a field of view of 30 arcmin. North is up, east to the left. |
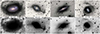 |
Fig. 5 Comparison between our processed SDSS images and the deep images from the STSS (see Sect. 2.4.1) for the spiral galaxies (from left to right) NGC 5055, NGC 4651, NGC 1055, and NGC 1084. Top row: Images taken from Martínez-Delgado et al. (2010). Bottom row: This work, using SDSS data, after processing as described in Miskolczi et al. (2011), stacking g-, r-, and i-band images. Even at the shallower depth reached by the SDSS, high-confidence detections can be made with our technique. North is up, east to the left. |
2.4.2 Dark Energy Camera Legacy Survey
We have also searched for images of galaxies with visible low surface brightness features (Table A.1) in the optical images from the third data release (DR3) of the Dark Energy Camera Legacy Survey (DECaLS; Blum et al. 2016). This survey uses the Dark Energy Camera (DECam), a wide-field CCD imager at the CTIO Blanco 4 m telescope, to obtain optical imaging covering 14 000 deg2 in three optical bands (g, r, z). Since the footprint is mostly in the equatorial and southern sky and only a fraction of the DECaLS data have been publicly released, only a few targets have been imaged with sufficient quality and depth to aid in the interpretation of our SDSS images. In the publicly available DECaLS data, we found that three of our targets were imaged in the g, r, and z bands, confirming the detected streams or diffuse-light substructure in the halo from our analysis. Although some sky regions have been imaged in just one DECaLS band so far, we are able to improve our confidence in some low surface brightness features with even these data (see Sect. 3.3). Regarding background subtraction around large objects, it must also be noted that the DECaLS data reduction for large sources has not yet been optimized to the same extent as in the SDSS (Blanton et al. 2011). This explains the rectangular patches in DECaLS images with poor subtraction around large galaxies, which sometimes mimic diffuse galactic structure.
3 Results
3.1 Confidence of detections and morphologies
For all of the galaxies listed in Table A.1, we estimated our confidence in the detection of faint tidal features on a five-point scale, similar to the scheme used by Atkinson et al. (2013). We refer to it as the detection confidence level (DCL), reflecting our certainty that a tidal feature with low surface brightness that is associated with the target galaxy was detected in an image, as follows:
- 0:
No detection of any sort, or high confidence that any candidates are perturbations of the central object (spiral arms, cirrus, etc.).
- 1:
Very uncertain detection of a feature at a S/N too low to judge either the quality of the detection or its tidal nature.
- 2:
Possible detection of a low surface brightness feature, but with low confidence in a tidal origin (~ 50% certain).
- 3:
Strong detection judged highly likely to be of tidal origin, but without support from any data other than our own.
- 4:
Strong detection where a tidal origin is supported by other data.
In the same table, we also provide an approximate visual classification system for the morphology of the most common features we detect using the following categories, which are not mutually exclusive:
- S
for classic shells. Disconnected, coherent arcs of material usually concentric with the central galaxy.
- C
for any coherent, curvilinear features seen in the image (that are not shells). This includes arcs, plumes of debris, and looped structures of gas or stars surrounding their host.
- Sph
for spheroids and diffuse satellites in the process of disruption, suggestive of very low surface brightness galaxies.
- E
for extensions of the central galaxy, including but not limited to warps and spiral arms, and some unclassifiable overdensities clearly connected to the disk.
- O
for any other less common type of features not included above, but suggestive of tidal interactions: fuzzy clouds, spikes, wedges, irregular filaments, etc.
These categories are intended as an simple indication of the appearance of the features we detect. Stronger conclusions about the true physical nature of these features are beyond the scope of this work, and in most cases would require support from techniques other than photometry.
3.2 Sample statistics
By visual inspection of the processed images, we determine that 51 of the 297 galaxies in our sample show either clear or potential signatures of diffuse overdensities in their outskirts above our surface brightness limit (28.1 mag arcsec−2). Table A.1 describe these galaxies and their associated low-surface-brightness features. Of these 51 targets, 28 show overdensities that we judge to be either stellar or gaseous tidal features on the basis of other, deeper observations. A further 23 objects for which we currently lack deeper observations show overdensities that are likely tidal feature candidates (listed in Table A.1 as features with DCL 1 and 2; see Sect. 3.1). Hence a conservative estimate for the frequency with which such features occur in our volume- and mass-limited sample of the local Universe is ≈ 9%. This would rise to ≈17% if all candidates were confirmed by deeper follow-up observations. Considering only previously published features together with the new discoveries reported in this paper, we estimate that ≈ 14% of galaxies in the local Universe exhibit diffuse tidal features brighter than 28.1 mag arcsec−2 in the SDSS r band. As a reference, all galaxies in our sample that do not show any evidence of diffuse-light structures are listed in Table A.2.
Figure 7 shows histograms of our galaxy samples, including the parent sample and subsets of targets that show evidence of tidal streams4. Furthermore, it shows that above the surface brightness limit of our sample there are no significant selection effects arising from either morphology or inclination angle, consistent with a roughly isotropic distribution of features. There are some hints of an excess of low surface brightness features at short distance and high stellar mass. The latter is compatible with the expectation of Λ CDM, where more massive galaxies are hosted by more massive DM haloes and are therefore more likely to accrete brighter satellites. Any selection effect with distance is likely to reflect the balance between this effect (large volumes include more bright galaxies) and the increasing difficulty of detecting low surface brightness substructures at larger distances.
We also computed a two-sample Kolmogorov–Smirnov (KS) test to provide a quantitative comparison between the distance, mass, morphology, and inclination angle distributions of the 297 galaxies in our parent sample and those of the hosts of high-confidence tidal feature candidates from Table A.1 (this means a DCL equal to 3 or 4, i.e., a comparison of the black and solid green histograms in Fig. 7). The p-values obtained are shown in Table 1. At a significance of p = 0.05, on the basis of any one of these four distributions, we cannot reject the null hypothesis that our sample of galaxies with overdensities is drawn from the same underlying population as the parent sample we selected from S4 G. In other words, random sampling from our parent sample has a high probability of yielding distributions similar to those of our sample of galaxies with overdensities.
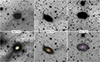 |
Fig. 6 Examples of some follow-up images used to confirm stellar tidal stream candidates in our sample. The top row shows the SDSS g–r–i stacked images for NGC 7743, NGC 5750, and NGC 3041 (see Sect. 3) processed as described in Sect. 2, and kindly provided by A. Miskolczi. The bottom row shows the deep images obtained by the STSS (Martínez-Delgado et al., in prep.) for the same objects, but with a luminance filter. In all cases, the deeper images detect additional features or reveal a more detailed morphology of the features detected in the SDSS images. |
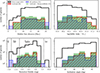 |
Fig. 7 Histograms of the diffuse-light features found in our whole sample, with or without overdensities, as a function of target distance, stellar mass, morphology and inclination angle. The distribution of all 297 galaxies in our sample is shown in black, while histograms in color correspond to the galaxies listed in Table A.1, our main results. The red distributions represent 28 confirmed features, previously known and new (with a DCL of 4; see Sect. 3.1). Unconfirmed feature candidates (with a DCL of 1 and 2) are represented by blue dotted histograms. Confirmed streams and strong candidates (i.e., every feature with a DLC of 3 or 4) are grouped together in the solid green histogram (41 targets). For our limiting sky surface brightness of 28.1 ± 0.3 mag arcsec−2, this implies that ≈14% of the galaxies in the mass and volume limits our parent sample have detectable stellar overdensities in their outskirts. No significant biases are apparent in our sample of galaxies with diffuse overdensities (with respect to the S4G parent sample, black solid line) except for a somewhat flatter distribution of stellar mass and the lack of overdensities for galaxies more distant than 35 Mpc. |
3.3 Confirmed stellar structures with low surface brightness
Table A.1 lists, among others, the 28 tidal streams that we have confirmed. This list contains 12 unpublished detections, including those found recently in the STSS (Martinez-Delgado et al., in prep.). Figure 8 shows the corresponding images for each of their 12 host galaxies. In these images, the disks of galaxies tend to dominate the field of view because the images have been significantly contrast-stretched to render the low surface brightness structures visible. These new streams are briefly described below. The estimated physical extent of these substructures has been calculated assuming the distance to the target taken from the NASA/IPAC Extragalactic Database (NED). It must be noted that the NED uses the mean value of redshift-independent distances. When no mean distance is reported, the Hubble flow distance is used instead.
NGC 681 is an edge-on disk galaxy with a prominent spheroid surrounded by two clear shells along the major axis, extending to R = 25 kpc southwest and R = 39 kpc northeast. Other possible arc-like features (concentric around the galaxy R = 10 kpc to the south and extending northeast from the south edge of image) are not apparent in DECaLS images (see Fig. 10).
NGC 2775 is an unbarred spiral galaxy showing a prominent ~ 29 kpc cloudy structure in its halo, reminiscent of a classical shell from Martínez-Delgado et al. (2010).
NGC 3041 shows an arc-like stream with an extent along its longest dimension of ~ 4 kpc, northeast of the central galaxy. STSS and DECaLS data (Fig. 6) show this feature clearly, but they do not reveal any further detail. This may be the brighter part of a great circle structure similar to the Milky Way Sagittarius stream, but no surviving progenitor is apparent.
NGC 3049 shows an arc-like feature east of the central galaxy, with a size of ~ 3 kpc. Another very diffuse substructure can be identified to the west, suggestive of a shell formed by tidal disruption. More definitive statements require deeper observations.
NGC 3611 is well known for the peculiar ~30 kpc bright off-center ring-like structure previously noted by Schweizer & Seitzer (1990). These authors favored merging as the origin of this feature, excluding the possibility of a disturbed polar ring. DECaLS data (Fig. 10) show two distinct features: a clear umbrella-like stream with shells on both sides of the galaxy (the most prominent to the east), and an incomplete blue ring or arc encircling the disk. The colors of both structures are clearly different, and it is unclear whether they have a common origin (e.g., the tidal disruption of a Magellanic-type dwarf galaxy).
NGC 3631 shows a giant cloud at a galactocentric distance of ~ 19 kpc. This is very similar to the M83 stream (Malin & Hadley 1997). It is not clear whether the structure is part of a very faint outer disk or a tidal structure in the galactic halo. This overdensity has also been observed by the STSS (Martinez-Delgado et al., in prep.), indicating that it is not an artifact in the SDSS image.
NGC 3682 shows two classical shells on both sides of the central galaxy, with diameters of ~ 2 kpc.
NGC 4203 shows a bright, partially disrupted and nucleated satellite southwest of the galaxy, with both a leading and a trailing tail of total length ~13 kpc.
NGC 4569 is a spiral galaxy with a dIrr satellite (IC 3583) to the north, with an apparent interaction between the two5. There is evidence of a shell-like overdensity on the northern side of the galaxy, although we cannot reject the possibility that this is an extended warp of the stellar disk.
NGC 4643 shows a clear stellar tidal stream apparently perpendicular to the plane of the galaxy. DECaLS data show evidence for a progenitor in the northern tail. Assuming that both structures apparent in the image are part of the same feature (for example, an arc viewed edge-on), this feature has an extent of ~ 73 kpc. Whitmore et al. (1990) reported an inner, edge-on arc structure in the main body of the galaxy that is also visible in our images, but not related to the giant tidal structure we report here.
NGC 5750 Both images from our analysis and the STSS deeper images (see Fig. 6) show a truncated overdensity west of the central galaxy, which resembles a faint, distorted satellite galaxy. In addition, an elongated, irregular feature east of the disk (clearly visible in the STSS image) could be part of a tidal stream associated with that satellite.
NGC 7742 is a face-on unbarred Seyfert spiral galaxy, which shows three very distinct stellar arcs, possibly sections of a shell (or shells), each 16–17 kpc in diameter.
NGC 7743 is a barred Seyfert spiral galaxy showing a giant, 18 kpc loop structure to the northeast. Galactic dust clouds dominate the field of view in longer exposures, as shown in the first column of Fig. 6.
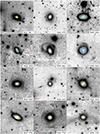 |
Fig. 8 Confirmed tidal streams from Table A.1 detected by stacking g–r–i SDSS bandsas described in this work. Streams already reported in previous publications are not included. The red lines indicate a scale of 3 arcmin. In some cases, blue arrows indicate structures of interest described in Sect. 3.3. North is up and east to the left. |
3.4 Tidal stream candidates for follow-up studies
Table A.1 lists the galaxies of our sample with detected structures for which a tidal origin cannot be confirmed in this work because we lack deeper data; 23 in total, with a DCL equal to 1 or 2. Follow-up observations of these galaxies are currently being carried out by the STSS and will be published in a forthcoming companion contribution (Martínez-Delgado et al., in prep.). These signatures define those that are very probably stellar tidal streams, that is, tracing orbits of satellites in the tidal field of the host galaxy, and features that are probably linked to disk warping, polar rings, and other types of signatures. In general, any features more likely related to galactic perturbations of the central galaxy disk due to dynamical interaction with other massive galaxies were tagged accordingly. Some examples of these structures of different types are displayed in Fig. 9. Figure 10 shows the images used to confirm the faint tidal debris detected around six of the galaxies listed in Table A.1.
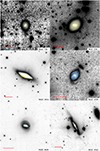 |
Fig. 9 Selection of the diffuse-light features detected around some of the galaxies listed in Table A.1. Deeper data are needed to confirm their origin (tidal streams, galactic perturbations, extended spiral arms, etc.). The red lines indicate a scale of 3 arcmin. North is up and east to the left. |
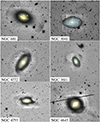 |
Fig. 10 Images taken from DECaLS public survey, confirming some of our findings. See Fig. 8 for more information.A color inset of the disk of each galaxy taken from this survey has been included as reference. |
4 Conclusions
We have estimated the frequency of stellar tidal streams in the halos of massive galaxies in the local Universe by processing SDSS images to reveal low surface brightness features, using a technique similar to that of Miskolczi et al. (2011). Our results are summarized in Table A.1. To facilitate statistical comparisons with cosmological simulations of galaxy formation, we have defined a volume-, mass-, and size-limited parent sample of galaxies with stellar masses similar to that of the Milky Way based on the S4 G catalog. From the 2331 galaxies listed by S4G, our sampleselects 297 targets from the SDSS footprint (excluding low Galactic latitudes, major mergers, and the Virgo cluster). We estimate that the typical surface brightness limit of the SDSS images for these galaxies (after stacking their g, r, and i band images) is 28.1 ± 0.3 mag arcsec−2.
By visual inspection, we detected a total of 28 confirmed tidal streams, including new features discovered in this study and some previously known tidal streams. Therefore, our most conservative estimate is that 9% of the galaxies in our sample show evidence of diffuse features that may be linked to minor merging events (either stellar or gaseous streams, or a mixture of both). This fraction of galaxies displaying tidal features does not include the possible new, but unconfirmed detections listed in Table A.1. When we also count the systems with high-confidence detections (i.e., with a DCL of 3 or 4), the frequency of tidal features in our sample rises to 14%. It is important to remark that some of these diffuse-light features may not be the signature of dwarf satellite remnants, but instead Galactic cirrus, imaging artifacts, or distorted spiral arms. This underscores the importance of deeper observations to confirm the nature of these features (see Fig. 4).
These results are broadly consistent with comparable studies cited in Sect. 1, in particular those listed in Table 1 from Atkinson et al. (2013). Although the surface brightness limits of the observations used in these earlier studies are more or less compatible, the wide variety of sample selections limits a more detailed comparison of the final results. Bright tidal features are expected to be relatively more likely in ETGs, while the only analogous study for disk galaxies (Miskolczi et al. 2011) was also less statistically representative of the galaxy population because it was focused on testing the image processing method. Comparisons with simulations are still needed, and will be reported elsewhere.
Last, because our procedure for enhancing images to detect low surface brightness features relies on stacking images in multiple filters and because those features have an intrinsically low S/N, we cannot measure their colors. To do so, deeper multi-band imaging is needed, and will be valuable to constrain stellar populations and masses of the merging systems. Discussion of the physical properties of the features we detected and their comparison to the newest simulations is beyond the scope of this article. These topics will be addressed in a forthcoming paper.
Acknowledgements
G. M. thanks Arpad Miskolczi for the image processing training and the SDSS images showed in Fig. 6, and the Astronomisches Institut der Ruhr-Universitat Bochum for their hospitality during his visit. G. M. also thanks Gabriel Torrealba for his help in mapping the SDSS DR10 footprint, and Néstor Espinoza for his comments on the statistics of the sample. D. M. D. thanks the team of astrophotographers from the STSS: MarkHanson, Adam Block and Ken Crawford for their images shown in this work; Giuseppe Donatiello for his help with the presentation of some figures; and Seppo Laine for his help with the target selection and comments. A. P. C. acknowledges the support of STFC Grant ST/P000541/1. We also thank the anonymous referee for their constructive comments in the revision stage. The authors acknowledge the use of the Spitzer Survey of Stellar Structure in Galaxies and the Dark Energy Camera Legacy Survey as a core part of this work. The authorsalso acknowledge the use of IRAF, the Image Reduction and Analysis Facility, a general purpose software system for the reduction and analysis of astronomical data. IRAF is written and supported by the National Optical Astronomy Observatories (NOAO) in Tucson, Arizona. NOAO is operated by the Association of Universities for Research in Astronomy (AURA), Inc. under cooperative agreement with the National Science Foundation. Funding for SDSS-III has been provided by the Alfred P. Sloan Foundation, the Participating Institutions, the National Science Foundation, and the U.S. Department of Energy Office of Science. This work made use of the following Python 3 libraries: Matplotlib (Hunter 2007), SciPy (Jones et al. 2001), NumPy. This research also made use of Astropy, a community-developed core Python package for Astronomy (Astropy Collaboration 2013).
Appendix A: Supplementary tables
Tidal streams found in this work, including previously known features and new discoveries (28 host galaxies), with detection confidence levels (DCL) 3 and 4.
Galaxies with no evidence of observable diffuse overdensities in our sample of 297 galaxies.
References
- Abadi, M. G., Navarro, J. F., & Steinmetz, M. 2006, MNRAS, 365, 747 [NASA ADS] [CrossRef] [Google Scholar]
- Abazajian, K. N., Adelman-McCarthy, J. K., Agüeros, M. A., et al. 2009, ApJS, 182, 543 [NASA ADS] [CrossRef] [Google Scholar]
- Ahn, C. P., Alexandroff, R., Allende Prieto, C., et al. 2014, ApJS, 211, 17 [NASA ADS] [CrossRef] [Google Scholar]
- Amorisco, N. C. 2017a, MNRAS, 464, 2882 [NASA ADS] [CrossRef] [Google Scholar]
- Amorisco, N. C. 2017b, MNRAS, 469, L48 [NASA ADS] [CrossRef] [Google Scholar]
- Astropy Collaboration, Robitaille, T. P., Tollerud, E. J., et al. 2013, A&A, 558, A33 [NASA ADS] [CrossRef] [EDP Sciences] [Google Scholar]
- Atkinson, A. M., Abraham, R. G., & Ferguson, A. M. N. 2013, ApJ, 765, 28 [NASA ADS] [CrossRef] [Google Scholar]
- Bertin, E., & Arnouts, S. 1996, A&AS, 117, 393 [NASA ADS] [CrossRef] [EDP Sciences] [Google Scholar]
- Blanton, M. R., Kazin, E., Muna, D., Weaver, B. A., & Price-Whelan, A. 2011, AJ, 142, 31 [NASA ADS] [CrossRef] [Google Scholar]
- Blum, R. D., Burleigh, K., Dey, A., et al. 2016, AAS Meeting Abstracts, 228, 317.01 [Google Scholar]
- Blumenthal, G. R., Faber, S. M., Primack, J. R., & Rees, M. J. 1984, Nature, 311, 517 [NASA ADS] [CrossRef] [Google Scholar]
- Boselli, A., Cuillandre, J. C., Fossati, M., et al. 2016, A&A, 587, A68 [NASA ADS] [CrossRef] [EDP Sciences] [Google Scholar]
- Brodie, J. P., Romanowsky, A. J., Strader, J., et al. 2014, ApJ, 796, 52 [NASA ADS] [CrossRef] [Google Scholar]
- Bullock, J. S., & Johnston, K. V. 2005, ApJ, 635, 931 [NASA ADS] [CrossRef] [Google Scholar]
- Bullock, J. S., Kolatt, T. S., Sigad, Y., et al. 2001, MNRAS, 321, 559 [Google Scholar]
- Caldwell, J. A. R., McIntosh, D. H., Rix, H.-W., et al. 2008, ApJS, 174, 136 [NASA ADS] [CrossRef] [Google Scholar]
- Chonis, T. S., & Gaskell, C. M. 2008, AJ, 135, 264 [NASA ADS] [CrossRef] [Google Scholar]
- Chonis, T. S., Martínez-Delgado, D., Gabany, R. J., et al. 2011, AJ, 142, 166 [NASA ADS] [CrossRef] [Google Scholar]
- Cole, S., Lacey, C. G., Baugh, C. M., & Frenk, C. S. 2000, MNRAS, 319, 168 [NASA ADS] [CrossRef] [Google Scholar]
- Cooper, A. P., Cole, S., Frenk, C. S., et al. 2010, MNRAS, 406, 744 [NASA ADS] [CrossRef] [Google Scholar]
- Cooper, A. P., D’Souza, R., Kauffmann, G., et al. 2013, MNRAS, 434, 3348 [NASA ADS] [CrossRef] [Google Scholar]
- Crnojević, D., Sand, D. J., Spekkens, K., et al. 2016, ApJ, 823, 19 [NASA ADS] [CrossRef] [Google Scholar]
- Croton, D. J., Springel, V., White, S. D. M., et al. 2006, MNRAS, 365, 11 [NASA ADS] [CrossRef] [Google Scholar]
- Davis, M., Efstathiou, G., Frenk, C. S., & White, S. D. M. 1985, ApJ, 292, 371 [NASA ADS] [CrossRef] [Google Scholar]
- de Blok, W. J. G., Józsa, G. I. G., Patterson, M., et al. 2014, A&A, 566, A80 [NASA ADS] [CrossRef] [EDP Sciences] [Google Scholar]
- De Lucia, G., & Helmi, A. 2008, MNRAS, 391, 14 [NASA ADS] [CrossRef] [Google Scholar]
- D’Souza, R., Kauffman, G., Wang, J., & Vegetti, S. 2014, MNRAS, 443, 1433 [NASA ADS] [CrossRef] [Google Scholar]
- Duc, P.-A., & Renaud, F. 2013, Lecture Notes in Physics, 861, eds. J. Souchay, S. Mathis, & T. Tokieda, (Berlin: Springer Verlag), 327 [NASA ADS] [CrossRef] [Google Scholar]
- Duc, P.-A., Cuillandre, J.-C., Karabal, E., et al. 2015, MNRAS, 446, 120 [NASA ADS] [CrossRef] [Google Scholar]
- Eisenstein, D. J., Weinberg, D. H., Agol, E., et al. 2011, AJ, 142, 72 [Google Scholar]
- Fazio, G. G., Hora, J. L., Allen, L. E., et al. 2004, ApJS, 154, 10 [NASA ADS] [CrossRef] [Google Scholar]
- Font, A. S., Johnston, K. V., Bullock, J. S., & Robertson, B. E. 2006, ApJ, 638, 585 [Google Scholar]
- Fritze, K., Lange, M., Moestl, G., Oleak, H., & Richter, G. M. 1977, Astron. Nachr., 298, 189 [NASA ADS] [CrossRef] [Google Scholar]
- Gunn, J. E., Carr, M., Rockosi, C., et al. 1998, AJ, 116, 3040 [NASA ADS] [CrossRef] [Google Scholar]
- Gunn, J. E., Siegmund, W. A., Mannery, E. J., et al. 2006, AJ, 131, 2332 [NASA ADS] [CrossRef] [Google Scholar]
- Guo, Q., & White, S. D. M. 2008, MNRAS, 384, 2 [NASA ADS] [CrossRef] [Google Scholar]
- Hammer, F., Puech, M., Chemin, L., Flores, H., & Lehnert, M. D. 2007, ApJ, 662, 322 [NASA ADS] [CrossRef] [Google Scholar]
- Harmsen, B., Monachesi, A., Bell, E. F., et al. 2017, MNRAS, 466, 1491 [NASA ADS] [CrossRef] [Google Scholar]
- Haynes, M. P., Jore, K. P., Barrett, E. A., Broeils, A. H., & Murray, B. M. 2000, AJ, 120, 703 [NASA ADS] [CrossRef] [Google Scholar]
- Hunter, J. D. 2007, Comput. Sci. Eng., 9, 90 [Google Scholar]
- Ibata, R. A., Lewis, G. F., McConnachie, A. W., et al. 2014, ApJ, 780, 128 [NASA ADS] [CrossRef] [Google Scholar]
- Javanmardi, B., Martinez-Delgado, D., Kroupa, P., et al. 2016, A&A, 588, A89 [NASA ADS] [CrossRef] [EDP Sciences] [Google Scholar]
- Johnston, K. V., Sackett, P. D., & Bullock, J. S. 2001, ApJ, 557, 137 [NASA ADS] [CrossRef] [Google Scholar]
- Johnston, K. V., Bullock, J. S., Sharma, S., et al. 2008, ApJ, 689, 936 [NASA ADS] [CrossRef] [Google Scholar]
- Jones, E., Oliphant, T., Peterson, P., et al. 2001, SciPy: Open Source Scientific Tools for Python [Google Scholar]
- Karachentsev, I. D., & Kashibadze, O. G. 2006, Astrophysics, 49, 3 [NASA ADS] [CrossRef] [Google Scholar]
- Kauffmann, G., White, S. D. M., & Guiderdoni, B. 1993, MNRAS, 264, 201 [NASA ADS] [CrossRef] [Google Scholar]
- Kaviraj, S. 2010, MNRAS, 406, 382 [NASA ADS] [CrossRef] [Google Scholar]
- Lacey, C., & Cole, S. 1993, MNRAS, 262, 627 [NASA ADS] [CrossRef] [Google Scholar]
- Laine, S., Knapen, J. H., Muñoz-Mateos, J.-C., et al. 2014, MNRAS, 444, 3015 [NASA ADS] [CrossRef] [Google Scholar]
- Leaman, R., Erroz-Ferrer, S., Cisternas, M., & Knapen, J. H. 2015, MNRAS, 450, 2473 [NASA ADS] [CrossRef] [Google Scholar]
- Ludwig, J., Pasquali, A., Grebel, E. K., & Gallagher, J. S., III 2012, AJ, 144, 190 [NASA ADS] [CrossRef] [Google Scholar]
- Malin, D., & Hadley, B. 1997, PASA, 14, 52 [NASA ADS] [CrossRef] [Google Scholar]
- Martínez-Delgado, D., Peñarrubia, J., Jurić, M., Alfaro, E. J., & Ivezić, Z. 2007, ApJ, 660, 1264 [NASA ADS] [CrossRef] [Google Scholar]
- Martínez-Delgado, D., Peñarrubia, J., Gabany, R. J., et al. 2008, ApJ, 689, 184 [NASA ADS] [CrossRef] [Google Scholar]
- Martínez-Delgado, D., Pohlen, M., Gabany, R. J., et al. 2009, ApJ, 692, 955 [NASA ADS] [CrossRef] [Google Scholar]
- Martínez-Delgado, D., Gabany, R. J., Crawford, K., et al. 2010, AJ, 140, 962 [NASA ADS] [CrossRef] [Google Scholar]
- Martínez-Delgado, D., Romanowsky, A. J., Gabany, R. J., et al. 2012, ApJ, 748, L24 [NASA ADS] [CrossRef] [Google Scholar]
- Martínez-Delgado, D., D’Onghia, E., Chonis, T. S., et al. 2015, AJ, 150, 116 [NASA ADS] [CrossRef] [Google Scholar]
- McConnachie, A. W., Irwin, M. J., Ibata, R. A., et al. 2009, Nature, 461, 66 [NASA ADS] [CrossRef] [PubMed] [Google Scholar]
- Merritt, A., van Dokkum, P., Danieli, S., et al. 2016, ApJ, 833, 168 [NASA ADS] [CrossRef] [Google Scholar]
- Miskolczi, A., Bomans, D. J., & Dettmar, R.-J. 2011, A&A, 536, A66 [NASA ADS] [CrossRef] [EDP Sciences] [Google Scholar]
- Mouhcine, M., & Ibata, R. 2009, MNRAS, 399, 737 [NASA ADS] [CrossRef] [Google Scholar]
- Muñoz, R. P., Puzia, T. H., Lançon, A., et al. 2014, ApJS, 210, 4 [NASA ADS] [CrossRef] [Google Scholar]
- Muñoz-Mateos, J. C., Sheth, K., Regan, M., et al. 2015, ApJS, 219, 3 [NASA ADS] [CrossRef] [Google Scholar]
- Okamoto, S., Arimoto, N., Ferguson, A. M. N., et al. 2015, ApJ, 809, L1 [NASA ADS] [CrossRef] [Google Scholar]
- Paudel, S., & Ree, C. H. 2014, ApJ, 796, L14 [NASA ADS] [CrossRef] [Google Scholar]
- Pillepich, A., Madau, P., & Mayer, L. 2015, ApJ, 799, 184 [NASA ADS] [CrossRef] [Google Scholar]
- Press, W. H., & Schechter, P. 1974, ApJ, 187, 425 [NASA ADS] [CrossRef] [Google Scholar]
- Purcell, C. W., Bullock, J. S., & Zentner, A. R. 2007, ApJ, 666, 20 [NASA ADS] [CrossRef] [Google Scholar]
- Querejeta, M., Meidt, S. E., Schinnerer, E., et al. 2015, ApJS, 219, 5 [NASA ADS] [CrossRef] [Google Scholar]
- Rodriguez-Gomez, V., Pillepich, A., Sales, L. V., et al. 2016, MNRAS, 458, 2371 [NASA ADS] [CrossRef] [Google Scholar]
- Schaye, J., Crain, R. A., Bower, R. G., et al. 2015, MNRAS, 446, 521 [Google Scholar]
- Schweizer, F., & Seitzer, P. 1990, PASP, 102, 615 [NASA ADS] [CrossRef] [Google Scholar]
- Searle, L., & Zinn, R. 1978, ApJ, 225, 357 [NASA ADS] [CrossRef] [Google Scholar]
- Sheth, K., Regan, M., Hinz, J. L., et al. 2010, PASP, 122, 1397 [NASA ADS] [CrossRef] [Google Scholar]
- Spavone, M., Capaccioli, M., Napolitano, N. R., et al. 2017, A&A, 603, A38 [NASA ADS] [CrossRef] [EDP Sciences] [Google Scholar]
- Steiman-Cameron, T. Y., Kormendy, J., & Durisen, R. H. 1992, AJ, 104, 1339 [NASA ADS] [CrossRef] [Google Scholar]
- Thomas, G. F., Famaey, B., Ibata, R., Lüghausen, F., & Kroupa, P. 2017, A&A, 603, A65 [NASA ADS] [CrossRef] [EDP Sciences] [Google Scholar]
- Trujillo, I., Martinez-Valpuesta, I., Martínez-Delgado, D., et al. 2009, ApJ, 704, 618 [NASA ADS] [CrossRef] [Google Scholar]
- Vogelsberger, M., Genel, S., Springel, V., et al. 2014, MNRAS, 444, 1518 [NASA ADS] [CrossRef] [Google Scholar]
- Wang, M.-Y., Fattahi, A., Cooper, A. P., et al. 2017, MNRAS, 468, 4887 [NASA ADS] [CrossRef] [Google Scholar]
- Werner, M. W., Roellig, T. L., Low, F. J., et al. 2004, ApJS, 154, 1 [NASA ADS] [CrossRef] [Google Scholar]
- White, S. D. M., & Rees, M. J. 1978, MNRAS, 183, 341 [NASA ADS] [CrossRef] [Google Scholar]
- Whitmore, B. C., Lucas, R. A., McElroy, D. B., et al. 1990, AJ, 100, 1489 [NASA ADS] [CrossRef] [Google Scholar]
- York, D. G., Adelman, J., Anderson, Jr., J. E., et al. 2000, AJ, 120, 1579 [CrossRef] [Google Scholar]
- Zucker, D. B., Kniazev, A. Y., Bell, E. F., et al. 2004, ApJ, 612, L121 [NASA ADS] [CrossRef] [Google Scholar]
Although gravitational interaction has been ruled out by some authors (e.g., Boselli et al. 2016).
All Tables
Tidal streams found in this work, including previously known features and new discoveries (28 host galaxies), with detection confidence levels (DCL) 3 and 4.
Galaxies with no evidence of observable diffuse overdensities in our sample of 297 galaxies.
All Figures
|
Fig. 1 Aitoff projection of the full S4G catalog (empty and filled red circles). The filled red circles mark our selected parent galaxy sample. The dashed lines enclose the Galactic plane area, the solid gray line encompasses the SDSS DR10 footprint, and the solid gray region encompasses the Virgo Cluster area as defined by the NGVS. |
| In the text | |
|
Fig. 2 Example of the enhancement technique described in Sect. 2.2 for NGC 4414. The field of view for each panel is ~30 × 30 arcmin (north is up, east to the left). Left panel: Original SDSS color-composite image from the public archive. Middle panel: Final resultof our image processing with an inverted, stretched grayscale showing the extent of a conspicuous shell of debris southwest of the central galaxy. For illustrative purposes, we have added a color inset of the disk of the galaxy and any stars or other objects that are masked in our analysis. Right panel: Same field taken from the STSS (Martinez-Delgado et al., in prep.), showing the same overall morphology of this substructure. Credit right panel image: Adam Block. |
| In the text | |
|
Fig. 3 Distribution of the surface brightness limit in our sample with a Gaussian fit, using the 232 images in the sample with Nstar > 50 stars after the σ clipping as described in Sect. 2.3. We obtained an average value of 28.11, with a standard deviation of 0.26. |
| In the text | |
|
Fig. 4 Examples of very faint diffuse overdensities of different types found during our analysis: (i) giant stellar warps of a galactic disk(NGC 5506); (ii) a stellar ring with two seemingly interacting, partially disrupted cores embedded in it (NGC 2859); (iii) an image artifact resembling a giant satellite (NGC 3489); and (iv) extensive Galactic cirrus around NGC 7497. All these images have been processed with our technique, adapted from Miskolczi et al. (2011), using stacked SDSS g, r, an i band images, with a field of view of 30 arcmin. North is up, east to the left. |
| In the text | |
|
Fig. 5 Comparison between our processed SDSS images and the deep images from the STSS (see Sect. 2.4.1) for the spiral galaxies (from left to right) NGC 5055, NGC 4651, NGC 1055, and NGC 1084. Top row: Images taken from Martínez-Delgado et al. (2010). Bottom row: This work, using SDSS data, after processing as described in Miskolczi et al. (2011), stacking g-, r-, and i-band images. Even at the shallower depth reached by the SDSS, high-confidence detections can be made with our technique. North is up, east to the left. |
| In the text | |
|
Fig. 6 Examples of some follow-up images used to confirm stellar tidal stream candidates in our sample. The top row shows the SDSS g–r–i stacked images for NGC 7743, NGC 5750, and NGC 3041 (see Sect. 3) processed as described in Sect. 2, and kindly provided by A. Miskolczi. The bottom row shows the deep images obtained by the STSS (Martínez-Delgado et al., in prep.) for the same objects, but with a luminance filter. In all cases, the deeper images detect additional features or reveal a more detailed morphology of the features detected in the SDSS images. |
| In the text | |
|
Fig. 7 Histograms of the diffuse-light features found in our whole sample, with or without overdensities, as a function of target distance, stellar mass, morphology and inclination angle. The distribution of all 297 galaxies in our sample is shown in black, while histograms in color correspond to the galaxies listed in Table A.1, our main results. The red distributions represent 28 confirmed features, previously known and new (with a DCL of 4; see Sect. 3.1). Unconfirmed feature candidates (with a DCL of 1 and 2) are represented by blue dotted histograms. Confirmed streams and strong candidates (i.e., every feature with a DLC of 3 or 4) are grouped together in the solid green histogram (41 targets). For our limiting sky surface brightness of 28.1 ± 0.3 mag arcsec−2, this implies that ≈14% of the galaxies in the mass and volume limits our parent sample have detectable stellar overdensities in their outskirts. No significant biases are apparent in our sample of galaxies with diffuse overdensities (with respect to the S4G parent sample, black solid line) except for a somewhat flatter distribution of stellar mass and the lack of overdensities for galaxies more distant than 35 Mpc. |
| In the text | |
|
Fig. 8 Confirmed tidal streams from Table A.1 detected by stacking g–r–i SDSS bandsas described in this work. Streams already reported in previous publications are not included. The red lines indicate a scale of 3 arcmin. In some cases, blue arrows indicate structures of interest described in Sect. 3.3. North is up and east to the left. |
| In the text | |
|
Fig. 9 Selection of the diffuse-light features detected around some of the galaxies listed in Table A.1. Deeper data are needed to confirm their origin (tidal streams, galactic perturbations, extended spiral arms, etc.). The red lines indicate a scale of 3 arcmin. North is up and east to the left. |
| In the text | |
|
Fig. 10 Images taken from DECaLS public survey, confirming some of our findings. See Fig. 8 for more information.A color inset of the disk of each galaxy taken from this survey has been included as reference. |
| In the text | |
Current usage metrics show cumulative count of Article Views (full-text article views including HTML views, PDF and ePub downloads, according to the available data) and Abstracts Views on Vision4Press platform.
Data correspond to usage on the plateform after 2015. The current usage metrics is available 48-96 hours after online publication and is updated daily on week days.
Initial download of the metrics may take a while.