Fig. 7
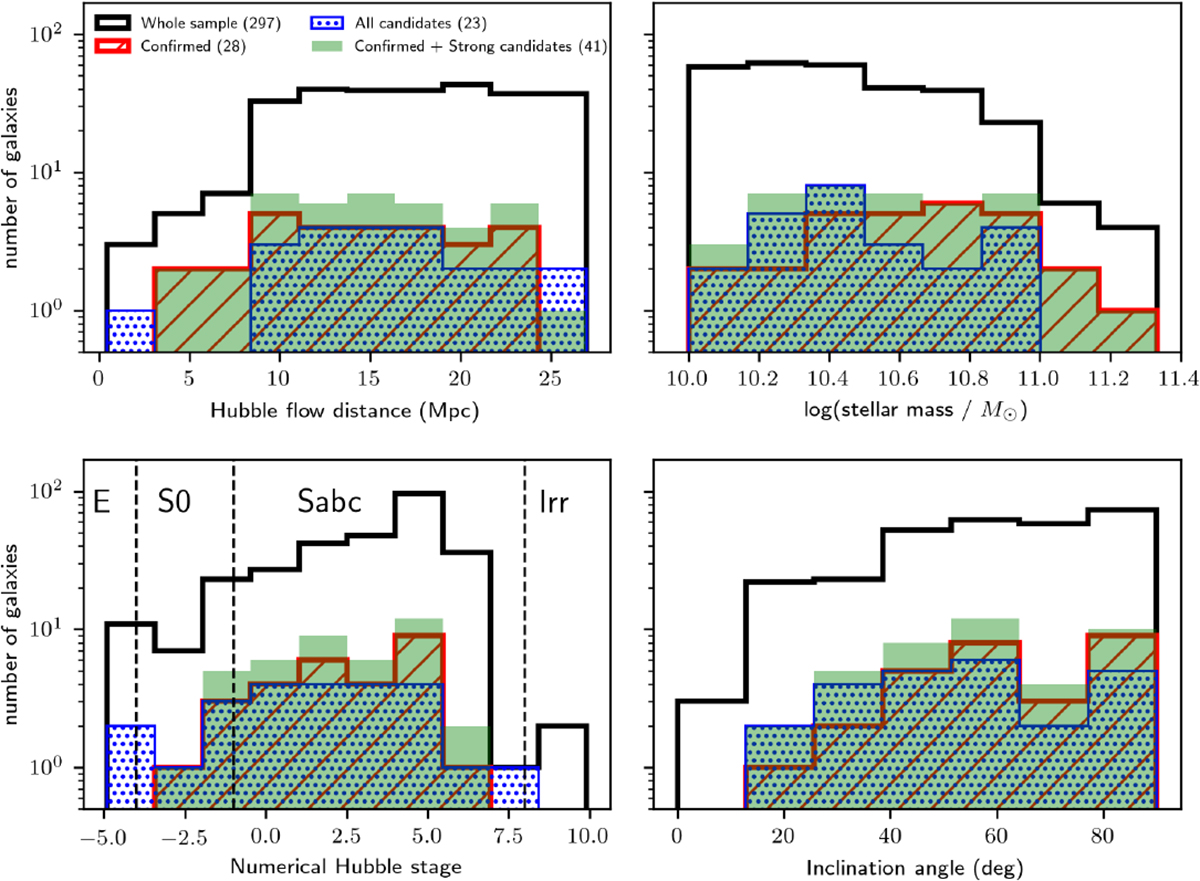
Histograms of the diffuse-light features found in our whole sample, with or without overdensities, as a function of target distance, stellar mass, morphology and inclination angle. The distribution of all 297 galaxies in our sample is shown in black, while histograms in color correspond to the galaxies listed in Table A.1, our main results. The red distributions represent 28 confirmed features, previously known and new (with a DCL of 4; see Sect. 3.1). Unconfirmed feature candidates (with a DCL of 1 and 2) are represented by blue dotted histograms. Confirmed streams and strong candidates (i.e., every feature with a DLC of 3 or 4) are grouped together in the solid green histogram (41 targets). For our limiting sky surface brightness of 28.1 ± 0.3 mag arcsec−2, this implies that ≈14% of the galaxies in the mass and volume limits our parent sample have detectable stellar overdensities in their outskirts. No significant biases are apparent in our sample of galaxies with diffuse overdensities (with respect to the S4G parent sample, black solid line) except for a somewhat flatter distribution of stellar mass and the lack of overdensities for galaxies more distant than 35 Mpc.
Current usage metrics show cumulative count of Article Views (full-text article views including HTML views, PDF and ePub downloads, according to the available data) and Abstracts Views on Vision4Press platform.
Data correspond to usage on the plateform after 2015. The current usage metrics is available 48-96 hours after online publication and is updated daily on week days.
Initial download of the metrics may take a while.