Fig. 8
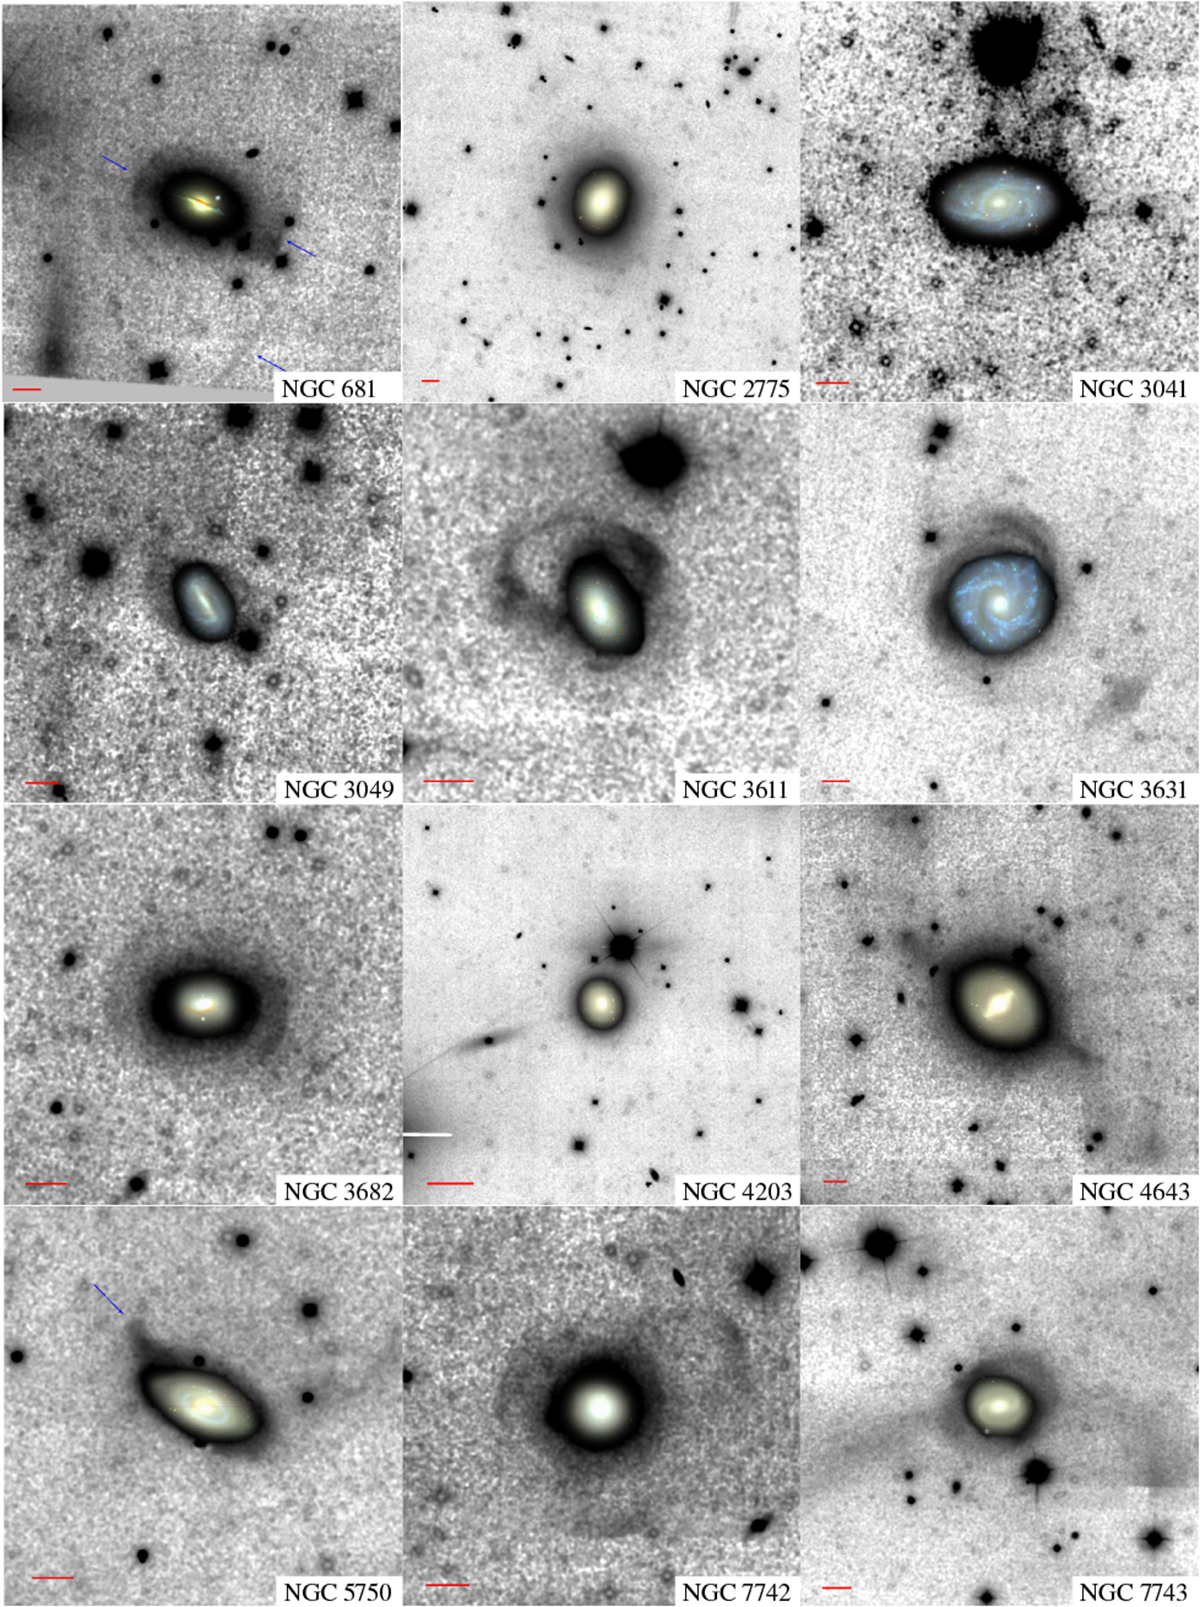
Confirmed tidal streams from Table A.1 detected by stacking g–r–i SDSS bandsas described in this work. Streams already reported in previous publications are not included. The red lines indicate a scale of 3 arcmin. In some cases, blue arrows indicate structures of interest described in Sect. 3.3. North is up and east to the left.
Current usage metrics show cumulative count of Article Views (full-text article views including HTML views, PDF and ePub downloads, according to the available data) and Abstracts Views on Vision4Press platform.
Data correspond to usage on the plateform after 2015. The current usage metrics is available 48-96 hours after online publication and is updated daily on week days.
Initial download of the metrics may take a while.