Fig. 1
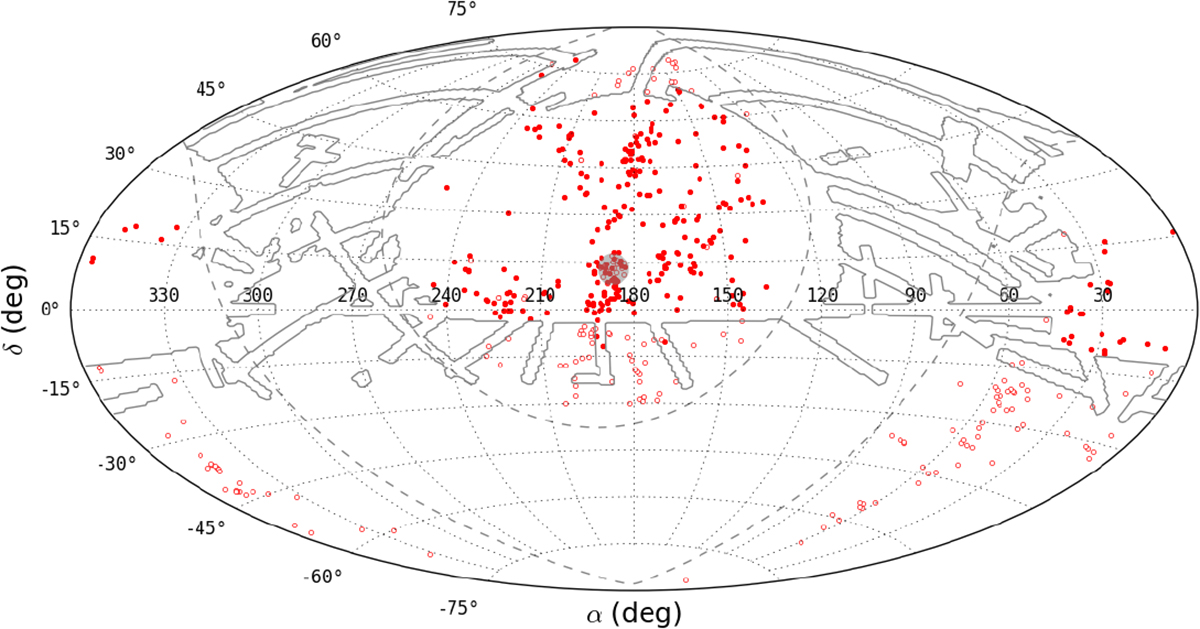
Aitoff projection of the full S4G catalog (empty and filled red circles). The filled red circles mark our selected parent galaxy sample. The dashed lines enclose the Galactic plane area, the solid gray line encompasses the SDSS DR10 footprint, and the solid gray region encompasses the Virgo Cluster area as defined by the NGVS.
Current usage metrics show cumulative count of Article Views (full-text article views including HTML views, PDF and ePub downloads, according to the available data) and Abstracts Views on Vision4Press platform.
Data correspond to usage on the plateform after 2015. The current usage metrics is available 48-96 hours after online publication and is updated daily on week days.
Initial download of the metrics may take a while.