Fig. 7
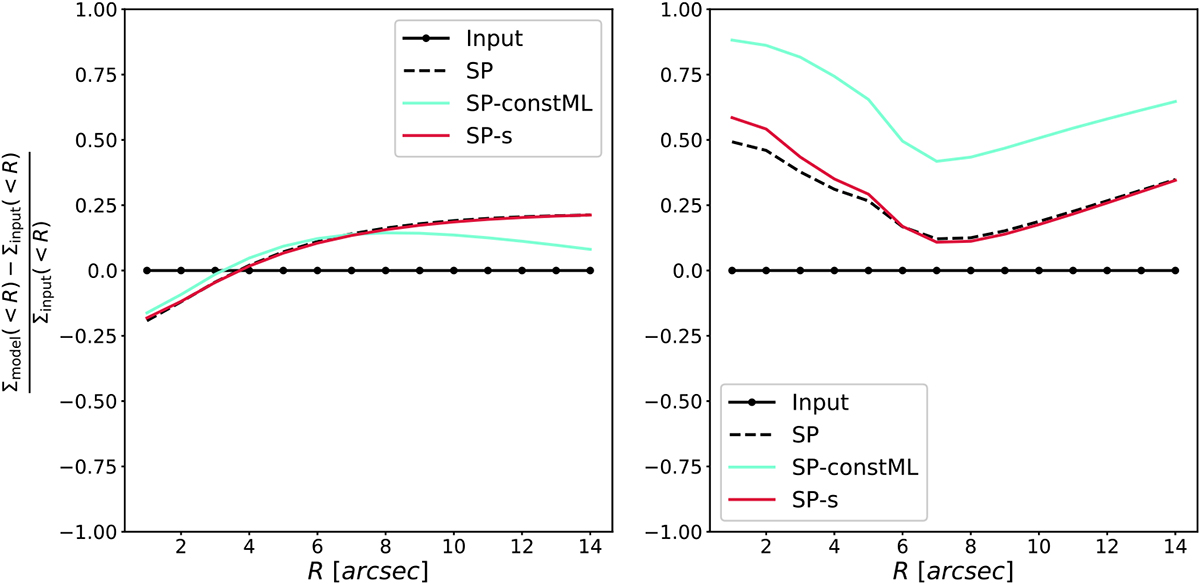
Relative error on the average surface mass density Σ(< R) as a function of radius from the BCG for the single plane best-fit models of mock mass distribution 2. Left: cluster halo only. Right:cluster members only. In each plot, the three lines represent the single plane model (dashed black), the model where we assumed constant mass-to-light ratio (light blue), and the model where we assumed spherical galaxies (red) as compared to the input simulated cluster (solid black).
Current usage metrics show cumulative count of Article Views (full-text article views including HTML views, PDF and ePub downloads, according to the available data) and Abstracts Views on Vision4Press platform.
Data correspond to usage on the plateform after 2015. The current usage metrics is available 48-96 hours after online publication and is updated daily on week days.
Initial download of the metrics may take a while.