Fig. 18
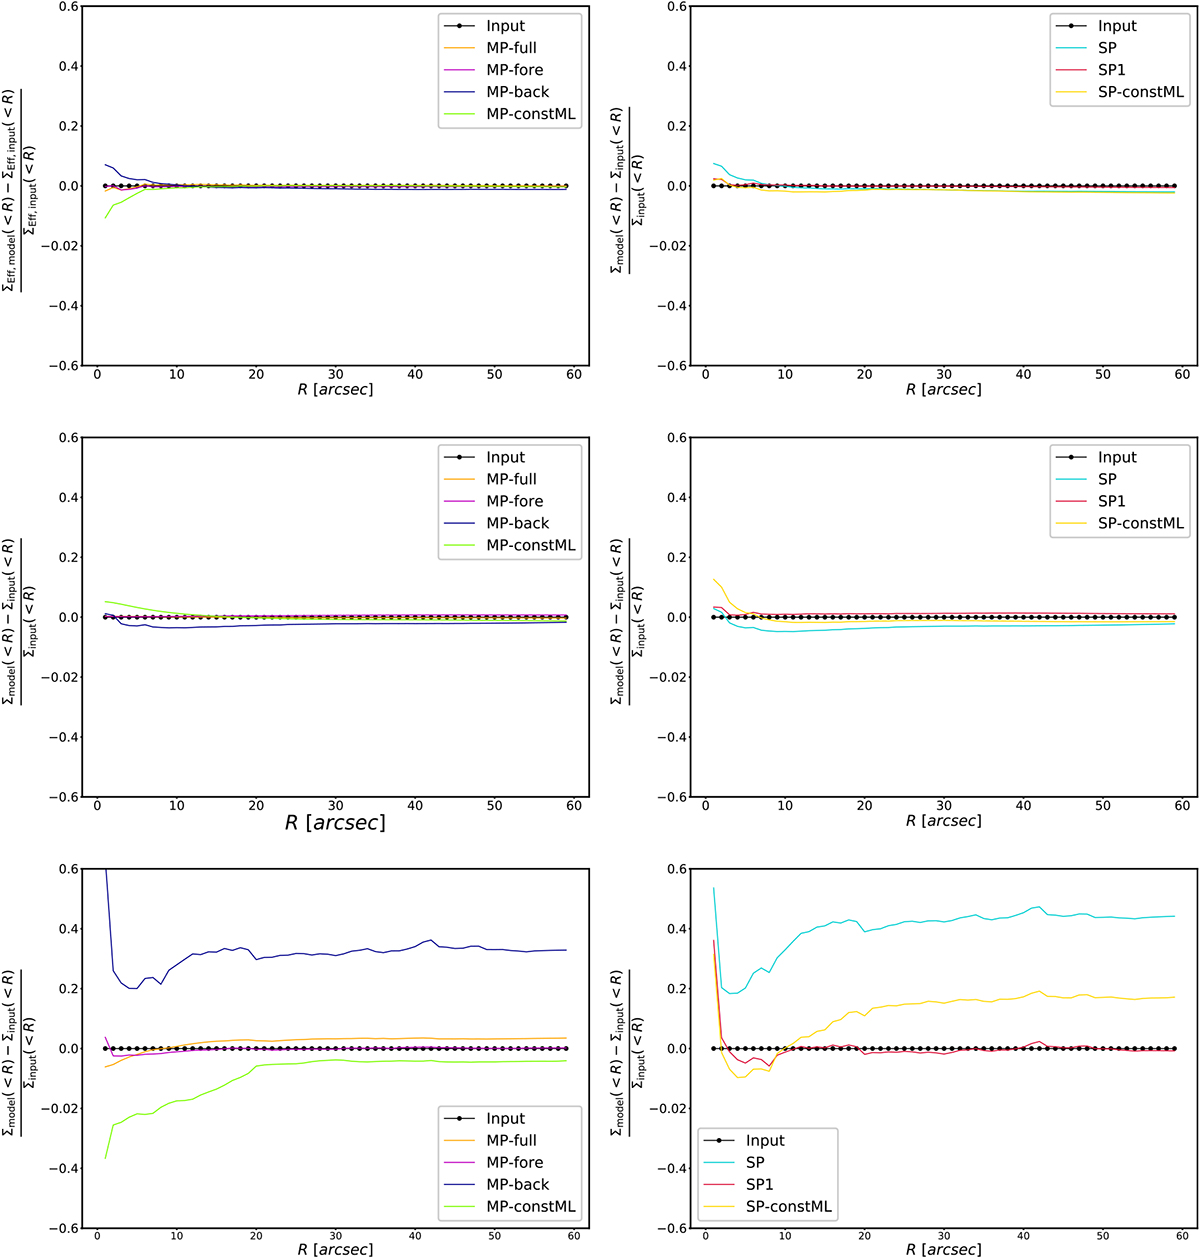
Relative error with respect to the input mock MACS cluster on the average surface mass density Σ(< R) as a function of radius (from G1) for the multi-plane MP (left panels) and single-plane SP (right panels) best-fit models of the mock MACS mass distribution compared to the input model (in dotted black). Upper panels: relative error on the Σeff (< R) (for source at redshift zs = 3) for the total cluster, i.e. halos, members and perturbers. Central panels: relative error on the average surface mass density of the halos for the different models. Bottom panels: relative error on the average surface mass density of the cluster members only. We note that in the total multi-plane configuration the Σeff (< R) is relative to the total deflection angle, as explained in Sect. 2.1.
Current usage metrics show cumulative count of Article Views (full-text article views including HTML views, PDF and ePub downloads, according to the available data) and Abstracts Views on Vision4Press platform.
Data correspond to usage on the plateform after 2015. The current usage metrics is available 48-96 hours after online publication and is updated daily on week days.
Initial download of the metrics may take a while.