Fig. 11
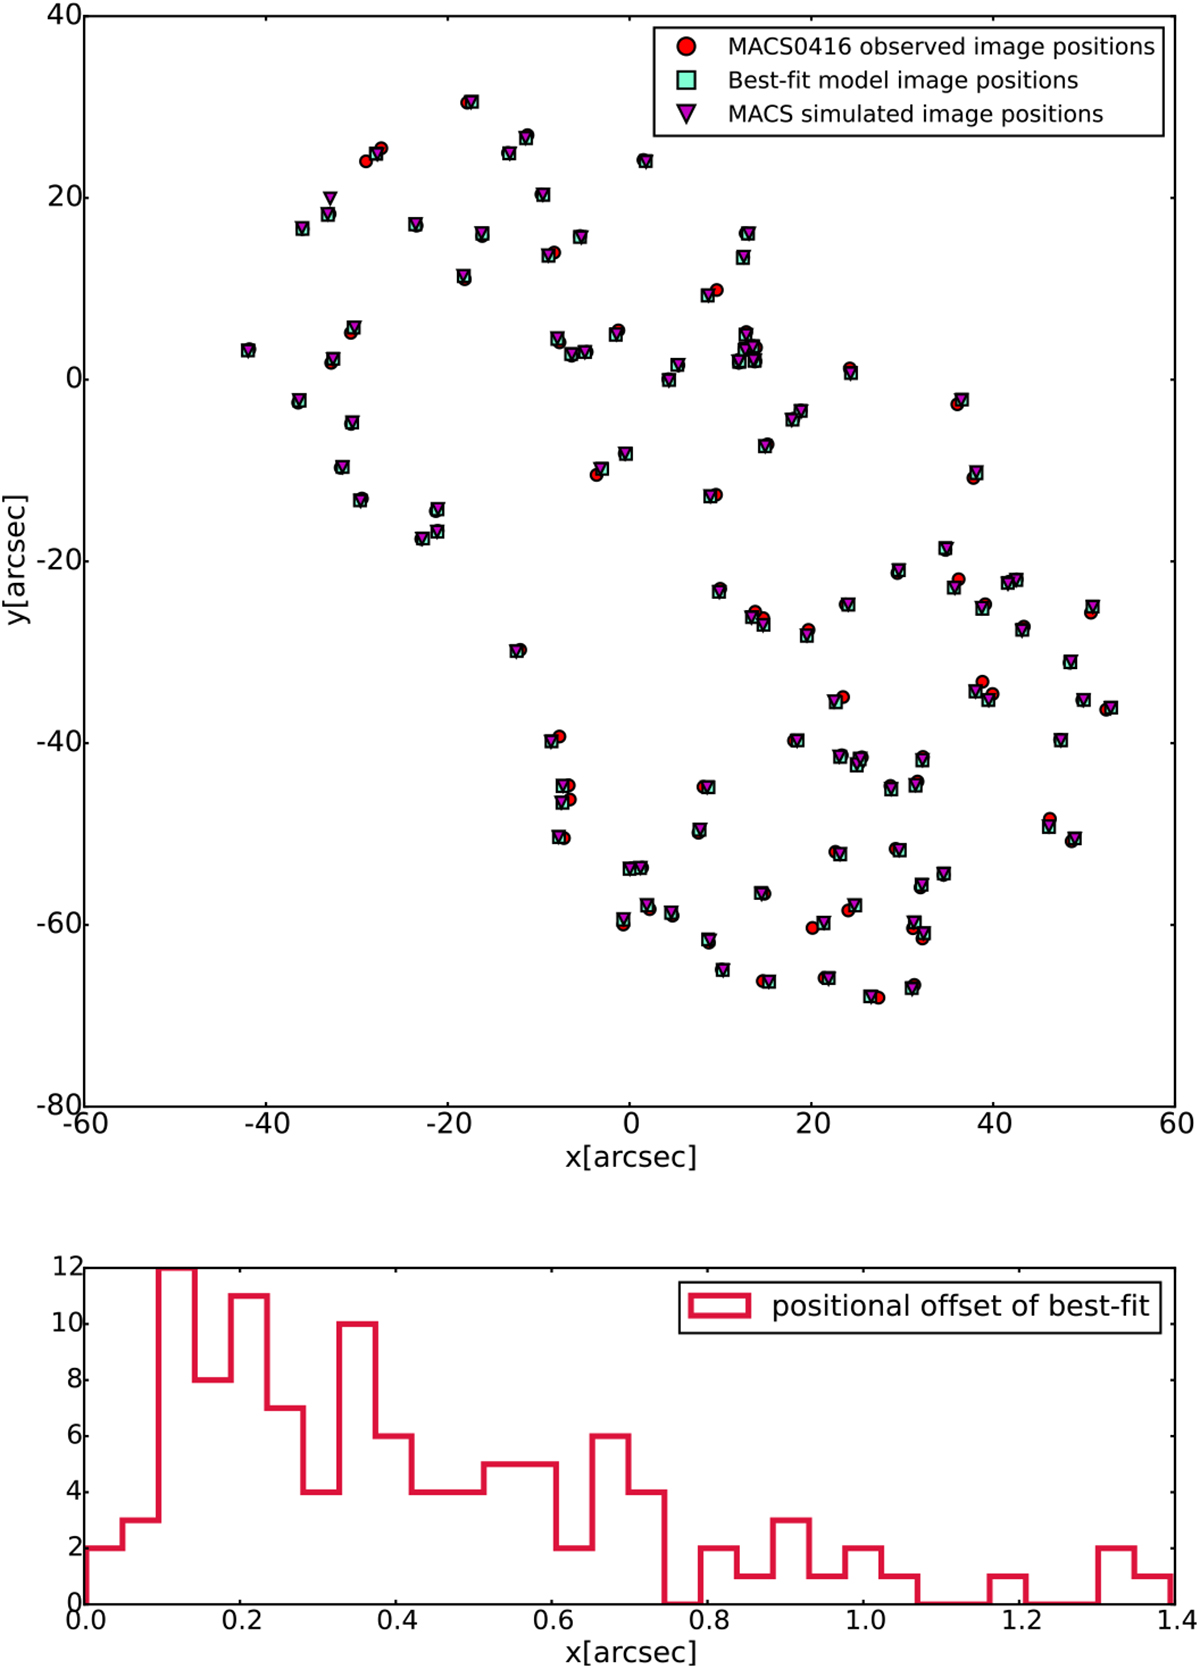
Upper panel: predicted image positions (squares) of MACS J0416.1–2403 MACS J0416.1–2403 and the simulated image positions (triangles) of our MACS model (with introduced gaussian scatter), in comparison to the observed image positions (circles) of MACS J0416.1–2403. Lower panel: positional offsets between the observed and the model-predicted image positions. The rms for our best-fit model of MACS J0416.1–2403 is ~ 0.′′ 53.
Current usage metrics show cumulative count of Article Views (full-text article views including HTML views, PDF and ePub downloads, according to the available data) and Abstracts Views on Vision4Press platform.
Data correspond to usage on the plateform after 2015. The current usage metrics is available 48-96 hours after online publication and is updated daily on week days.
Initial download of the metrics may take a while.