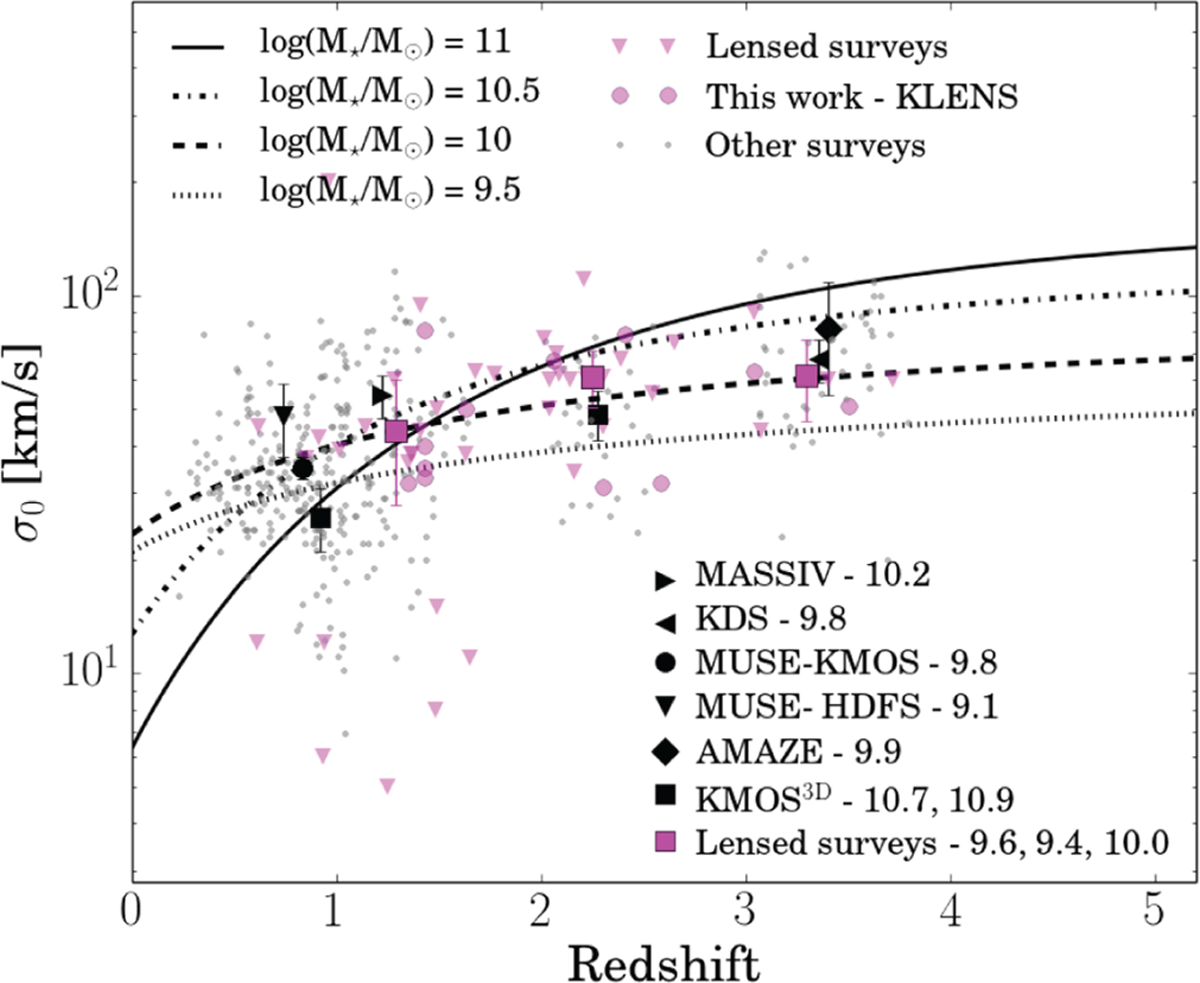
Fig. 5

Intrinsic velocity dispersion as a function of redshift. The curves are from Eq. (11) for log (M⋆ ∕M⊙) = 9.5, 10.0, 10.5, and 11.0. The magenta squares represent the mean velocity dispersions of the lensed surveys, which are the combination of our KLENS work, Livermore et al. (2015), Leethochawalit et al. (2016), and KLASS (Mason et al. 2017). The lensed surveys are divided into three redshift bins: z < 2, 2 < z < 3, and z > 3. The black symbols represent the mean velocity dispersions of the surveys listed at the lower right with their corresponding mean stellar masses.
Current usage metrics show cumulative count of Article Views (full-text article views including HTML views, PDF and ePub downloads, according to the available data) and Abstracts Views on Vision4Press platform.
Data correspond to usage on the plateform after 2015. The current usage metrics is available 48-96 hours after online publication and is updated daily on week days.
Initial download of the metrics may take a while.


