Fig. 3
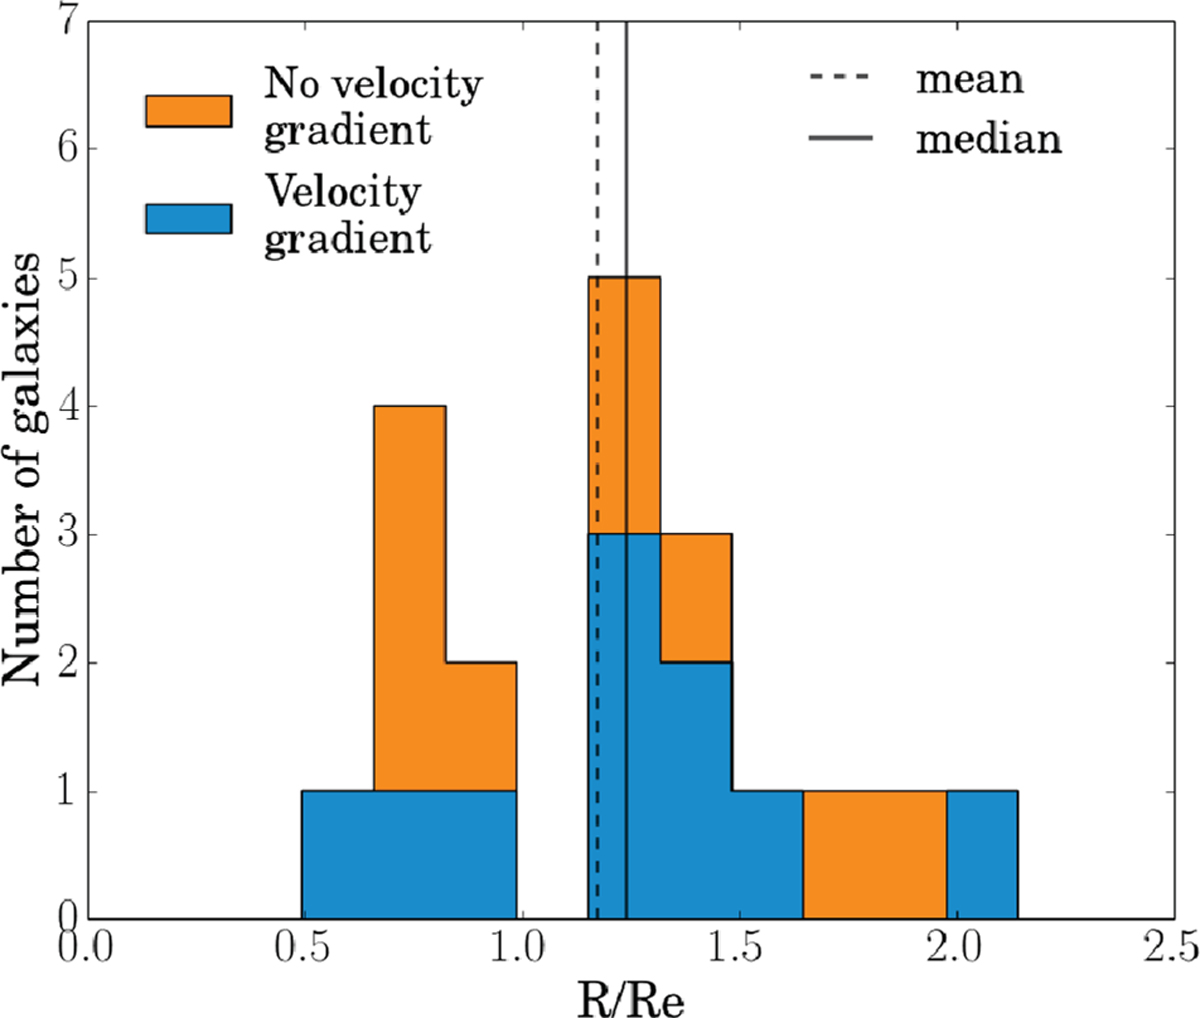
Histogram of R/Re for the resolved galaxies of our sample, where R is the maximum radius where we get a measurement of the velocity and Re is the effective radius. Only galaxies for which it is possible to fit a light profile with GALFITare shown. The galaxies that do not show a velocity gradient are in orange and the galaxies for which it is possible to fit a kinematic model (velocity gradient) are presented in blue.
Current usage metrics show cumulative count of Article Views (full-text article views including HTML views, PDF and ePub downloads, according to the available data) and Abstracts Views on Vision4Press platform.
Data correspond to usage on the plateform after 2015. The current usage metrics is available 48-96 hours after online publication and is updated daily on week days.
Initial download of the metrics may take a while.