| Issue |
A&A
Volume 613, May 2018
|
|
|---|---|---|
| Article Number | A33 | |
| Number of page(s) | 24 | |
| Section | Stellar structure and evolution | |
| DOI | https://doi.org/10.1051/0004-6361/201731785 | |
| Published online | 28 May 2018 | |
Detection of new eruptions in the Magellanic Clouds luminous blue variables R 40 and R 110★
1
Observatório Nacional,
Rua General José Cristino, 77, São Cristóvão,
Rio de Janeiro
20921-400, Brazil
e-mail: This email address is being protected from spambots. You need JavaScript enabled to view it.
2
Laboratory of Observational Astrophysics, Saint Petersburg State University,
Universitetski pr. 28,
198504
Saint Petersburg, Russia
3
Astronomický ústav, Akademie věd České republiky,
Fričova 298,
251 65
Ondřejov, Czech Republic
4
Tartu Observatory,
61602
Tõravere,
Tartumaa, Estonia
Received:
16
August
2017
Accepted:
3
November
2017
Abstract
We performed a spectroscopic and photometric analysis to study new eruptions in two luminous blue variables (LBVs) in the Magellanic Clouds. We detected a strong new eruption in the LBV R40 that reached V ~ 9.2 in 2016, which is around 1.3 mag brighter than the minimum registered in 1985. During this new eruption, the star changed from an A-type to a late F-type spectrum. Based on photometric and spectroscopic empirical calibrations and synthetic spectral modeling, we determine that R 40 reached Teff = 5800–6300 K during this new eruption. This object is thereby probably one of the coolest identified LBVs. We could also identify an enrichment of nitrogen and r- and s-process elements. We detected a weak eruption in the LBV R 110 with a maximum of V ~ 9.9 mag in 2011, that is, around 1.0 mag brighter than in the quiescent phase. On the other hand, this new eruption is about 0.2 mag fainter than the first eruption detected in 1990, but the temperature did not decrease below 8500 K. Spitzer spectra show indications of cool dust in the circumstellar environment of both stars, but no hot or warm dust was present, except by the probable presence of PAHs in R 110. We also discuss a possible post-red supergiant nature for both stars.
Key words: stars: massive / stars: variables: S Doradus / stars: winds, outflows / stars: individual: RMC 40 / stars: individual: RMC 110
Based on observations with the 0.6 m telescope at Pico dos Dias Observatory (Brazil) and MPG/ESO 2.2-m telescope at the European Southern Observatory (La Silla, Chile) under the Prog. IDs: 094.A-9029(D), 096.A-9039(A), and 098.A-9039(C), and under the agreements ESO-Observatório Nacional/MCTIC and MPI-Observatório Nacional/MCTIC, Prog. IDs.: 076.D-0609(A) and 096.A-9030(A).
© ESO 2018
1 Introduction
Massive stars experience some not well understood phases in their final evolution, such as the luminous blue variable (LBV) phase. Only ~40 LBVs are actually known in the Galaxy and in the galaxies of the Local Group (Vink 2012), indicating a short phase in the stellar life of ~25 000 yr (Humphreys & Davidson 1994). These stars, also named as S Dor Variables (van Genderen 2001), are mainly characterized by episodes of strong mass loss (eruptions), resulting in irregular photometric and spectroscopic variabilities.
The role of LBVs in the stellar evolution of massive stars still remains an open question. In the temperature and luminosity range in which LBVs are expected, other types of objects are also seen, such as blue supergiants (BSG) and late-type Wolf-Rayet (WNL) stars, rendering it difficult to identify each phase based purely on its physical parameters, even obtained from a deep analysis of the chemical composition derived from the stellar evolution models (Georgy 2012). For the most massive stars, with MZAMS > 40 M⊙, it is believed that the LBV phase is a transition phase from the main sequence – or possibly BSG phase – to Wolf-Rayet, that is, the star transits from the end of H-core burning to the beginning of He-core burning phase (Maeder 1983; Voors 1999; Ekström et al. 2013; Groh et al. 2014). For lower masses (20 ≤ MZAMS ≤ 25 M⊙), Groh et al. (2014) cite that the LBV phase can only occur in advanced stages of evolution, during the burning of He in the core of the star, associated with a post-red supergiant (RSG) phase and a pre-supernova (SN) stage (Groh et al. 2013b). For stars with MZAMS < 20 M⊙, it is not expected that an LBV phase will occur during their evolution.
According to Voors (1999), there are three types of variations that can be detected in LBVs: microvariations, with Δ V < 0.3 mag on timescales from weeks to months, possibly associated with non-radial pulsations; moderate variations, with 1 < ΔV < 2 mag and periodicity from years to decades, possibly associated with radial pulsations; and eruptions, with Δ V > 2 mag, without a precise periodicity and associated with the strongest mass-loss episodes, wherein the most extreme cases are also called great eruptions. The first two types of variations occur with approximately constant bolometric magnitude, but this is not the case for the third case. It is important to emphasize that these values of Δ V were derived for Galactic LBVs and can be lower for low metallicities objects. A star needs to be observed during an eruption, presenting both photometric and spectral variations, to be classified as LBV, otherwise, it can be only classified as an LBV candidate (LBVc).
However, the physical mechanism that triggers the eruptions is still not well known. It could be related to high rotation (Groh et al. 2009a), radiative pressure with a modified Eddington limit (Lamers & Fitzpatrick 1988), turbulent pressure (de Jager 1984), internal dynamic mechanisms (Stothers & Chin 1993; Glatzel & Kiriakidis 1993), binarity, or a combination of some of these mechanisms.
LBVs are characterized by high mass-loss rates (10−7 ≤ Ṁ ≤ 10−3 M⊙ yr−1), low or not very high expansion velocities (v∞ from 50 to a few hundreds of km s−1), high luminosities (log L∕L⊙ > 5.5) and high effective temperatures (8000 K ≤ Teff ≤ 30 000 K). As noted by Humphreys & Davidson (1994), LBVs are located in two main strips in the HR diagram, related to the quiescent and eruptive stages. The effective temperature in the eruption phase seems to be constant for all LBVs, but during the quiescence it seems to be a function of the stellar luminosity.
In this paper, we present the detection of new eruptions for two LBVs in the Magellanic Clouds R 40 and R 110, based on new spectroscopic and photometric data. In Sect. 2, we describe these two stars. In Sect. 3, we presentour observations and the public data used in our work. In Sect. 4, we analyze the data and discuss the results for each star. The conclusions of the paper are presented in Sect. 5.
2 Our sample
In this work, we present the detection of new eruptions in two LBVs from the Magellanic Clouds RMC 40 (SMC) and RMC 110 (LMC).
RMC 40 (LHA 115-S 52, HD 6884), hereafter R 40, was the first LBV detected in SMC (Szeifert et al. 1993). Its V magnitude was reported as 10.73 mag by Feast et al. (1960) and 10.48 mag by Stahl et al. (1985). Szeifert et al. (1993) reported a V magnitude of 10.25 mag and they showed the spectral change of R 40 from B8Ie (Feast et al. 1960) to A4 in 1993, characterizing a typical LBV eruption. The visual brightness of R 40 reached a maximum of 9.8 mag around 1996 (Sterken et al. 1998) and after that it started to decrease. The physical parameters determined by Szeifert et al. (1993) are Teff = 8700 K, log g = 0.75, MBol = −9.4, R = 280 R⊙, and a current mass of M = 16 M⊙. The identification of this LBV in the SMC indicates that low metallicity environments do not prevent massive stars from evolving to this phase.
RMC 110 (LHA 120-S 116, HD 269662), hereafter R 110, was identified as LBV by Stahl et al. (1990). R 110 was the faintest LBV classified at that time and was classified as MBol = −8.9. The first suspicion of its variability was cited by Stahl et al. (1984). A discrepancy in the B9Ieq classification from Feast et al. (1960) was shown by Stahl et al. (1985), in which R 110 was classified as an early A-type star. According to Stahl et al. (1990), the visual magnitude of this star increased from V = 10.5 mag in December 1980 to 9.99 mag in January 1989 and the spectral type changed from B to F0. In contrast to the other LBVs, this star has not shown significant mass-loss rate variation between the quiescent and eruptive states; this value is Ṁ = 10−6 M⊙ yr−1. The physical parameters derived by Stahl et al. (1990) are Teff = 7600 K, log g = 0.45, R = 310 R⊙ and a current mass of M = 10 M⊙.
3 Observations
3.1 High-resolution spectroscopy
We observed these two stars with the Fiber-fed Extended Range Optical Spectrograph (FEROS) mounted at 2.2 m ESO-MPI telescope at La Silla Observatory (Chile). The instrumental configuration provides a resolution of 0.03 Å/pixel (R ~ 48 000) in a spectral range from 3600 to 9200 Å. The spectra taken in 2005 were reduced using MIDAS routines developed by our group, following standard echelle reduction procedures. The data taken between 2007 and 2016 were reduced by the ESO/FEROS pipeline. The signal-to-noise ratio (S/N) is between 60 and 120 around Hα.
We complemented our data with public pipeline reduced spectra from FEROS and the Ultraviolet and Visual Echelle Spectrograph (UVES) obtained from the ESO Archive. The UVES spectra have a resolution from 40 000 to 100 000 in a spectral range from 3000 to 11 000 Å, which varies according the observing configuration. Table 1 lists all the spectra.
Normalization, cosmic ray cleaning, and equivalent width measurements were done using standard IRAF tasks1.
High-resolution spectra used in our study.
3.2 Photometry
We performed 12 observing campaigns from 2014 to 2017 at Observatório do Pico dos Dias (OPD/LNA, Brazil), using the 0.6 m telescope Boller & Chivens, with 21 nights of effective observation. For these observations we used the CCD Andor IkonL with an E2V CCD42-40 detector (2048 × 2048 13.5 μm square pixels). The stars were observed using UBVRI filters. The observations were reduced via our own routines for point spread function photometry. To convert the instrumental flux to magnitudes, we compared values of field stars taken from the UCAC4 catalog (Zacharias et al. 2013) for B and V filters, DENIS catalog (Cioni et al. 2000) for I filter, and stars taken from other catalogs from the Simbad database2 for R and U filters, using an iterative Monte Carlo comparison method. There, hundreds of groups of randomly chosen stars in the catalogs were compared toR 40 and R 110, obtaining their magnitudes. We assumed the median of these values. The error is estimated as the median absolute deviation from the derived magnitudes. The results of our photometric observations are shown in Table 2a and b.
Photometric data obtained from the literature and public archives were also used to obtain light curves (LC) for these two objects. We collected data from various photometric sources: American Association of Variable Star Observers3 (AAVSO); All Sky Automated Survey (ASAS); Long-Term Photometry Variables at ESO (LTPV; Manfroid et al. 1991; Sterken et al. 1993; Manfroid et al. 1995; Sterken et al. 1995) and from van Genderen et al. (1982); van Genderen (1998). Other photometricdata taken from the literature are described in Table 3.
These data are available in the Johnson photometric system, except the data from the LTPV survey, which uses standard Strömgren filters. Thus, we converted the LTPV data to the Johnson system, via the relations provided by Harmanec & Božić (2001).
UBVRI photometric observations for our sample obtained in the period of 2014–2017 at OPD/LNA.
4 Data analysis
4.1 R 40
4.1.1 Light curve
In Fig. 1, we show the light curve for R 40. The first reported eruption for R 40, which was identified by Szeifert et al. (1993), is clearly visible. This eruption started in approximately 1987, probably reaching the maximum in 1996 and had a V magnitude of approximately 9.8 (Sterken et al. 1998). However, there is a lack of data from 1996 until 2000, hampering the confirmation of this maximum estimate. We identified a new eruption that started in 2005, as can also be seen in Fig. 1; this eruption has not previously been reported in the literature. This is an ongoing eruption, where the maximum brightness was probably reached in the middle of 2016, when R 40 had V ~ 9.2 mag. Szeifert et al. (1993) mentioned that R 40 was the brightest star in the SMC during the first eruption, and since it is even brighter now, it most likely continues to be the most luminous star in that galaxy.
After this probable maximum, the light curve has a drop off almost 0.1 mag just few months later. This fast decrease is not expected to happen, especially compared to the behavior of other eruptions, and its cause is not known.
As we can also see in Fig. 1, the minimum brightness just before each one of these two eruptions has a different value. Previous to the 1987 eruption, R 40 appears to have had a constant magnitude in the V band, V ~ 10.6, in contrast to V ~ 10.2 seen in 2004–2006 just before the new eruption. This may indicate some contribution from the material ejected during the first eruption.
UBVRI photometry for R 40 and R 110 obtained from the literature.
4.1.2 Spectral characteristics
In total, we analysed nine high-resolution spectra (seven FEROS and two UVES) to study the spectral variations of R 40 during the last 16 yr. We identified two different behaviors: one for the spectra taken from 2000 until 2008, and another for those spectra taken in 2014–2016 (see Figs. 2 and A.1).
2000–2008 (quiescence). The spectra taken from 2000 until 2008, which correspond to the period after the first eruption and just before the new eruption, the so-called quiescence, do not have significant variations. They are similar to the spectrum of a B-A supergiant (see Fig. A.1), as previously reported by Szeifert et al. (1993).
From the spectrum taken in 2005, we also derived a mean radial velocity of 169 ± 10 km s−1, obtained from lines of singly ionized metals in pure absorption, especially Fe II, Cr II, Ti II, and Mg II. This value is lower than that derived by Szeifert et al. (1993), 189 ± 5 km s−1, obtained using lines of the same ions. This fact means that the lines observed by Szeifert et al. (1993) may have been formed in an expanding shell and not in the photosphere of the star. Feast et al. (1960) also reported a radial velocity of 181 km s−1 obtained from spectra taken before 1960.
In the spectra taken in 2006–2008 (see Figs. 2 and A.1), the lines of neutral and singly ionized metals clearly became more intense, indicating a gradual decrease in temperature and the beginning of the new ongoing eruption. Absorption lines of singly ionized metals, such as Fe II, Cr II, Ti II, and Si II, dominate the blue part of the spectrum.
A few Fe II lines have P Cygni profiles in the spectra taken in 2005–2008, but not earlier. These profiles present one or two variable absorption components. The same is seen for Balmer lines, which present intense P Cygni profiles (Fig. A.2) with variabilities in both emission and absorption components.
Forbidden lines are commonly seen in the quiescent phase of LBVs, but they are not seen in our R 40 spectra. This is probably caused by a remaining effect of the first eruption, causing an increase of density and avoiding the formation of these lines. However, Stahl et al. (1985) also reported the absence of forbidden lines during the previous quiescent stage, i.e., before the first identified eruption.
2014–2016 (ongoing eruption). The spectra taken from 2014 until 2016 changed from the previous B or A type to a late F-type, corresponding to the probable maximum of the new ongoing eruption and the formation of a pseudo-photosphere. From the visual comparison with spectrafrom the ESO UVES-POP catalog (Bagnulo et al. 2003), we noted that they are very similar to the F8Iab type spectrum of HD 546054 (Figs. 2 and A.1). This late F-type spectrum is very uncommon during an LBV eruption, which is normally associated with a late A or early F-type.
Concerning Hα and Hβ, they both show weak P Cygni profiles with some variability (see Fig. A.2). On the other hand, the other Balmer lines are seen in pure absorption (Fig. A.1). Regarding He I lines, in contrast to what was reported by Szeifert et al. (1993) during the first eruption, these lines have completely disappeared in the spectra taken in 2014–2016.
Another dramatic change is related to Ca II H and K lines (Fig. A.1). Until 2008, during the quiescent phase, these lines were narrow and had a clear separation of the interstellar and circumstellar components. This shape completely changes in the 2014–2016 spectra, in which they appear broad and intense and with the different (stellar plus interstellar) components blended, very similar to a F8Iab star spectrum. The low excitation potential of these lines indicates their formation within a cool pseudo-photosphere, as seen during the eruption of other LBVs (Mehner et al. 2013).
In addition, in the red part of the spectra (> 7000 Å), the Paschenlines did not have strong variations in the quiescent and eruptive stages, appearing as single-absorption profiles. Some lines from Ca I, Mn II, Fe I, Fe II, S I, S II, Ti I, Ti II, and some s- and r-process elements, such as La II, Eu II, and Ba II (and possibly Sr II, Sc II, Nd II, Y I, Gd II, V I, and Yb I), appear only in the 2014–2016 spectra (see Fig. A.1).
A radial velocity of 172.5 km s−1 was derived using the center of the metal lines present in the spectrum taken in 2016.
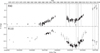 |
Fig. 1 Light curves of R 40 and R 110. Squares indicate OPD/LNA (this work); diamonds indicate LTPV; crosses indicate ASAS; downward triangles indicate AAVSO (V); stars indicate van Genderen (1998); circles indicate references cited in Table 3; and upward triangles indicate the median of the AAVSO (Vis.) data of each year with standard deviation error bars. The vertical lines represent the observation dates of the spectra listed in Table 1. |
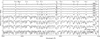 |
Fig. 2 Spectral variation of R 40 seen in the spectra taken from 2002 (top) until 2016 (bottom). We can see the change from a late B/early A-type to a late F-type spectrum, implying a new eruption. The spectrum of HD 54605 (F8Ia) is also shown for comparison. |
4.1.3 Physical parameters of R 40
Deriving the precise spectral type for B-A stars, such as LBVs in the quiescent phase, is not an easy task. Using some empirical spectroscopic criteria, based on equivalent width ratios, we can estimate the spectral classification for B supergiants in the Magellanic Clouds (Lennon 1997). These criteria were later extended to G-type supergiants by Evans & Howarth (2003) and Evans et al. (2004). However for LBVs, the lines can be largely affected by wind contribution, making this classification very uncertain, especially considering Balmer and Fe II lines, which are mainly formed in the wind. Thus, we preferred to use the calibration based on Mg II 4482 /He I 4471 equivalent widths ratio from Lennon (1997), Evans & Howarth (2003), and Kraus et al. (2008, Fig. 3), which are probably less affected by the wind.
For A-type stars in the SMC specifically, the criteria of Evans & Howarth (2003), considering the equivalent widths ratio of Ca II K/(Hϵ + Ca II H), can also be applied. However, these lines are dependent on log g, which may differ in LBVs and normal supergiants, and Hϵ is affected by the wind. In addition, for all F-type stars with low log g, the Ca II H and K lines become strong and their ratio goes to 1.
Based on the polynomial relation between intrinsic  colour and Teff proposed by Flower (1996, Table 5)5, we can also estimate Teff for R 40, using B − V colors from our various observations (the median for each year) and from the literature. In addition, using the relations between the Teff and the spectral types from Humphreys & McElroy (1984, Table 2) and Evans & Howarth (2003, Table 5), we could also estimate Teff of this star in different dates.
The results from these spectroscopic and photometric criteria indicate a strong temperature variability for R 40, from approximately 12 000 K in the 1960s, during the quiescence, to 5750 K in 2016 (see Table 4).
We also used the spectroscopic calibration proposed by Kovtyukh & Gorlova (2000) for F-G supergiants, based on line-depth ratios of some unblended metal lines (see Table 1 in this reference, and the relations number 6, 7 and 22). We obtained Teff = 6100 ± 200 K for the spectrum taken in 2014, which is similar to the results from the photometric calibration.
Some additional computations were also made using Neugent et al. (2010) polynomial equations, which resulted in an underestimated Teff. This conclusion was also obtained by Mehner et al. (2013) for the LMC LBV RMC 71 (R 71). Thus, we discarded these results in our analysis.
Concerning the reddening of R 40, it is not well determined having been derived by different authors, as E(B − V) = 0.07 ~ 0.14 mag (Szeifert et al. 1993) and E(B − V) = 0.09 ~ 0.16 mag (Schlafly & Finkbeiner 2011)6. For our work, we assume the mean value from both authors of E(B − V) = 0.11 ± 0.05.
Modelling using MOOG: We also decided to perform a spectroscopic analysis of R 40 using the LTE code MOOG (Sneden 1973, recent version) and the spectra taken in 2005 and 2014 owing to their high S/N. We chose unblended Fe I lines to derive Teff, microturbulent velocity and iron abundance. Table 5 shows the Fe I lines employed in our analysis, their excitation potentials (χ), values of oscillator strengths (log gf), and the measured equivalent widths from the spectra taken in 2014. The χ and log gf values were taken from Lambert et al. (1996) and Castro et al. (1997). Only the lines with equivalent widths smaller than 180 m Å were used for the determination of the atmospheric parameters.
Assuming log g = 0.5, we estimated Teff by the solution of the excitation equilibrium, where Teff is derived by the zero slope of the trend between the iron abundances calculated from individual Fe I lines and their excitation potentials. The microturbulence velocity (ξ) was derived by forcing the abundance determined from individual iron lines to be independent of the equivalent width (see Fig. 3). Using the local thermodynamic equilibrium (LTE) models of Castelli & Kurucz (2003), the following atmospheric parameters were derived: Teff = 6500 K, ξ = 8.2 km s−1, and log ε(Fe) = 6.86 corresponding to [Fe/H] = −0.647, assuming the solar abundance of 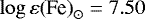 (Asplund et al. 2009).
The effective temperature derived by this method is in agreement with our previous estimates, but it needs to be seen with caution because strong non-LTE effects and the absence of hydrostatic equilibrium may affect the pseudo-photosphere of R 40, which may have an even lower log g than those available by Castelli & Kurucz (2003) models. In addition, the lines of Fe II are very strong and cannot be fitted with the same atmospheric model derived by neutral iron lines. Concerning our metallicity, it is in agreement with results from the literature for the SMC, for example, [Fe/H] = − 0.65 ± 0.2 from Russell & Bessell (1989), [Fe/H] = −0.68 from Luck et al. (1998), and [Fe/H] = −0.73 from Venn (1999).
Using MOOG, we also derived the CNO abundances from the observed spectra taken in both the quiescent (2005) and eruptive phases (2014). The nitrogen abundance was determined by modeling N I lines located around 7440–7480 and 8600–8730 Å. In Fig. 4 we can see our best model fit achieved for a nitrogen abundance of log ε(N) = 8.55, corresponding to [N/Fe] = + 1.25 for the 2014 spectrum. It is important to cite that the lines in the 2014 spectrum display prominent asymmetric blue wings that are not well fitted. Such asymmetries may originate from the expansion of the pseudo-photosphere.
From the 2005 spectrum, our best fit model provides a nitrogen abundance of log ε(N) = 8.65, corresponding to [N/Fe] = + 1.35 (Fig. 4), assuming Teff = 9000 K, log g = 1.5.
Concerning the oxygen abundance, we fitted the lines at 6155.97, 6156.95, and 6158.17 Å in the spectrum taken in 2014 and obtained log ε(O) = 8.0, representing [O/Fe] = − 0.2. This abundance is higher than derived by Venn (1997), who estimated log ε(O) = 7.7 from spectra observed close to the maximum of the first (and hotter) eruption.
We also estimated the carbon abundance using the lines at 7465.45, 7470.09, 7473.31, and 7476 Å, resulting in log ε(C) ≤ 7.4, equivalent to [C/Fe] ≤ − 0.5. The low carbon abundance does not allow us to determine the carbon isotopic ratio of 12 C/13C, which is an important tool to identify evolved stars (Kraus 2009).
The spectra of R 40 during the eruption also show lines from s- and r-process elements, such as Ba II, La II, and Eu II. We calculated the europium abundance fitting the Eu II line at 6645 Å (Fig. 4c), as log ε(Eu) = 0.90, corresponding to [Eu/Fe] = + 1.0. For this modeling, the hyperfine splitting was taken from Mucciarelli et al. (2008). The lanthanum abundance was determined as log ε(La) = 1.95 ([La/Fe] = + 1.4) from the 2014 spectrum using the line at 7483 Å. We performed the same calculation to derive the barium abundance, using the Ba II line at 6142 Å (Fig. 4d), including the hyperfine and isotopic splitting taken from McWilliam (1998). Our best model corresponds to a barium abundance of log ε(Ba) = 2.40 ([Ba/Fe] = + 0.9). This Ba II line is very strong and can be affected by NLTE effects, thus, our result has to be taken with caution. However, even considering the uncertainties of our modeling, the enrichment of s- and r-process elements seems to be real.
The projected rotational velocity, v sin i, of R 40 was also derived from the comparison of observed and synthetic spectra. Analyzing several metal lines that are present when the star is in the eruptive phase, we derived v sin i = 23 ± 2 km s−1. On the other hand, during the quiescent phase, the modeling of the Mg II line provides v sin i = 36 ± 3 km s−1. However, it is well known that atmospheres of supergiant stars are affected by strong macroturbulent motion, which was not considered in our synthetic spectra calculations. Thus, the values of 23 and 36 km s−1 have to be considered as upper limits of the projected rotational velocity during the different phases.
Effective temperature estimations for R 40 and R 110, based on different spectroscopic and photometric criteria, where >A2 corresponds to spectral types later than A2.
Fe I lines in the spectrum of R 40 observed in 2014, used to derive Teff and elemental abundances using the MOOG code.
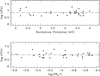 |
Fig. 3 Iron abundance derived from individual Fe I lines, log ε(Fe), using the spectrum of R 40 taken in 2014, vs. the excitation potential (upper panel) and vs. the reduced equivalent width log (EWλ∕λ) (lower panel). |
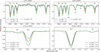 |
Fig. 4 Observed (dotted line) and synthetic (solid lines) spectra of R 40 in the wavelength regions containing the N I (panels a and b), Eu II (panel c), and Ba II (panel d) lines. The observed spectra were obtained in 2005 (panel a) and 2014 (panelsb–d). |
4.1.4 Discussion about R 40
As already mentioned, this new eruption of R 40 that started in 2007 is probably stronger than the previous eruption in 1988, based on its higher maximum brightness. The comparison of our 2014–2016 spectra, which correspond to a F8 supergiant star, with the spectrum reported by Szeifert et al. (1993) as an A4-type, confirms a much cooler temperature during the second eruption. It is important to mention that the spectrum from Szeifert et al. (1993) was not taken during the maximum of the first eruption, but probably not so far from that.
In addition, the estimated effective temperature from our modelling with MOOG of Teff,2015 = 6500 K is almost 1300 K lower than the value estimated by Szeifert et al. (1993) for the first eruption. However, the apparent F8Iab type of our spectra indicates an even cooler temperature, around 6200 K for Magellanic Clouds supergiants, based on Humphreys & McElroy (1984) relation, which is also in agreement with our results using photometric and spectroscopic empirical calibrations. Concerning log g, the value of 0.5 adopted by our MOOG modeling is the lower limit available in the Kurucz grid of equilibrium stellar models, and it is 0.25 dex lower than the value derived for the first eruption (Szeifert et al. 1993). However, the true value can be even lower, since no hydrostatic and ionization equilibrium is present in a pseudo-photosphere.
Thus, even considering the effective temperature estimated by MOOG, it is clear that R 40 became one of the coolest identified LBVs with a temperature similar to that reported for the ongoing great eruption of R 71 (Mehner et al. 2013). It is also important to cite the similarities among the eruptions of both stars, indicating that R 40 is probably facing its first observed great eruption.
Assuming the color excess of E(B − V) = 0.11 ± 0.05 mag (Szeifert et al. 1993; Schlafly & Finkbeiner 2011) and the empirical RV = AV∕E(B − V) = 2.74 measured by Gordon et al. (2003) for SMC, we could estimate a visual extinction of AV = 0.3 ± 0.1 mag. Thus, assuming the SMC distance modulus of DMSMC = 18.90 mag (Laney & Stobie 1994), the current mass of MR 40 = 16 M⊙ and the bolometric corrections (BC) from Humphreys & McElroy (1984), we estimated the bolometric magnitude (MBol), the effective radius of the pseudo-photosphere (R), and the log g for R 40 in different epochs, as can be seen in Table 6.
The effective radius of R 40 has increased by a factor of ~5 since the star left its quiescence before 1985. Our results also point to log g = −0.1 for the pseudo-photosphere, which is much lower than the value used by us in the MOOG modelling. On the other hand, for the true quiescence of this star in 1960, we derived log g1960 = 1.25, which is compatible with a blue supergiant star. For 1991, we derived log g1991 = 0.78 and for 2005, log g2005 = 0.85, indicating the star might not be in true quiescent phases because it was probably still affected by the material from previous eruptions.
Considering the temperature variation as the source of R 40 brightening during the ongoing eruption, the expected Δ V (V apparent magnitude variation) should be only the difference of the BC between the two epochs (quiescence and eruption). In our case, the spectral type changing from B8I to F8I, represents a changing of BC from − 0.51 to 0.05, giving us a  , which cannot be explained just by the observed ΔV = 1.4. This means that an increase of bolometric luminosity of about 0.8 mag seems to be necessary. However, this increase needs to be seen with caution owing to the uncertain circumstellar extinction and especially the uncertain brightness of R 40 and a possible UV excess during the quiescence. It is also possible that we are underestimating MBol during the quiescence because the bolometric correction for LBVs may be different from normal supergiants.
Considering the position of R 40 in the HR diagram (Fig. 5, top panel) associated with the evolutionary tracks with SMC metallicity from Georgy et al. (2013), we concluded that R 40 is a star with MZAMS = 25 ~ 32 M⊙. Its position on the evolutionary tracks points to a transition phase between BSG and RSG phases. However in these tracks, the LBV phase is not expected. On the other hand, considering tracks with solar metallicity from Ekström et al. (2012), shown in Fig. 5 (bottom panel), there is a blue loop after the RSG phase, allowing stars in this mass range, such as R 40, to reach the LBV phase, owing to the mass loss during the RSG and yellow hypergiant (YHG) phase (Humphreys & Davidson 1994; Oudmaijer et al. 2009; Groh et al. 2013a). In addition, R 40 has crossed the Humphreys–Davidson limit (Humphreys & Davidson 1994) during this ongoing eruption, confirming its nature as a strong eruption.
This post-RSG scenario for R 40 would be supported not only by its low mass and luminosity, enrichment of nitrogen, and s- and r-process elements, but also by the probable presence of a dust shell, which is expected to be formed in the RSG phase (Waters et al. 1998; Voors et al. 1999; Voors 1999; Lamers et al. 2001). However, based on Spitzer IRS spectra, obtained from the Combined Atlas of Sources with Spitzer IRS Spectra (CASSIS) archive8, no strong silicate bands were observed. In Fig. 6, we see the Spitzer IRS spectrum of R 40 and also, for comparison, the spectrum of R 71, where these bands are present, indicating the existence of a warm dust nebula (Wolf & Zickgraf 1986; Voors et al. 1999). No PAH feature was identified in the IR spectrum of R 40. Thus, we could not find any evidence of hot or warm dust around R 40. On the other hand, the IR excess after 13 μm points to the possible existence of cold dust emission. This is in agreement with Oksala et al. (2013) who studied the K-band spectrum of R 40, identifying the presence of a double kinked continuum, as seen for YHGs, which may be associated with both a cool stellar photosphere and an infrared excess owing to cool dust. Thus, these authors suggested that R 40 is an LBV in an eruptive stage, as confirmed by us.
Concerning the mass-loss rate during this current eruption, we used the relation between Ṁ, Teff, vexp (expansion velocity), and L∕L⊙ from Davidson (1987) (Eq. (4) and Fig. 1 in this reference), obtaining Ṁ 2016 = 1 × 10⁻⁴ ~ 1 × 10⁻³ M⊙ yr−1. For this rough estimate, we considered the same initial expansion velocity of vexp = 10 km s−1, as assumed by Mehner et al. (2013) for R 71, which is a reasonable value for LBVs. In addition, as carried out by Wolf et al. (1980) for S Dor and by Mehner et al. (2013) for R 71, we also derive the mass-loss rate of R 40 applying the equation Ṁ = 4πμmHnHvexpR2. Assuming the same density parameters (μmHnH) for the wind of R 71 from Mehner et al. (2013), R = 750 R⊙ and vexp = 10 km s−1, we obtain Ṁ R 40 = 5 × 10⁻⁴ M⊙ yr−1. These two determinations have large uncertainties and we should consider these as just a rough estimation of the mass-loss rate. However, if such high values are really representative, we are observing an increase in the mass-loss rate of about 100 times for this ongoing eruption compared to the value derived by Szeifert et al. (1993) for the quiescence of Ṁ 1991 = 8 × 10⁻⁶ M⊙ yr−1.
Bolometric magnitude (MBol), effective radius (R∕R⊙), and log g for R 40 in different epochs, based on the V magnitude and bolometric corrections (BC) from Humphreys & McElroy (1984).
4.2 R 110
4.2.1 Light curve
In Fig. 1, we can see the maximum of the first detected eruption of R 110, reported by Stahl et al. (1990), which reached V ~ 9.7 in 1993. We discovered the presence of a second eruption, starting in 2005, but with uncertain maximum brightness owing to the lack of observations. Using AAVSO Visual band data, which is very similar to V band, we obtained a maximum brightness of V = 9.9 ± 0.2 mag around 2011, which seems to be the peak of this second eruption. This maximum is similar to that of the first reported eruption.
From data obtained in 2016, we can see the visual brightness of R 110 is decreasing, probably returning to the quiescent stage. The minimum between these two eruptions seems to have reached V ~ 10.9 in 2005–2006, which was fainter than V = 10.5 of the first measurements in ~1981 (Stahl et al. 1990) (see Fig. 1).
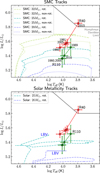 |
Fig. 5 HR diagram showing the position of R 40 and R 110 in different epochs, based on our estimations. The Humphreys–Davidson limit is shown as a gray line. In addition, evolutionary tracks with rotation of vrot,ZAMS = 0.4 vcrit (dashed lines) and without rotation (dotted lines) for SMC metallicity (Georgy et al. 2013, top panel) and for solar metallicity (Ekström et al. 2012, bottom panel) are also shown. Bottom panel: we indicate the regions where LBV phase may occur according to Groh et al. (2013a). |
4.2.2 Spectral characteristics
The spectral variability of R 110 between 2005 and 2016 is less intense than that observed for R 40 (see Fig. B.1). The spectrum in this period is similar to an LBV in a quiescence, i.e., similar to a late-B or early-A spectral type with strong P Cygni profiles in the Balmer lines and lines of singly ionized metals, such as Fe II, Cr II, and Ti II. We do not have any spectra for R 110 close to the maximum of this current eruption around 2011 and our analysis may not reflect all the spectral variations due to this new eruption.
The presence of forbidden lines, mainly [Fe II] and [N II], with approximately symmetric line emission profiles, can be used to estimate the radial velocity of R 110, vrad = 265 ± 5 km s−1. These lines are more intense in the spectrum taken in 2005, indicating the star was in a quiescent period with no signal of a previous pseudo-photosphere. After that, these lines became weaker, indicating that a new cool pseudo-photosphere was formed.
Similarly to R 40, the Spitzer IRS spectra (Fig. 6) of R 110 shows no silicate bands. There is also an IR excess after 13 μm, which is less intense than that observed in R 40 and may also point to the presence of cool dust. We identified some possible PAH bands in the region from 6 to 17 μm, as shown in Fig. 6. Voors (1999) cited that PAH molecules can be formed in oxygen-rich environments of LBVs owing to either the destruction of CO molecules by the UV radiation from the star or the shock of thecurrent faster wind with the slower wind of a possible previous RSG phase. The possible band at 16 μm, and also the strong peaks at 33 and 35 μm seem to be due to reduction problems.
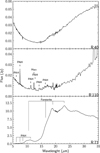 |
Fig. 6 Spitzer IRS spectra of R 40, R 110, and R 71. The spectra were obtained from the CASSIS public archive without any post-processing. The observation dates are 2008-08-04 for R 40, 2004-07-18 for R 110, and 2005-03-21 for R 71. The identification of some spectral lines and dust features are provided. |
Bolometric magnitude (MBol), effective radius (R∕R⊙), and log g for R 110 in various epochs based on the V magnitude and bolometric corrections (BC) from Humphreys & McElroy (1984).
4.2.3 Stellar parameters of R 110
From the Mg II/He I equivalent widths ratio, we could estimate the spectral type and effective temperatureof R 110 (see Table 4). In 2005, the star reached its highest temperature, Teff~ 10 500 K. Then, it dropped to about 9000 K in 2007 and 2014 and to about 8500 K in 2016. This decrease of temperature from 2014 to 2016 is not expected based on the light curve behavior of R 110, and it should be taken with caution owing to the possible wind emission contamination in the He I lines.
We also used the same spectroscopic and photometric criteria as for R 40 to estimate Teff for R 110. The results are also shown in Table 4.
Davies et al. (2005) used the equivalent widths of the Si II lines at 6374 and 6371 Å and of the He I line at 6678 Å to determine the spectral type and temperature of LBVs, comparing the equivalent widths to measurements for standard Galactic stars. Using this relation, we found almost the same temperature for R 110 in 2005, 2007, 2014, and 2016, which was on the order of Teff = 10 000 ± 1000 K, resulting in a higher temperature during the eruptive phase than derived by other methods.
Since no Fe I line was identified and Fe II lines have P Cygni profiles (see Fig. 7), no modelling with MOOG was possible for R 110.
Considering the extinction of R 110, there are two different values for E(B − V) reported in literature, that is, E(B − V) = 0.44 ~ 0.75 (Schlafly & Finkbeiner 2011) and 0.1 ~ 0.2 (Stahl et al. 1990). The colour excess from Schlafly & Finkbeiner (2011) seems to be overestimated because this star is located in a region with inhomogeneous reddening (Imara & Blitz 2007; Dobashi et al. 2008). Thus, the value from Stahl et al. (1990) was assumed by us to be E(B − V) = 0.2 ± 0.1 mag.
Assuming the relation from Humphreys & McElroy (1984) as the source of bolometric correction, we estimated the bolometric magnitude (BC), effective radius (R∕R⊙), and log g for R 110 in different dates. The results are shown in Table 7, where it is possible to see a variability of these parameters during the second eruption, which is not as strong as seen for R 40. For log g estimation, we assumed a current mass of MR 110 = 10 M⊙ (Stahl et al. 1990).
4.2.4 Discussion about R 110
In contrast to what was seen for R 40, R 110 is nowadays experiencing a weaker eruption than the first eruption reported by Stahl et al. (1989). The analysis of its light curve indicates that the maximum intensity in the V band of this new eruption is about 0.3 magnitude weaker than in the first eruption, reaching V = 9.9 ± 0.2 mag around 2011. However, this maximum is not well determined owing to the lack of data between 2011 and 2015.
Based on the spectral variability, Stahl et al. (1989) reported an F spectral type in 1989 for R 110. On the other hand, based on our analysis, it remains an early A star from 2005 until 2016. None of our estimates point to a temperature lower than Teff= 8500 K for the current eruption, which is higher than Teff = 7600 K reported by Stahl et al. (1989) for the first eruption. It is important to note that our analysis is incomplete because we do not have spectroscopic data close to the probable maximum of the eruption in 2011.
Between these two eruptions, the star stayed for a short time in a true quiescence between 2003 and 2004, when it reached its minimum and presented a B9 spectral type (Table 4) and V = 10.9 mag, similar to the values described by Feast et al. (1960) before the first eruption. This spectral type corresponds to Teff~ 10 500 K for stars with LMC metallicity.
Based on the light curve, we can also see that during the first observed eruption, the star showed a brightness increase during more than 10 yr (~1982–1993) and a similar time period for its brightness decline (~1994–2003). On the other hand, the new eruption showed a much shorter brightness growth, going from the quiescence to the maximum of the eruption in around 5–7 yr. This may indicate a higher mass-loss rate during a shorter period for this new eruption compared to the first eruption.
From our analysis for R 110, we found an almost constant MBol = −8.8 ± 0.2 mag, assuming the reddening from Stahl et al. (1990). This value is in agreement with the literature and it includes R 110 in the group of low luminosity LBVs, which may have previously passed through a RSG phase.
The Teff and MBol estimated for R 110 points to a location in the HR diagram in which the evolutionary tracks from Georgy et al. (2013) indicate a transition phase from BSG to RSG for stars with 20 ≤ MZAMS ≤ 25 M⊙. However, as was also cited for R 40, these tracks do not predict the existence of the LBV phase.
The most remarkable point in the spectral analysis of R 110 is the variability of radial velocity related to P Cygni multiple absorption components seen in Fe II and Balmer lines (see Figs. 7 and B.2, respectively). The appearance of these multiple components is possibly due to different shells in the expanding wind, which are formed by an increase of the mass-loss rate during the eruption or, as in the case of AG Car (a Galactic LBV), by dramatic changes in the terminal velocity and mass-loss rate owing to the bi-stability jump effect (Groh et al. 2009b).
5 Conclusions
We have identified new ongoing eruptions for two LBVs in the Magellanic Clouds, R 40 in SMC and R 110 in LMC. These two new eruptions are occurring in very different scenarios: R 40 is experiencing a strong eruption that is much stronger than the previous eruption observed in 1996; and R 110 is now passing through a weak eruption that is weaker than the previous eruption in 1994. Our results confirm the suggestion made by Oksala et al. (2013), based on K-band spectra, that both stars should be suffering eruptions.
From our study, based on new spectroscopic and photometric data obtained by us, and supplemented by data from the literature, we derived physical parameters for both stars in different phases: quiescence and eruption.
R 40, due to its new eruption, became one of the coolest LBVs already observed with Teff = 5800–6500 K. During the quiescent period between the last two eruptions, R 40 still showed evidence of the effects from the first eruption: absence of forbidden lines, a lower visual magnitude, and a lower effective temperature than during the quiescent phase previous to the first reported eruption. From the modeling of observed spectra during the ongoing eruption, we identify an enrichment of nitrogen and r-process elements. These results, associated with the possible presence of a cool dust shell, indicate a post-RSG nature for this object. An enrichment of Ba was also derived, which is not seen in other post-RSG stars (Şahin et al. 2016).
R 110 had, between 2003 and 2004, a true quiescence with the presence of forbidden lines, strong P Cygni profiles, and maximum visual magnitude, keeping the same spectral type compared to the previous quiescence, as reported by Feast et al. (1960). It is most likely that during the quiescence, R 110 had an effective temperature that was not higher than 10 500 K. On the other hand, because of the new eruption, the temperature dropped to not lower than 8500 K. Based on its low luminosity and temperature, we cannot discard a post-RSG nature for R 110 either.
Based on our estimated parameters for both stars in different epochs, we can see in Fig. 5 how R 40 and R 110 are evolving from the quiescence to eruption and vice versa in the HR diagram. As for each star just two eruptions have been recorded, it is not possible to derive a periodicity for these events. Thus, an observational campaign, associated with photometry, spectro-polarimetry and high-resolution spectroscopy, covering not only the V band but also other bands is definitely necessary to follow up these eruptions and better derive their characteristics, and also identify new eruptions. A deeper abundance study is also necessary to confirm a previous RSG phase for these low luminosity LBVs.
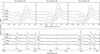 |
Fig. 7 Fe II lines of R 110 observed in 2005, 2007, 2014, and 2016. Top panel: Fe II lines in 4923.9, 5018.4, and 5169.0 Å (from the multiplet 42), which are the strongest lines of this ion in the spectrum of R 110 and present P Cygni profiles with multiple variable absorption components. Bottom panel: spectral region from 4500 to 4565 Å with other Fe II lines with P Cygni profiles. |
Acknowledgements
We thank the anonymous referee for comments that helped us to improve the paper. J.C.N.C. acknowledges Coordenadoria de Aperfeiçoamento de Pessoal de Nível Superior (Capes) for the PhD grant. N.A.D. acknowledges the St. Petersburg State University for the research grant 6.28.335.2015 and FAPERJ, Rio de Janeiro, Brasil, for the visiting researcher grant E-25/200.128/2015. M.K. acknowledges financial support from GAČR (grant number 17-02337S). The Astronomical Institute Ondřejov is supported by the project RVO:67985815. This research was also supported by the European Union European Regional Development Fund, project “Benefits for Estonian Society from Space Research and Application” (KOMEET, 2014 - 2020. 4. 01. 16 - 0029) and by the institutional research funding IUT40-1 of the Estonian Ministry of Education and Research. Parts of the observations obtained with the MPG 2.2 m telescope were supported by the Ministry of Education, Youth and Sports project – LG14013 (Tycho Brahe: Supporting Ground-based Astronomical Observations). We would like to thank the observers (S. Ehlerova, P. Kabath, A. Kawka) for obtaining the data. C.A.G. acknowledges financial support through a Nota 10 fellowship granted by FAPERJ (Fundação Carlos Chagas Filho de Amparo à Pesquisa do Estado do Rio de Janeiro).
Appendix A Spectral variability of R 40
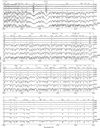 |
Fig. A.1 Complete optical spectra of R 40 taken from 2005 until 2016 with FEROS. The spectra are radial velocity corrected, but without telluric correction. It is possible to see the changing from a late B-type or early A-type to a late-F spectrum owing to the newly identified eruption. The spectrum of HD 54605 (F8Iab) is also shown for comparison. The identification of the lines, based on Moore (1945), Lambert et al. (1996), Castro et al. (1997), and Hill et al. (2002) are also provided. |
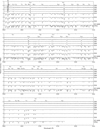 |
Fig. A.1 continued. |
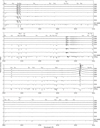 |
Fig. A.1 continued. |
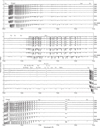 |
Fig. A.1 continued. |
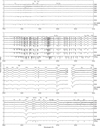 |
Fig. A.1 continued. |
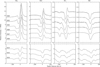 |
Fig. A.2 Variation of Hα, Hβ, Hγ, and Hδ line profiles of R 40 shown in various dates. |
Appendix B Spectral variability of R 110
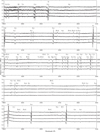 |
Fig. B.1 Complete optical spectra of R 110 taken from 2005 until 2016 with FEROS. The spectra are radial velocity corrected, but without telluric correction. It is possible to see the variations caused by the newly identified eruption. The identification of the lines, based on Moore (1945), are also provided. |
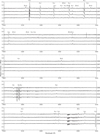 |
Fig. B.1 continued. |
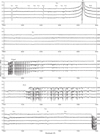 |
Fig. B.1 continued. |
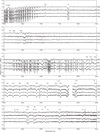 |
Fig. B.1 continued. |
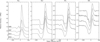 |
Fig. B.2 Balmer lines (Hα, Hβ, Hγ, and Hδ) of R 110 observed in 2005, 2007, 2014, and 2016. |
References
- Ardeberg, A. 1980, A&AS, 42, 1 [NASA ADS] [Google Scholar]
- Ardeberg, A., & Maurice, E. 1977, A&AS, 30, 261 [NASA ADS] [Google Scholar]
- Asplund, M., Grevesse, N., Sauval, A. J., & Scott, P. 2009, ARA&A, 47, 481 [NASA ADS] [CrossRef] [Google Scholar]
- Bagnulo, S., Jehin, E., Ledoux, C., et al. 2003, The Messenger, 114, 10 [Google Scholar]
- Butler, C. J. 1972, Dunsink Observatory Publications, 1, 133 [NASA ADS] [Google Scholar]
- Castelli, F., & Kurucz, R. L. 2003, in Modelling of Stellar Atmospheres, eds. N. Piskunov, W. W. Weiss, & D. F. Gray, IAU Symp., 210, A20 [Google Scholar]
- Castro, S., Rich, R. M., Grenon, M., Barbuy, B., & McCarthy, J. K. 1997, AJ, 114, 376 [NASA ADS] [CrossRef] [Google Scholar]
- Cioni, M.-R., Loup, C., Habing, H. J., et al. 2000, A&AS, 144, 235 [NASA ADS] [CrossRef] [EDP Sciences] [Google Scholar]
- Dachs, J. 1970, A&A, 9, 95 [NASA ADS] [Google Scholar]
- Davidson, K. 1987, ApJ, 317, 760 [NASA ADS] [CrossRef] [Google Scholar]
- Davies, B., Oudmaijer, R. D., & Vink, J. S. 2005, A&A, 439, 1107 [NASA ADS] [CrossRef] [EDP Sciences] [Google Scholar]
- de Jager, C. 1984, A&A, 138, 246 [NASA ADS] [Google Scholar]
- Dobashi, K., Bernard, J.-P., Hughes, A., et al. 2008, A&A, 484, 205 [NASA ADS] [CrossRef] [EDP Sciences] [Google Scholar]
- Ekström, S., Georgy, C., Eggenberger, P., et al. 2012, A&A, 537, A146 [NASA ADS] [CrossRef] [EDP Sciences] [Google Scholar]
- Ekström, S., Georgy, C., Meynet, G., Groh, J., & Granada, A. 2013, in Red Supergiants and Stellar Evolution, eds. P. Kervella, T. Le Bertre, & G. Perrin, EAS Pub. Ser., 60, 31 [CrossRef] [Google Scholar]
- Evans, C. J., & Howarth, I. D. 2003, MNRAS, 345, 1223 [NASA ADS] [CrossRef] [Google Scholar]
- Evans, C. J., Howarth, I. D., Irwin, M. J., Burnley, A. W., & Harries, T. J. 2004, MNRAS, 353, 601 [NASA ADS] [CrossRef] [Google Scholar]
- Feast, M. W., Thackeray, A. D., & Wesselink, A. J. 1960, MNRAS, 121, 337 [NASA ADS] [CrossRef] [Google Scholar]
- Flower, P. J. 1996, ApJ, 469, 355 [NASA ADS] [CrossRef] [Google Scholar]
- Georgy, C. 2012, A&A, 538, L8 [NASA ADS] [CrossRef] [EDP Sciences] [Google Scholar]
- Georgy, C., Ekström, S., Eggenberger, P., et al. 2013, A&A, 558, A103 [NASA ADS] [CrossRef] [EDP Sciences] [Google Scholar]
- Glatzel, W., & Kiriakidis, M. 1993, MNRAS, 263, 375 [NASA ADS] [Google Scholar]
- Gordon, K. D., Clayton, G. C., Misselt, K. A., Landolt, A. U., & Wolff, M. J. 2003, ApJ, 594, 279 [NASA ADS] [CrossRef] [EDP Sciences] [Google Scholar]
- Groh, J. H., Damineli, A., Hillier, D. J., et al. 2009a, ApJ, 705, L25 [NASA ADS] [CrossRef] [Google Scholar]
- Groh, J. H., Hillier, D. J., Damineli, A., et al. 2009b, ApJ, 698, 1698 [NASA ADS] [CrossRef] [Google Scholar]
- Groh, J. H., Meynet, G., & Ekström, S. 2013a, A&A, 550, L7 [NASA ADS] [CrossRef] [EDP Sciences] [Google Scholar]
- Groh, J. H., Meynet, G., Georgy, C., & Ekström, S. 2013b, A&A, 558, A131 [NASA ADS] [CrossRef] [EDP Sciences] [Google Scholar]
- Groh, J. H., Meynet, G., Ekström, S., & Georgy, C. 2014, A&A, 564, A30 [NASA ADS] [CrossRef] [EDP Sciences] [Google Scholar]
- Harmanec, P., & Božić, H. 2001, A&A, 369, 1140 [NASA ADS] [CrossRef] [EDP Sciences] [Google Scholar]
- Hill, V., Plez, B., Cayrel, R., et al. 2002, A&A, 387, 560 [NASA ADS] [CrossRef] [EDP Sciences] [Google Scholar]
- Humphreys, R. M., & Davidson, K. 1994, PASP, 106, 1025 [NASA ADS] [CrossRef] [Google Scholar]
- Humphreys, R. M., & McElroy, D. B. 1984, ApJ, 284, 565 [NASA ADS] [CrossRef] [Google Scholar]
- Imara, N., & Blitz, L. 2007, ApJ, 662, 969 [NASA ADS] [CrossRef] [Google Scholar]
- Kovtyukh, V. V., & Gorlova, N. I. 2000, A&A, 358, 587 [NASA ADS] [Google Scholar]
- Kraus, M. 2009, A&A, 494, 253 [NASA ADS] [CrossRef] [EDP Sciences] [Google Scholar]
- Kraus, M., Borges Fernandes, M., Kubát, J., & de Araújo, F. X. 2008, A&A, 487, 697 [NASA ADS] [CrossRef] [EDP Sciences] [Google Scholar]
- Lambert, D. L., Heath, J. E., Lemke, M., & Drake, J. 1996, ApJS, 103, 183 [NASA ADS] [CrossRef] [Google Scholar]
- Lamers, H. J. G. L. M., & Fitzpatrick, E. L. 1988, ApJ, 324, 279 [NASA ADS] [CrossRef] [Google Scholar]
- Lamers, H. J. G. L. M., Nota, A., Panagia, N., Smith, L. J., & Langer, N. 2001, ApJ, 551, 764 [NASA ADS] [CrossRef] [Google Scholar]
- Laney, C. D., & Stobie, R. S. 1994, MNRAS, 266, 441 [NASA ADS] [CrossRef] [Google Scholar]
- Lennon, D. J. 1997, A&A, 317, 871 [NASA ADS] [Google Scholar]
- Luck, R. E. 2014, AJ, 147, 137 [NASA ADS] [CrossRef] [Google Scholar]
- Luck, R. E., Moffett, T. J., Barnes, III, T. G., & Gieren, W. P. 1998, AJ, 115, 605 [NASA ADS] [CrossRef] [Google Scholar]
- Maeder, A. 1983, A&A, 120, 113 [NASA ADS] [Google Scholar]
- Manfroid, J., Sterken, C., Bruch, A., et al. 1991, A&AS, 87, 481 [NASA ADS] [Google Scholar]
- Manfroid, J., Sterken, C., Cunow, B., et al. 1995, A&AS, 109, 329 [NASA ADS] [Google Scholar]
- McWilliam, A. 1998, AJ, 115, 1640 [NASA ADS] [CrossRef] [Google Scholar]
- Mehner, A., Baade, D., Rivinius, T., et al. 2013, A&A, 555, A116 [NASA ADS] [CrossRef] [EDP Sciences] [Google Scholar]
- Mendoza, E. E. 1970, Boletin de los Observatorios Tonantzintla y Tacubaya, 5, 269 [NASA ADS] [Google Scholar]
- Moore, C. E. 1945, A Multiplet Table of Astrophysical Interest, Part I – Table of Multiplets (Princeton University Observatory) [Google Scholar]
- Mucciarelli, A., Caffau, E., Freytag, B., Ludwig, H.-G., & Bonifacio, P. 2008, A&A, 484, 841 [NASA ADS] [CrossRef] [EDP Sciences] [Google Scholar]
- Neugent, K. F., Massey, P., Skiff, B., et al. 2010, ApJ, 719, 1784 [NASA ADS] [CrossRef] [Google Scholar]
- Oksala, M. E., Kraus, M., Cidale, L. S., Muratore, M. F., & Borges Fernandes, M. 2013, A&A, 558, A17 [NASA ADS] [CrossRef] [EDP Sciences] [Google Scholar]
- Osmer, P. S. 1973, ApJ, 181, 327 [NASA ADS] [CrossRef] [Google Scholar]
- Oudmaijer, R. D., Davies, B., de Wit, W.-J., & Patel, M. 2009, in The Biggest, Baddest, Coolest Stars, eds. D. G. Luttermoser, B. J. Smith, & R. E. Stencel, ASP Conf. Ser., 412, 17 [NASA ADS] [Google Scholar]
- Russell, S. C.,& Bessell, M. S. 1989, ApJS, 70, 865 [NASA ADS] [CrossRef] [Google Scholar]
- Şahin, T., Lambert, D. L., Klochkova, V. G., & Panchuk, V. E. 2016, MNRAS, 461, 4071 [NASA ADS] [CrossRef] [Google Scholar]
- Schlafly, E. F., & Finkbeiner, D. P. 2011, ApJ, 737, 103 [NASA ADS] [CrossRef] [Google Scholar]
- Sneden, C. A. 1973, PhD thesis, The University of Texas at Austin, USA [Google Scholar]
- Stahl, O., Wolf, B., Leitherer, C., et al. 1984, A&A, 140, 459 [NASA ADS] [Google Scholar]
- Stahl, O., Wolf, B., Leitherer, C., & de Groot, M. 1985, A&AS, 61, 237 [NASA ADS] [Google Scholar]
- Stahl, O., Wolf, B., Klare, G., Jüttner, A., & Cassatella, A. 1989, Astronomische Gesellschaft Abstract Series, 3, 115 [NASA ADS] [Google Scholar]
- Stahl, O., Wolf, B., Klare, G., Juettner, A., & Cassatella, A. 1990, A&A, 228, 379 [NASA ADS] [Google Scholar]
- Sterken, C., Manfroid, J., Anton, K., et al. 1993, A&AS, 102, 79 [NASA ADS] [Google Scholar]
- Sterken, C., Manfroid, J., Beele, D., et al. 1995, A&AS, 113, 31 [NASA ADS] [Google Scholar]
- Sterken, C., de Groot, M., & van Genderen, A. M. 1998, A&A, 333, 565 [NASA ADS] [Google Scholar]
- Stothers, R. B., & Chin, C.-W. 1993, ApJ, 408, L85 [NASA ADS] [CrossRef] [Google Scholar]
- Szeifert, T., Stahl, O., Wolf, B., et al. 1993, A&A, 280, 508 [NASA ADS] [Google Scholar]
- van Genderen,A. M. 1998, J. Astron. Data, 4, 10 [Google Scholar]
- van Genderen,A. M. 2001, A&A, 366, 508 [NASA ADS] [CrossRef] [EDP Sciences] [Google Scholar]
- van Genderen, A. M., van Leeuwen, F., & Brand, J. 1982, A&AS, 47, 591 [NASA ADS] [Google Scholar]
- Venn, K. A. 1997, in Luminous Blue Variables: Massive Stars in Transition, eds. A. Nota, & H. Lamers, ASP Conf. Ser., 120, 95 [NASA ADS] [Google Scholar]
- Venn, K. A. 1999, ApJ, 518, 405 [NASA ADS] [CrossRef] [Google Scholar]
- Vink, J. S. 2012, eds. K. Davidson, & R. M. Humphreys, Astrophysics and Space Science Library, 384, 221 [Google Scholar]
- Voors, R. H. M. 1999, PhD thesis, Universiteit Utrecht, The Netherlands [Google Scholar]
- Voors, R. H. M., Waters, L. B. F. M., Morris, P. W., et al. 1999, A&A, 341, L67 [NASA ADS] [Google Scholar]
- Walraven, T., & Walraven, J. H. 1977, A&AS, 30, 245 [NASA ADS] [Google Scholar]
- Waters, L. B. F. M., Morris, P. W., Voors, R. H. M., Lamers, H. J. G. L. M., & Trams, N. R. 1998, Ap&SS, 255, 179 [NASA ADS] [CrossRef] [Google Scholar]
- Wolf, B., & Zickgraf, F. J. 1986, A&A, 164, 435 [NASA ADS] [Google Scholar]
- Wolf, B., Appenzeller, I., & Cassatella, A. 1980, A&A, 88, 15 [NASA ADS] [Google Scholar]
- Zacharias, N., Finch, C. T., Girard, T. M., et al. 2013, AJ, 145, 44 [NASA ADS] [CrossRef] [EDP Sciences] [Google Scholar]
IRAF is distributed by the National Optical Astronomy Observatories, which are operated by the Association of Universities for Research in Astronomy, Inc., under cooperative agreement with the National Science Foundation. See http://iraf.noao.edu/
For a better analysis of the light curve of R 110, we also included the data from AAVSO Visual band, which is similar to the V filter, but is not precise and has to be analyzed carefully.
This star, also named Wezen, δ CMa, or HR 2693 (V = 1.84 mag, Teff = 6476 K, log g = 0.89, and [Fe/H] = + 0.28, see Luck 2014), is a bright galactic yellow supergiant.
There is a mistake in the caption of that table. In the original caption, the cited polynomial equation is  , but, as we could not reproduce the results using it, we inverted it to
  , thereby reproducing the results correctly.
Values taken from http://irsa.ipac.caltech.edu/applications/DUST/
We used the notation [X/H] =  .
.
All Tables
UBVRI photometric observations for our sample obtained in the period of 2014–2017 at OPD/LNA.
Effective temperature estimations for R 40 and R 110, based on different spectroscopic and photometric criteria, where >A2 corresponds to spectral types later than A2.
Fe I lines in the spectrum of R 40 observed in 2014, used to derive Teff and elemental abundances using the MOOG code.
Bolometric magnitude (MBol), effective radius (R∕R⊙), and log g for R 40 in different epochs, based on the V magnitude and bolometric corrections (BC) from Humphreys & McElroy (1984).
Bolometric magnitude (MBol), effective radius (R∕R⊙), and log g for R 110 in various epochs based on the V magnitude and bolometric corrections (BC) from Humphreys & McElroy (1984).
All Figures
|
Fig. 1 Light curves of R 40 and R 110. Squares indicate OPD/LNA (this work); diamonds indicate LTPV; crosses indicate ASAS; downward triangles indicate AAVSO (V); stars indicate van Genderen (1998); circles indicate references cited in Table 3; and upward triangles indicate the median of the AAVSO (Vis.) data of each year with standard deviation error bars. The vertical lines represent the observation dates of the spectra listed in Table 1. |
| In the text | |
|
Fig. 2 Spectral variation of R 40 seen in the spectra taken from 2002 (top) until 2016 (bottom). We can see the change from a late B/early A-type to a late F-type spectrum, implying a new eruption. The spectrum of HD 54605 (F8Ia) is also shown for comparison. |
| In the text | |
|
Fig. 3 Iron abundance derived from individual Fe I lines, log ε(Fe), using the spectrum of R 40 taken in 2014, vs. the excitation potential (upper panel) and vs. the reduced equivalent width log (EWλ∕λ) (lower panel). |
| In the text | |
|
Fig. 4 Observed (dotted line) and synthetic (solid lines) spectra of R 40 in the wavelength regions containing the N I (panels a and b), Eu II (panel c), and Ba II (panel d) lines. The observed spectra were obtained in 2005 (panel a) and 2014 (panelsb–d). |
| In the text | |
|
Fig. 5 HR diagram showing the position of R 40 and R 110 in different epochs, based on our estimations. The Humphreys–Davidson limit is shown as a gray line. In addition, evolutionary tracks with rotation of vrot,ZAMS = 0.4 vcrit (dashed lines) and without rotation (dotted lines) for SMC metallicity (Georgy et al. 2013, top panel) and for solar metallicity (Ekström et al. 2012, bottom panel) are also shown. Bottom panel: we indicate the regions where LBV phase may occur according to Groh et al. (2013a). |
| In the text | |
|
Fig. 6 Spitzer IRS spectra of R 40, R 110, and R 71. The spectra were obtained from the CASSIS public archive without any post-processing. The observation dates are 2008-08-04 for R 40, 2004-07-18 for R 110, and 2005-03-21 for R 71. The identification of some spectral lines and dust features are provided. |
| In the text | |
|
Fig. 7 Fe II lines of R 110 observed in 2005, 2007, 2014, and 2016. Top panel: Fe II lines in 4923.9, 5018.4, and 5169.0 Å (from the multiplet 42), which are the strongest lines of this ion in the spectrum of R 110 and present P Cygni profiles with multiple variable absorption components. Bottom panel: spectral region from 4500 to 4565 Å with other Fe II lines with P Cygni profiles. |
| In the text | |
|
Fig. A.1 Complete optical spectra of R 40 taken from 2005 until 2016 with FEROS. The spectra are radial velocity corrected, but without telluric correction. It is possible to see the changing from a late B-type or early A-type to a late-F spectrum owing to the newly identified eruption. The spectrum of HD 54605 (F8Iab) is also shown for comparison. The identification of the lines, based on Moore (1945), Lambert et al. (1996), Castro et al. (1997), and Hill et al. (2002) are also provided. |
| In the text | |
|
Fig. A.1 continued. |
| In the text | |
|
Fig. A.1 continued. |
| In the text | |
|
Fig. A.1 continued. |
| In the text | |
|
Fig. A.1 continued. |
| In the text | |
|
Fig. A.2 Variation of Hα, Hβ, Hγ, and Hδ line profiles of R 40 shown in various dates. |
| In the text | |
|
Fig. B.1 Complete optical spectra of R 110 taken from 2005 until 2016 with FEROS. The spectra are radial velocity corrected, but without telluric correction. It is possible to see the variations caused by the newly identified eruption. The identification of the lines, based on Moore (1945), are also provided. |
| In the text | |
|
Fig. B.1 continued. |
| In the text | |
|
Fig. B.1 continued. |
| In the text | |
|
Fig. B.1 continued. |
| In the text | |
|
Fig. B.2 Balmer lines (Hα, Hβ, Hγ, and Hδ) of R 110 observed in 2005, 2007, 2014, and 2016. |
| In the text | |
Current usage metrics show cumulative count of Article Views (full-text article views including HTML views, PDF and ePub downloads, according to the available data) and Abstracts Views on Vision4Press platform.
Data correspond to usage on the plateform after 2015. The current usage metrics is available 48-96 hours after online publication and is updated daily on week days.
Initial download of the metrics may take a while.