Fig. 5
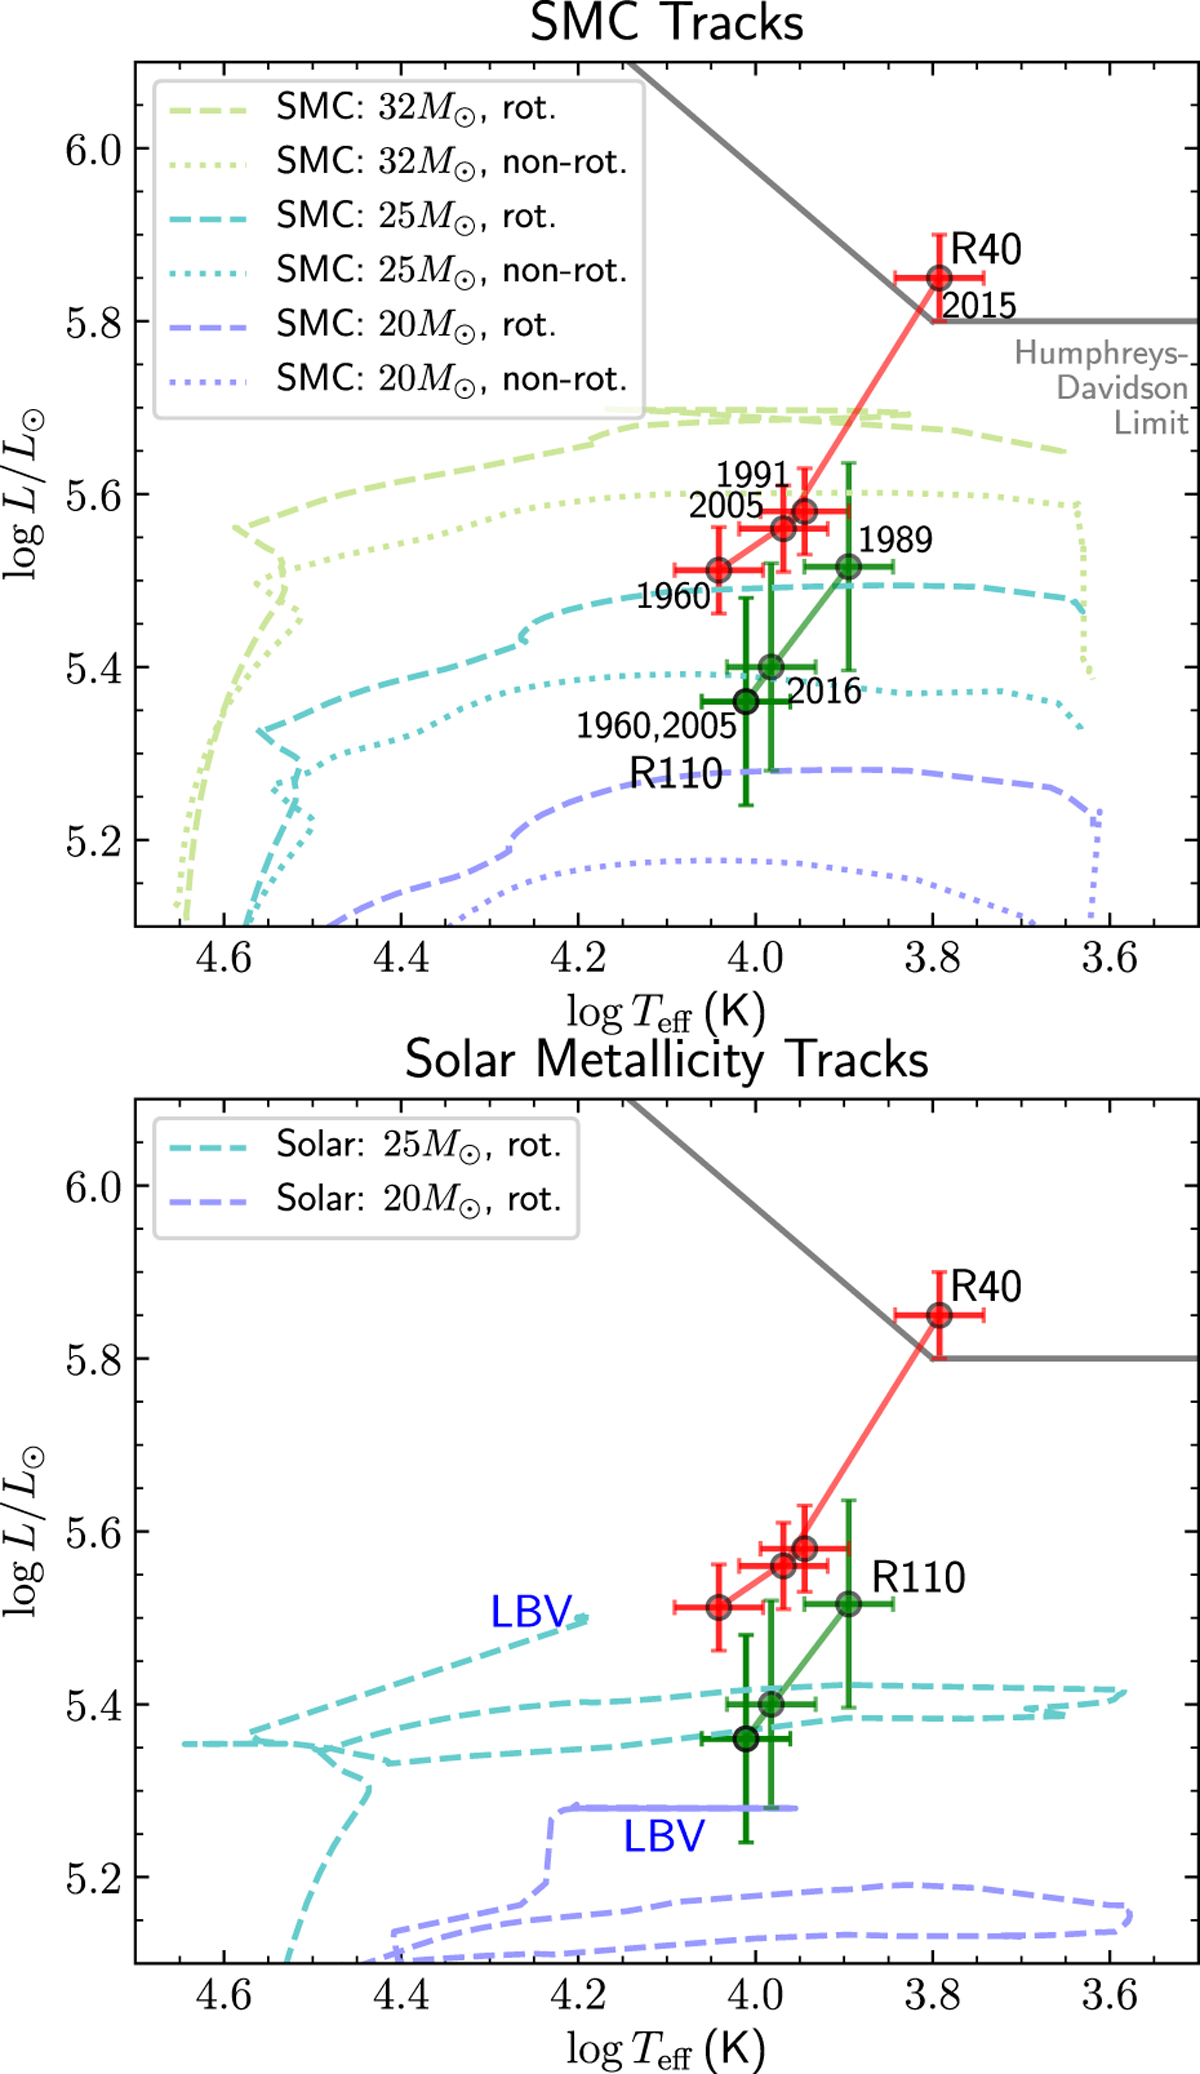
HR diagram showing the position of R 40 and R 110 in different epochs, based on our estimations. The Humphreys–Davidson limit is shown as a gray line. In addition, evolutionary tracks with rotation of vrot,ZAMS = 0.4 vcrit (dashed lines) and without rotation (dotted lines) for SMC metallicity (Georgy et al. 2013, top panel) and for solar metallicity (Ekström et al. 2012, bottom panel) are also shown. Bottom panel: we indicate the regions where LBV phase may occur according to Groh et al. (2013a).
Current usage metrics show cumulative count of Article Views (full-text article views including HTML views, PDF and ePub downloads, according to the available data) and Abstracts Views on Vision4Press platform.
Data correspond to usage on the plateform after 2015. The current usage metrics is available 48-96 hours after online publication and is updated daily on week days.
Initial download of the metrics may take a while.