Fig. 1
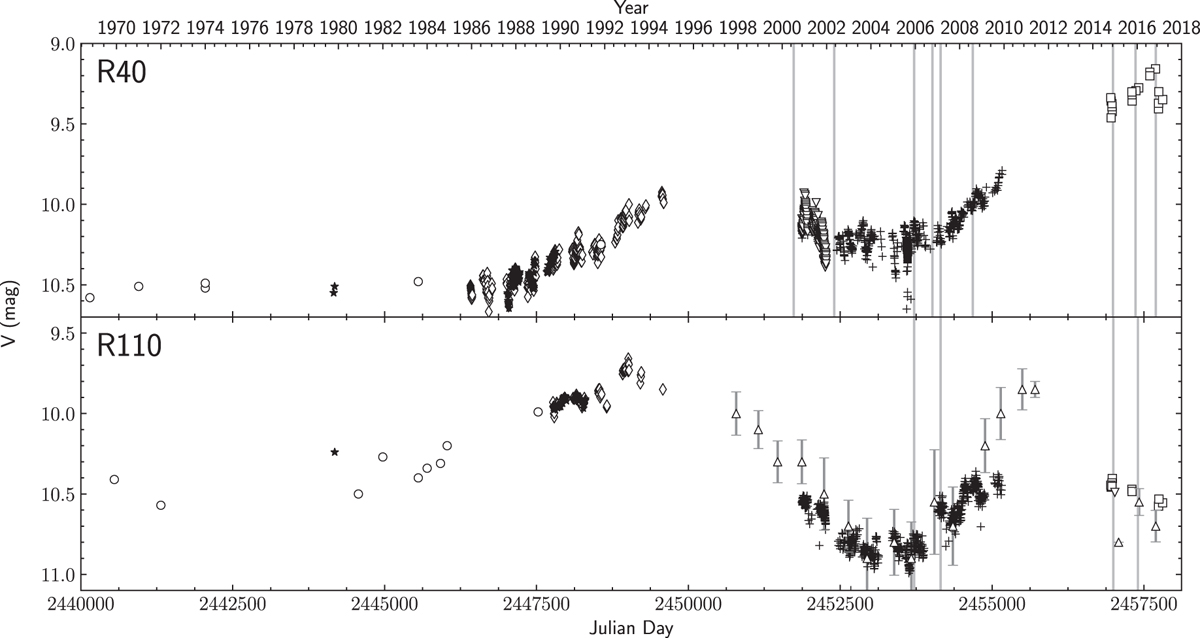
Light curves of R 40 and R 110. Squares indicate OPD/LNA (this work); diamonds indicate LTPV; crosses indicate ASAS; downward triangles indicate AAVSO (V); stars indicate van Genderen (1998); circles indicate references cited in Table 3; and upward triangles indicate the median of the AAVSO (Vis.) data of each year with standard deviation error bars. The vertical lines represent the observation dates of the spectra listed in Table 1.
Current usage metrics show cumulative count of Article Views (full-text article views including HTML views, PDF and ePub downloads, according to the available data) and Abstracts Views on Vision4Press platform.
Data correspond to usage on the plateform after 2015. The current usage metrics is available 48-96 hours after online publication and is updated daily on week days.
Initial download of the metrics may take a while.