| Issue |
A&A
Volume 612, April 2018
|
|
|---|---|---|
| Article Number | L7 | |
| Number of page(s) | 7 | |
| Section | Letters to the Editor | |
| DOI | https://doi.org/10.1051/0004-6361/201732472 | |
| Published online | 07 May 2018 | |
Letter to the Editor
On the formation of runaway stars BN and x in the Orion Nebula Cluster
1
Dept. of Space, Earth & Environment, Chalmers University of Technology,
Gothenburg, Sweden
e-mail: This email address is being protected from spambots. You need JavaScript enabled to view it.
2
Dept. of Astronomy, University of Virginia,
Charlottesville,
VA
22904, USA
Received:
15
December
2017
Accepted:
30
March
2018
Abstract
We explore scenarios for the dynamical ejection of stars BN and x from source I in the Kleinmann-Low nebula of the Orion Nebula Cluster (ONC), which is important because it is the closest region of massive star formation. This ejection would cause source I to become a close binary or a merger product of two stars. We thus consider binary-binary encounters as the mechanism to produce this event. By running a large suite of N-body simulations, we find that it is nearly impossible to match the observations when using the commonly adopted masses for the participants, especially a source I mass of 7 M⊙. The only way to recreate the event is if source I is more massive, that is, ~20 M⊙. However, even in this case, the likelihood of reproducing the observed system is low. We discuss the implications of these results for understanding this important star-forming region.
Key words: methods: numerical / stars: formation / stars: kinematics and dynamics
© ESO 2018
1 Introduction
The Kleinmann-Low (KL) Nebula is a well-studied region in the Orion Nebula Cluster (ONC) because it is the closest, ≃400 pc (Menten et al. 2007; Kounkel et al. 2017) location where massive stars are forming. In particular, radio source I is likely to be a massive protostar (Churchwell et al. 1987; Garay et al. 1987). Close to the KL Nebula is the Becklin–Neugebauer (BN) object (Becklin & Neugebauer 1967). BN is a young, massive (8.0–12.6 M⊙, Scoville et al. 1983; Rodríguez et al. 2005) star, with fast 3D motion through the ONC of about 30 km s−1, that is, it is a “runaway” star. The origin of this motion has been a matter of debate. One scenario is that BN was dynamically ejected from the θ1 Ori C system (now a binary) in the Trapezium grouping near the center of the ONC about 4000 yr ago (Tan 2004). This hypothesis has been supported with N-body simulations (Chatterjee & Tan 2012), which show that several current properties of θ1 Ori C, including orbital binding energy and recoil proper motion, can be understood to result from the ejection of BN.
An alternative scenario has been proposed by Bally & Zinnecker (2005) and Rodríguez et al. (2005), who suggested that dynamical interaction of BN, source I, and perhaps an additional member, originally proposed to be radio source n, could have resulted in the high proper motions of BN and radio source I that are approximately in opposite directions. Details of this third member are crucial for this scenario since momentum conservation using BN and source I alone results in a mass for source I of ~20 M⊙, in contrast to the 7 M⊙ estimations from gas motions near the source (Matthews et al. 2010; Hirota et al. 2014; Plambeck & Wright 2016).
Recent observations using multi-epoch high-resolution near-IR images from the Hubble Space Telescope (HST; Luhman et al. 2017) have shown high proper motion of another star, source x, that strongly indicate that it was the third member of the multiple system (see Fig. 1). Given the mass of source x (~3 M⊙) and proper motion, now the mass estimation for source I via momentum conservation and from circumstellar disk gas dynamics are in better agreement at ~7 M⊙. It has been also argued that if source I were a loose binary that merged during the interaction, for example, 6 and 1 M⊙ stars, the released potential energy would be more than enough to explain the kinetic energy of the system.
However, there are some aspects of this scenario that appear questionable. In particular, it involves the most massive star, BN, being ejected as a single star from a binary of two stars with much lower mass, that is, with total mass of ~7 M⊙. Thus in this paper we carry out numerical experiments to explore this scenario. We focus on the case where a binary source I (with components I1 and I2) interacted with another binary composed of BN and source x in a bound system that resulted in the dynamical ejection of source x and BN.
We present a set of ~107 pure N-body scattering simulations focused on the possible binary-binary interaction event that formed the observed system. We first test the scenario presented by Luhman et al. (2017) and then modify some of the parameters, especially the mass of source I, to test the sensitivity of the results. We describe our methods and initial conditions in Sect. 2, present our results in comparison to the observed system in Sect. 3, and discuss our findings and draw conclusions in Sect. 4.
2 Methods
We explore the scenario in which the ejection of BN and source x was caused by a dynamical decay of a multiple system that included source I, which was two stars in the past that may have merged as a result of the dynamical interaction. Ignoring situationswith preexisting triplets and higher-order multiples that require large numbers of parameters for their description, three possible cases can be considered as initial conditions for this event involving four members. Case 1: a binary-binary interaction; case 2: a binary system perturbed by two single stars; and case 3: all stars were single stars. For simplicity, we explore onlythe first case, which is arguably the most probable since it involves close interaction of only two initially independent systems. Cases 2 and 3 involve the coordinated close encounter of three and four systems, respectively,which makes them intrinsically less likely. Thus, we do not consider cases 2 and 3 further in this letter.
Within case 1, three initial combinations are possible that we label A: [I 1 I 2 ][BN x], B: [I 1 BN ][I2 x], and C: [I 1 x][I2 BN], where [a b] indicates a binary pairing of stars a and b. We look for interactions that result in the outcome [I 1 I 2 ] BN x, that is, with the ejection of BN and x leaving the binary [I1 I2] with or without a merger, which we refer to as BNx-ejection. From this subset of cases we identify those in which the velocities of the individual stars are within 2σ of the observed values reported by Luhman et al. (2017) and Rodríguez et al. (2017) as BNx-velocity.
For our fiducial case, we adopted the same masses discussed by Luhman et al. (2017), that is, mx = 3 M⊙, mBN = 10 M⊙ and mI = 7 M⊙ (Matthews et al. 2010; Hirota et al. 2014; Plambeck & Wright 2016). Assuming that source I was two stars, binary or not, we assumed a mass ratio q = 0.166 for its members (i.e.,  and
and  ), but we also tested a range of other values without finding major change in the results due to this choice. The radii of the individual stars were taken from stellar models developed by Hurley et al. (2000). We assumed that I1 and I2 are protostars or pre-main-sequence stars and thus increased their radius by a factor η ≥ 1 to account for the more extended radii that a protostar should have relative to a main-sequence star of the same mass, adopting η = 2 as a simple, fiducial choice. We also tested the sensitivity of our results to this factor without finding a major difference on the results except when this becomes ≥3, at which point the energy of ejections decreases considerably.
Given the previous assumptions, there are then several combinations of parameters that set the initial conditions of each experiment. Our standard procedure was to choose them randomly from expected distributions, summarized as follows: (1) The semimajor axis a of each binary was taken from a uniform, random distribution in logarithmic space in the range a = 0.1 − 6300 AU. (2) The eccentricity of each binary was chosen using two extreme distributions: A) Using only circular orbits, that is, ei = 0, which might be expected if binaries formed via circumstellar disks. B) A thermal distribution (Heggie & Hut 2003), that is, d Fb ∕de = 2e, which is the extreme scenario in which binary systems have had enough time to thermalize via stellar encounters. (3) The direction of the angular momentum vector of each binary was chosen randomly, as was (4) the initial orbital phase of the binaries. The above parameters define the internal properties of each binary.
Next come the parameters that define the interaction itself. We set up the experiments in order to only have initially bound systems, that is, if both binaries were single stars, they would remain bound after the interaction. Therefore, (5) the relative velocity at infinity vi was drawn from a Maxwell–Boltzmann velocity distribution with σ = 3 km s−1 truncated at the critical velocity
 (1)
(1)
where G is the gravitational constant, m1 = m11 + m12 and m2 = m21 + m22 are the masses of each binary, summing their respective components, and μ = (m1 + m2)∕(m1m2) is the reduced mass of the system (see Gualandris et al. 2004). Thus vc is the velocity below which the total energy of the system in the four-body center of mass is negative, and therefore the ejected stars are the result of dynamical interaction and not of the initial conditions. Full ionization is not possible either, meaning that there will always be a binary (or merged stars) left behind.
Next is (6) the impact parameter, b, which was drawn randomly in discrete bins of radii bi = 2i∕2b0 following the method of McMillan & Hut (1996) to calculate cross sections of the relevant interactions. We chose b0 = 100 AU and increased i until no relevant outcomes were encountered. Then, the contribution of the events in each bin i to the final cross section of this event ΣX is  , with NX,i and Ni being the number of events X and the number of trials, respectively, both inside the ith bin. The contribution of bin i to the squared uncertainty in the calculation,
  , is
, is ![Mathematical equation: $[\pi(b_{i}^2-b_{i-1})/N_i]^2N_{{\textrm{X}},i}$](/articles/aa/full_html/2018/04/aa32472-17/aa32472-17-eq6.png) (McMillan & Hut 1996). For the first bin we chose Ni=1 = 500 000.
(McMillan & Hut 1996). For the first bin we chose Ni=1 = 500 000.
Simulations were performed using the Fewbody software (Fregeau et al. 2004), an accurate Runge-Kutta integrator that conserves energy and angular momentum to the order of 10−8. It also uses the “sticky star” approximation for collisions with no mass loss and an expansion factor of the merger product of fexp = 2.
This method was repeated for different combinations of the member masses. All these combinations with their respective total momentum vectors are shown in Fig. 1.
 |
Fig. 1 Overview of the ejection scenario, also showing the center-of-mass motion given different combinations of masses explored in this work. Filled circles show actual positions of the stars and of the center of mass, dashed lines track the positions 540 yr ago (1σ error cones shown for BN, I, and x), and solid lines with arrows show 100 yr into the future based on current proper motions in the rest frame of Orion (see Luhman et al. 2017). Different colors show various mass combinations of the stars that we have explored. Positions are relative to source I (α(J 2000) = −05h35m14.s516 and δ(J 2000) = −05°22′30.″59, Rodríguez et al. 2017). |
3 Results
Table 1 summarises the resulting interaction cross sections and branching ratios (BR), that is to say, the number of cases over the total number of simulations for each configuration, for the BNx-ejection and BNx-velocity cases. The interaction cross sections of the BNx-ejection case are considerablylarger for case A, with ΣBNx-ejection = (2.8 and 1.8) × 106AU2 for the fiducial (i.e.,mBN = 10 M⊙, mI = 7 M⊙, mx = 3 M⊙) circular and thermal cases, respectively. Such large cross sections, together with branching ratios of several percent of the BNx-ejection event in the fiducial case that we show in Fig. A.1 and discuss further in Appendix A, imply that the ejection of the massive BN object and source x from the system is quite possible.
However, when considering the velocities of the ejected stars in the BNx-velocity case, the cross sections drop to ~ 1 AU2 in all fiducial cases. We have checked that this result is independent of the assumed mass ratio of the source I components. Furthermore, if η is greater, then the chance of obtaining the observed velocities becomes even smaller because of the energy constraints that the radii of the stars imply. We found that to match the observed velocities, the parameter η must be no larger than 3, meaning that for a given mass, the protostars should not have radii larger than three times the radii of a main-sequence star of the same mass.
The situation becomes more favorable only if the mass of source I is > 7 M⊙. In the best case we explored, with mI = 20 M⊙ cross sections increase by a factor between ~20 to 600 in the different initial configurations. However, the cross-sectional areas are still small, ~10 to 50 AU2, which means that these events are quite rare when compared to the whole ensemble of outcomes. In Appendix A we present and discuss the branching ratios of all the possible outcomes of our experiments sorted from the most to least probable.
Interaction cross sections for the different mass combinations.
4 Discussion and conclusions
Our simulations indicate that a more massive source I has a better chance to produce the observed system. Figure 2 shows a scatter plot of the velocities obtained in each setup when the mass of source I is varied. The yellow star and error bars show the observed system. A very specific trend appears in the vBN − vI panels in Fig. 2, showing that the observed system appears to be one order of magnitude above the trend for source I that has a mass of 7 M⊙. Increasing the mass of source I naturally places simulations in agreement with observations. Even though we have shown that this type of event is quite rare in terms of branching ratios with respect to all possible outcomes, if by chance it happens with the correct released energy, the observed velocities would only be achieved if the mass of source I is not so low. This is also supported by the other velocity panels in all the cases A, B, and C.
Some caveats associated with our analysis should be mentioned. For example, we have ignored the dynamical effects of gas expulsion. The modeling of Chernoff et al. (1982) implies that about 4 M⊙ of gas has been ejected from the central region over a period of 1200 yr, requiring an energy of ≳ 5 × 1047 erg. If a large portion of this gas was ejected impulsively at the time of dynamical interaction, then this could alter some of the specific results of our analysis: for instance, an even greater energy needs to be liberated in the dynamical interaction. However, we note that the gas has been ejected quasi-isotropically from BN-KL (see, e.g., Allen & Burton 1993; Bally et al. 2017), so that the effects on the plane-of-sky momentum analysis are not expected to be so large. Still, future modeling could allow for a variable mass of stars during the interaction, for example, that is, sudden mass loss occurring aspart of any merger event. Other caveats include that we have ignored the dynamical effects of any other masses, including other surrounding stars and gas components. Still, these are expected to be relatively minor since the velocities of the stars are relatively high compared to the velocity dispersion of the ambient material in the region.
The recent evidence that source x was involved in the ejection of the BN object appeared to reconcile the incongruence between the mass of source I estimated by momentum analysis and estimations via rotation of its putative circumstellar disk. However, if we repeat the momentum analysis with the new data, we can see that the participation of source x is not enough support for the low-mass estimates of source I. Figure 3 shows the momentum analysis for the old and new scenarios as a function of source I mass. Blue lines shows the scenario where only source I and BN participated in the ejection with the upper and lower limits on the mass of BN as dashed lines. The only way in which the system center of mass can be moving within the velocity dispersion of the ONC (black solid line) is if the mass of source I is at least 20 M⊙. Now, it has been argued that the inclusion of source x would remove this constraint. The former is true, as we can see in the red lines on Fig. 3, however, for the system to be moving within the velocity dispersion of the ONC,the mass of source I might be in a very wide range of masses, from 5 to 25 M⊙ with a minimum near 14 M⊙.
Figure 1 shows the present center of mass with different mass combinations used in this work. If the individual masses are those adopted by (Luhman et al. 2017; blue arrow) the system is moving mostly outward, away from the center of the ONC. However, if source I is more massive (red and green arrows), the system velocity points towars the center of the cluster, that is, toward the Trapezium. We consider that a scenario involving infall of a dense molecular gas core from which the protostars are forming is more likely than one involving motion of the core out from the cluster center. For example, a passage near the strong ionizing radiation from θ1 C is expected to have had potentially very disruptive effects on the core if it had previously been located near the Trapezium.
In conclusion, we have shown that the ejection of BN and x from source I (as a binary or merged binary) as presented by Luhman et al. (2017), i.e., with a relatively low mass for source I of ~ 7 M⊙ that is lower than the mass of BN, is in general a very unlikely event. In particular, with the given masses and observed velocities, it is nearly impossible to reproduce the observations with the binary-binary interactions we have considered. If the interaction occurred as we have explored, then it is more probable that source I is much more massive than the preferred value of 7 M⊙ presented by Luhman et al. (2017) and others. Thus future measurements of the mass of source I are needed to better constrain this proposed ejection scenario.
However, other possible initial combinations remain to be explored, e.g., a binary perturbed by two stars (i.e., effectively a three-body initial interaction), or all initial single stars (i.e., a four-body initial interaction), but these are expected to be inherently rarer and there is no reason to think these combinations could increase the chances significantly since the binary-binary interaction is the most likely to release the necessary energy to produce the ejection. A single star interacting with a pr-existing triplet remains a possibility that needs to be considered, especially if the dynamical mass of source I does turn out to be at the low end of the range modeled, that is, ~ 7 M⊙. Such interactions could also include unbound fly-bys. This would be the only way to reconcile the scenario of BN’s ejection from θ1 C (Tan 2004; Chatterjee & Tan 2012) with ejection of source x, although plane-of-sky momentum conservation would appear to place challenging constraints on such a model if BN suffered only minor accelerations and course deflections in such a fly-by.
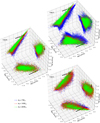 |
Fig. 2 Simulation results compared with observed velocities. Case A, B, and C panels show the resulting velocities that match the BNx-ejection event in the three velocity planes for sources I, x, and BN for each respective initial combination, varying only the mass of source I. Crosses and filled circles represent the adopted eccentricity distribution with thermal and circular eccentricities, respectively. The yellow star and error bars show the observed values with their standard error. Highlighted symbols represent BNx-velocity matches. Black error bars show the range in which BNx-velocity was searched, i.e., 2σ errors. |
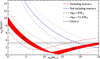 |
Fig. 3 System (center of mass) velocity as a function of the mass of source I (see also Fig. 1). Red lines show the scenario where source x is part of the ejection event, as suggested by Luhman et al. (2017)1. The red shaded area shows the result of varying the mass of source x between 2.5–3.0 M⊙, and the black arrows show the direction of the increment. Blue lines show the scenario in which source x is not part of the event. In the red and blue cases, the dashed and dot-dashed lines show results of adopting the lower and upper limits on the mass of BN, respectively (Rodríguez et al. 2005). |
Appendix A: Branching ratios for all the possible outcomes
By calculating interaction cross sections for the BNx-ejection case, we have obtained many interactions on the order of a few millions per simulation set with impact parameters from near zero to as large as thousands of AU, by which point no interesting interaction happens. With this large set of simulations, we can calculate branching ratios of rare interactions down to ~ 10−6. We have classified the outcomes of each experiment using a similar classification as Fregeau et al. (2004), but distinguish the cases where there was an exchange of members or a capture of one of the members by one of the binary systems. Figure A.1 shows all the possible outcomes in this study sorted from the most to the least probable in our fiducial case with circular orbits. This trend is similar for the setups with thermal eccentricities. Figure A.1 shows that these models with thermal eccentricities have a greater chance to obtain a merger, but not in outcomes that could form the observed BN-x-I system.
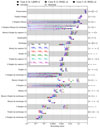 |
Fig. A.1 Branching ratios collected for all possible outcomes and experiments carried out in this work. Results are sorted from the most to the least probable in the fiducial case (blue filled circle). Different symbols represent the different initial configurations: Case A (circles), case B (diamonds), and case C (squares). Open symbols show cases with thermal distribution of eccentricities, while filled symbols show where all binaries have circular orbits initially. Colors show the different assumed masses (see legend). The left axis labels are the names used to refer to each outcome with the number of collisions needed for each outcome appearing in parentheses. The right labels show the schematic representation of each outcome, similar to Fregeau et al. (2004), but we distinguish between exchange of members or preservation of membership of the original binaries. The branching ratios of cases that match the BN-x-I observed configuration are a subset of some of the listed outcomes; these are connected to their parent outcome by a line (dashed for open symbols, solid for filled symbols). We mark outcomes where no matching velocity was found with a left triangle, denoting the upper limit of their branching ratio. Thus only the outcomes that contain horizontal lines have some chance of producing the observed BN-x-I system, although typically, we only have upper limits on the branching ratio that leads to the observed system. |
In all setups, the most probable case is preservation i.e., the configuration of each setup does not change, happening ~ 50% of the time, followed by the “Triplet+Single” case, that is, the formation of a stable triplet by capturing one member of the other binary (~20%). Our case of interest for case A, that is, “2 Singles+Binary”, comes in third place, happening ~ 10% of the time. [I1 I2]BN x is a subset of this case. The branching ratio of this specific subset is marked with the same symbol connected by a line to the parent set in Fig. A.1. The end of the line shows the branching ratio of the subset that also matches the observed velocities within 2σ. A left triangle marking the end of the line means that we did not find any velocity match for this case and the branching ratio is lower than the position of the symbol. The branching ratio of [I 1 I 2 ]BN x is quite high (~4.5%), this means that the case where the most massive star (BN) is ejected is not so rare. However, it is almost impossible to match the observed velocities in this particular case with the masses assumed by Luhman et al. (2017). Increasing the mass of source I considerably improves the chances of obtaining the observed velocities, going from a branching ratio of < 4 × 10⁻⁷ that is, not a single case with mI = 7 M⊙ to a branching ratio of ~2 × 10⁻⁵ for mI = 20 M⊙ (with  and
and  ).
).
The matching outcome for cases B and C without a merger involves an exchange of members, which makes the outcome less frequent, but still comparable with the original case. The mass of source I also influences the branching ratios of the matching velocity outcomes, favoring the cases where source I is more massive.
This trend also remains the same when considering a merger between I1 and I2, see the “3 Singles” case in Fig. A.1. Even though the branching ratios of these cases are lower, the chances of obtaining the matching velocities are higher since it is the extreme case where most of the potential energy stored by the binary is released to the system members. How much energy is set by the semimajor axis and also individual radius of the source I original stars. For this situation, the radii of the protostars, parameterized by the factor η, is one of the largest unknowns in the system and one of the most important, since it sets the upper limit on the amount of energy the source I merger can provide.
References
- Allen, D. A., & Burton, M. G. 1993, Nature, 363, 54 [NASA ADS] [CrossRef] [Google Scholar]
- Bally, J., & Zinnecker, H. 2005, AJ, 129, 2281 [NASA ADS] [CrossRef] [Google Scholar]
- Bally, J., Ginsburg, A., Arce, H., et al. 2017, ApJ, 837, 60 [NASA ADS] [CrossRef] [Google Scholar]
- Becklin, E. E., & Neugebauer, G. 1967, ApJ, 147, 799 [NASA ADS] [CrossRef] [Google Scholar]
- Chatterjee, S., & Tan, J. C. 2012, ApJ, 754, 152 [NASA ADS] [CrossRef] [Google Scholar]
- Chernoff, D. F., McKee, C. F., & Hollenbach, D. J. 1982, ApJ, 259, L97 [NASA ADS] [CrossRef] [Google Scholar]
- Churchwell, E., Felli, M., Wood, D. O. S., & Massi, M. 1987, ApJ, 321, 516 [NASA ADS] [CrossRef] [Google Scholar]
- Fregeau, J. M., Cheung, P., Portegies Zwart, S. F., & Rasio, F. A. 2004, MNRAS, 352, 1 [NASA ADS] [CrossRef] [Google Scholar]
- Garay, G., Moran, J. M., & Reid, M. J. 1987, ApJ, 314, 535 [NASA ADS] [CrossRef] [Google Scholar]
- Gualandris, A., Portegies Zwart, S., & Eggleton, P. P. 2004, MNRAS, 350, 615 [NASA ADS] [CrossRef] [Google Scholar]
- Heggie, D., & Hut, P. 2003, The Gravitational Million-Body Problem: A Multidisciplinary Approach to Star Cluster Dynamics (Cambridge: Cambridge University Press) [Google Scholar]
- Hirota, T., Kim, M. K., Kurono, Y., & Honma, M. 2014, ApJ, 782, L28 [NASA ADS] [CrossRef] [Google Scholar]
- Hurley, J. R., Pols, O. R., & Tout, C. A. 2000, MNRAS, 315, 543 [NASA ADS] [CrossRef] [Google Scholar]
- Kounkel, M., Hartmann, L., Loinard, L., et al. 2017, ApJ, 834, 142 [NASA ADS] [CrossRef] [Google Scholar]
- Luhman, K. L., Robberto, M., Tan, J. C., et al. 2017, ApJ, 838, L3 [NASA ADS] [CrossRef] [Google Scholar]
- Matthews, L. D., Greenhill, L. J., Goddi, C., et al. 2010, ApJ, 708, 80 [NASA ADS] [CrossRef] [Google Scholar]
- McMillan, S. L. W., & Hut, P. 1996, ApJ, 467, 348 [NASA ADS] [CrossRef] [Google Scholar]
- Menten, K. M., Reid, M. J., Forbrich, J., & Brunthaler, A. 2007, A&A, 474, 515 [NASA ADS] [CrossRef] [EDP Sciences] [Google Scholar]
- Plambeck, R. L., & Wright, M. C. H. 2016, ApJ, 833, 219 [NASA ADS] [CrossRef] [Google Scholar]
- Rodríguez, L. F., Poveda, A., Lizano, S., & Allen, C. 2005, ApJ, 627, L65 [NASA ADS] [CrossRef] [Google Scholar]
- Rodríguez, L. F., Dzib, S. A., Loinard, L., et al. 2017, ApJ, 834, 140 [NASA ADS] [CrossRef] [Google Scholar]
- Scoville, N., Kleinmann, S. G., Hall, D. N. B., & Ridgway, S. T. 1983, ApJ, 275, 201 [NASA ADS] [CrossRef] [Google Scholar]
- Tan, J. C. 2004, ApJ, 607, L47 [NASA ADS] [CrossRef] [Google Scholar]
Note that there is an error in the units for the velocity associated with the specific momentum that they mention: it should be 1.4 mas yr−1 instead of km s−1.
All Tables
All Figures
|
Fig. 1 Overview of the ejection scenario, also showing the center-of-mass motion given different combinations of masses explored in this work. Filled circles show actual positions of the stars and of the center of mass, dashed lines track the positions 540 yr ago (1σ error cones shown for BN, I, and x), and solid lines with arrows show 100 yr into the future based on current proper motions in the rest frame of Orion (see Luhman et al. 2017). Different colors show various mass combinations of the stars that we have explored. Positions are relative to source I (α(J 2000) = −05h35m14.s516 and δ(J 2000) = −05°22′30.″59, Rodríguez et al. 2017). |
| In the text | |
|
Fig. 2 Simulation results compared with observed velocities. Case A, B, and C panels show the resulting velocities that match the BNx-ejection event in the three velocity planes for sources I, x, and BN for each respective initial combination, varying only the mass of source I. Crosses and filled circles represent the adopted eccentricity distribution with thermal and circular eccentricities, respectively. The yellow star and error bars show the observed values with their standard error. Highlighted symbols represent BNx-velocity matches. Black error bars show the range in which BNx-velocity was searched, i.e., 2σ errors. |
| In the text | |
|
Fig. 3 System (center of mass) velocity as a function of the mass of source I (see also Fig. 1). Red lines show the scenario where source x is part of the ejection event, as suggested by Luhman et al. (2017)1. The red shaded area shows the result of varying the mass of source x between 2.5–3.0 M⊙, and the black arrows show the direction of the increment. Blue lines show the scenario in which source x is not part of the event. In the red and blue cases, the dashed and dot-dashed lines show results of adopting the lower and upper limits on the mass of BN, respectively (Rodríguez et al. 2005). |
| In the text | |
|
Fig. A.1 Branching ratios collected for all possible outcomes and experiments carried out in this work. Results are sorted from the most to the least probable in the fiducial case (blue filled circle). Different symbols represent the different initial configurations: Case A (circles), case B (diamonds), and case C (squares). Open symbols show cases with thermal distribution of eccentricities, while filled symbols show where all binaries have circular orbits initially. Colors show the different assumed masses (see legend). The left axis labels are the names used to refer to each outcome with the number of collisions needed for each outcome appearing in parentheses. The right labels show the schematic representation of each outcome, similar to Fregeau et al. (2004), but we distinguish between exchange of members or preservation of membership of the original binaries. The branching ratios of cases that match the BN-x-I observed configuration are a subset of some of the listed outcomes; these are connected to their parent outcome by a line (dashed for open symbols, solid for filled symbols). We mark outcomes where no matching velocity was found with a left triangle, denoting the upper limit of their branching ratio. Thus only the outcomes that contain horizontal lines have some chance of producing the observed BN-x-I system, although typically, we only have upper limits on the branching ratio that leads to the observed system. |
| In the text | |
Current usage metrics show cumulative count of Article Views (full-text article views including HTML views, PDF and ePub downloads, according to the available data) and Abstracts Views on Vision4Press platform.
Data correspond to usage on the plateform after 2015. The current usage metrics is available 48-96 hours after online publication and is updated daily on week days.
Initial download of the metrics may take a while.