Fig. 3
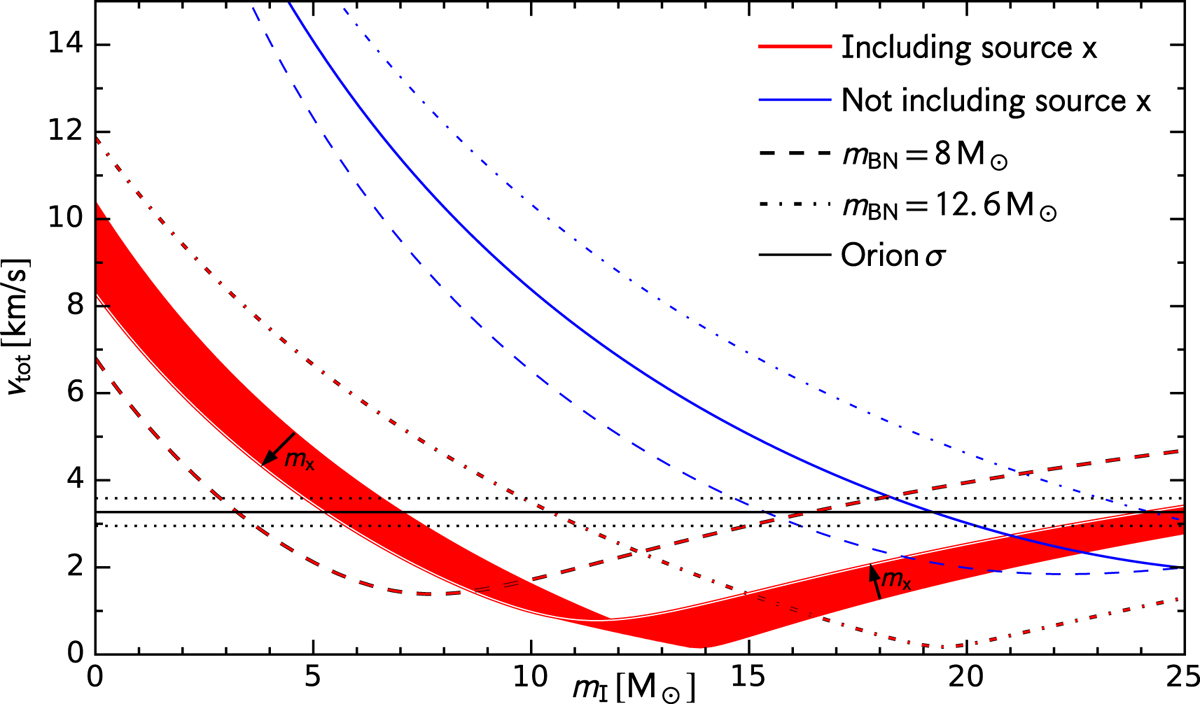
System (center of mass) velocity as a function of the mass of source I (see also Fig. 1). Red lines show the scenario where source x is part of the ejection event, as suggested by Luhman et al. (2017)1. The red shaded area shows the result of varying the mass of source x between 2.5–3.0 M⊙, and the black arrows show the direction of the increment. Blue lines show the scenario in which source x is not part of the event. In the red and blue cases, the dashed and dot-dashed lines show results of adopting the lower and upper limits on the mass of BN, respectively (Rodríguez et al. 2005).
Current usage metrics show cumulative count of Article Views (full-text article views including HTML views, PDF and ePub downloads, according to the available data) and Abstracts Views on Vision4Press platform.
Data correspond to usage on the plateform after 2015. The current usage metrics is available 48-96 hours after online publication and is updated daily on week days.
Initial download of the metrics may take a while.