Fig. 2
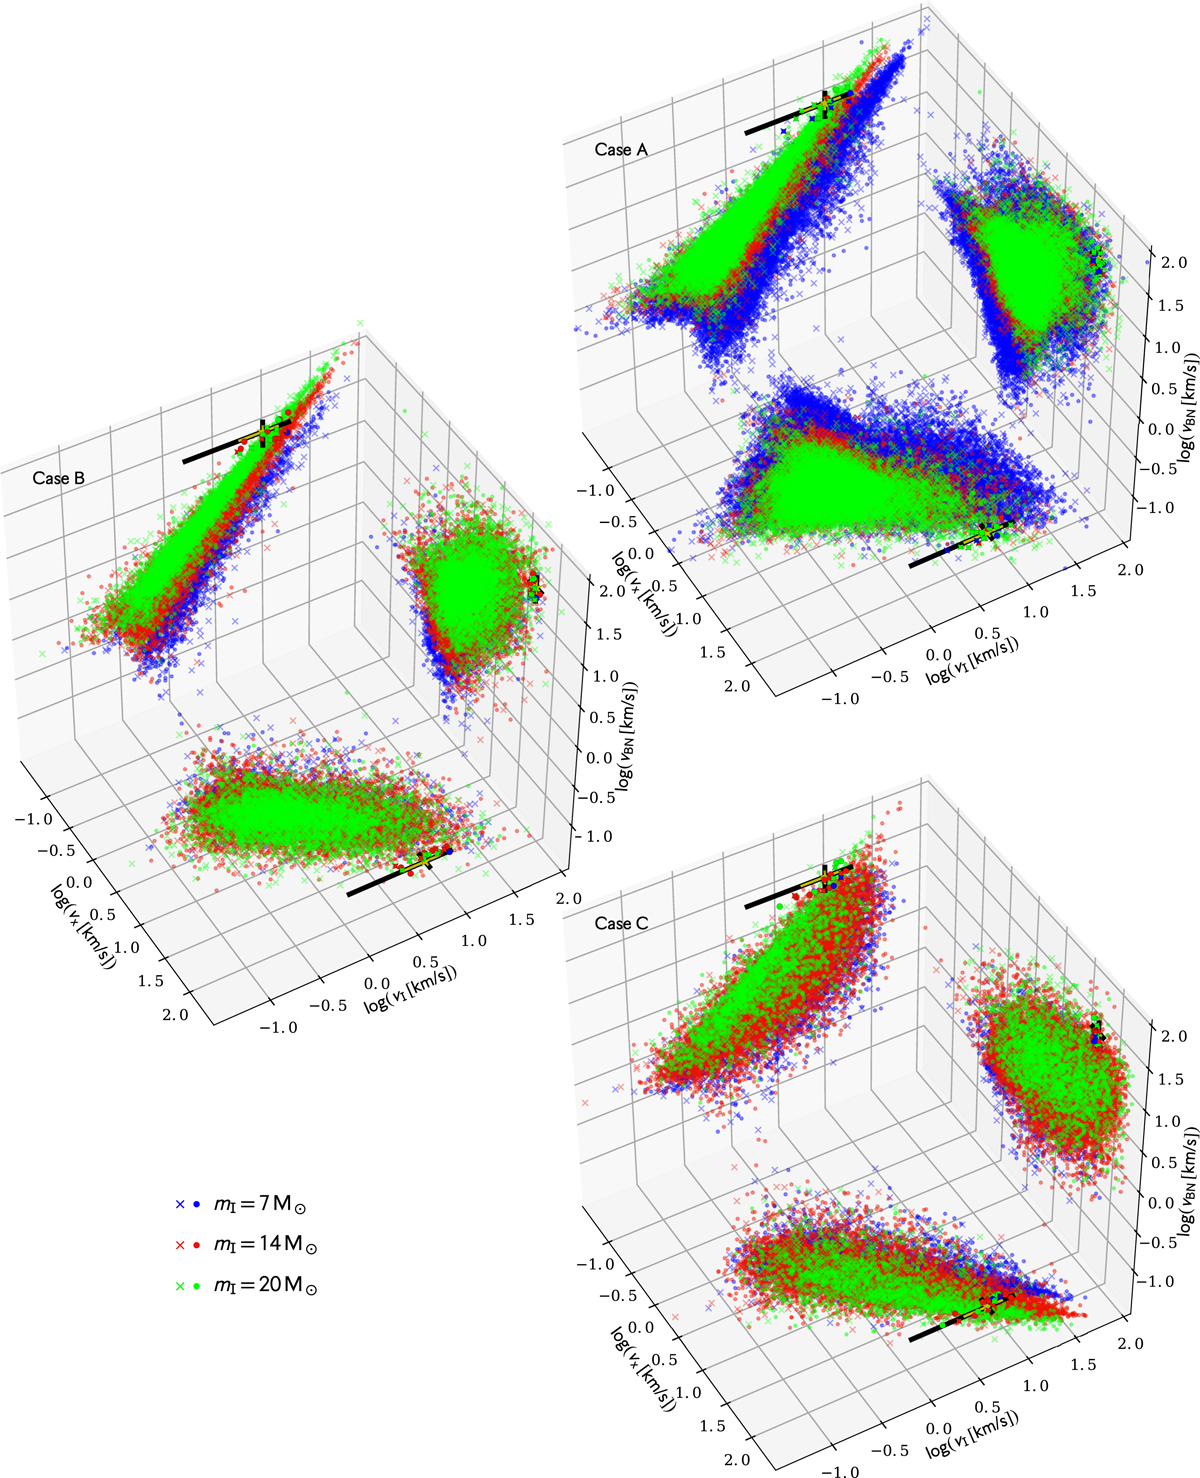
Simulation results compared with observed velocities. Case A, B, and C panels show the resulting velocities that match the BNx-ejection event in the three velocity planes for sources I, x, and BN for each respective initial combination, varying only the mass of source I. Crosses and filled circles represent the adopted eccentricity distribution with thermal and circular eccentricities, respectively. The yellow star and error bars show the observed values with their standard error. Highlighted symbols represent BNx-velocity matches. Black error bars show the range in which BNx-velocity was searched, i.e., 2σ errors.
Current usage metrics show cumulative count of Article Views (full-text article views including HTML views, PDF and ePub downloads, according to the available data) and Abstracts Views on Vision4Press platform.
Data correspond to usage on the plateform after 2015. The current usage metrics is available 48-96 hours after online publication and is updated daily on week days.
Initial download of the metrics may take a while.