Fig. 1
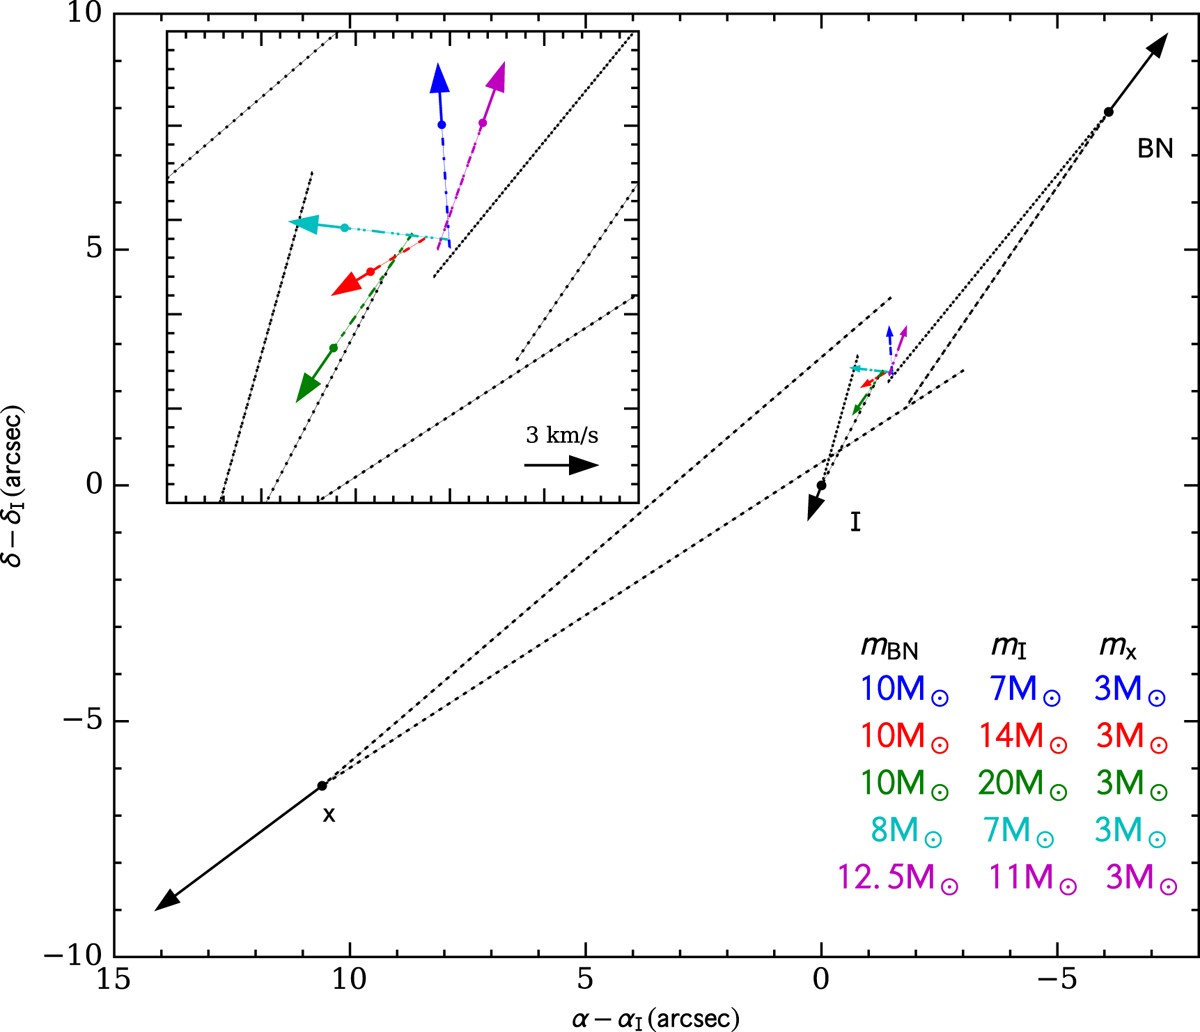
Overview of the ejection scenario, also showing the center-of-mass motion given different combinations of masses explored in this work. Filled circles show actual positions of the stars and of the center of mass, dashed lines track the positions 540 yr ago (1σ error cones shown for BN, I, and x), and solid lines with arrows show 100 yr into the future based on current proper motions in the rest frame of Orion (see Luhman et al. 2017). Different colors show various mass combinations of the stars that we have explored. Positions are relative to source I (α(J 2000) = −05h35m14.s516 and δ(J 2000) = −05°22′30.″59, Rodríguez et al. 2017).
Current usage metrics show cumulative count of Article Views (full-text article views including HTML views, PDF and ePub downloads, according to the available data) and Abstracts Views on Vision4Press platform.
Data correspond to usage on the plateform after 2015. The current usage metrics is available 48-96 hours after online publication and is updated daily on week days.
Initial download of the metrics may take a while.