| Issue |
A&A
Volume 612, April 2018
|
|
|---|---|---|
| Article Number | A96 | |
| Number of page(s) | 23 | |
| Section | Catalogs and data | |
| DOI | https://doi.org/10.1051/0004-6361/201732028 | |
| Published online | 04 May 2018 | |
A spectroscopic survey of the youngest field stars in the solar neighborhood
II. The optically faint sample ★,★★
1
INAF - Osservatorio Astrofisico di Catania,
via S. Sofia, 78,
95123
Catania, Italy
e-mail: antonio.frasca@oact.inaf.it
2
Université de Strasbourg, CNRS, Observatoire astronomique de Strasbourg,
UMR 7550,
67000
Strasbourg, France
3
Dipartimento di Fisica, Università di Torino,
via P. Giuria, 1,
10125
Torino, Italy
4
Departamento de Astrofísica y Ciencias de la Atmósfera, Universidad Complutense de Madrid,
28040
Madrid, Spain
Received:
2
October
2017
Accepted:
28
December
2017
Context. Star formation in the solar neighborhood is mainly traced by young stars in open clusters, associations, and in the field, which can be identified, for example, by their X-ray emission. The determination of stellar parameters for the optical counterparts of X-ray sources is crucial for a full characterization of these stars.
Aims. This work extends the spectroscopic study of the RasTyc sample, obtained by the cross-correlation of the Tycho and ROSAT All-Sky Survey catalogs, to stars fainter than V = 9.5 mag and aims to identify sparse populations of young stars in the solar neighborhood.
Methods. We acquired 625 high-resolution spectra for 443 presumably young stars with four different instruments in the northern hemisphere. The radial and rotational velocity (vsini) of our targets were measured by means of the cross-correlation technique, which is also helpful to discover single-lined (SB1), double-lined spectroscopic binaries (SB2), and multiple systems. We used the code ROTFIT to perform an MK spectral classification and to determine the atmospheric parameters (Teff, logg, [Fe/H]) and vsini of the single stars and SB1 systems. For these objects, we used the spectral subtraction of slowly rotating templates to measure the equivalent widths of the Hα and Li I 6708 Å lines, which enabled us to derive their chromospheric activity level and lithium abundance. We made use of Gaia DR1 parallaxes and proper motions to locate the targets in the Hertzsprung-Russell (HR) diagram and to compute the space velocity components of the youngest objects.
Results. We find a remarkable percentage (at least 35%) of binaries and multiple systems. On the basis of the lithium abundance, the sample of single stars and SB1 systems appears to be mostly (~60%) composed of stars younger than the members of the UMa cluster. The remaining sources are in the age range between the UMa and Hyades clusters (~20%) or older (~20%). In total, we identify 42 very young (PMS-like) stars, which lie above or very close to the Pleiades upper envelope of the lithium abundance. A significant percentage (~12%) of evolved stars (giants and subgiants) is also present in our sample. Some of these stars (~36%) are also lithium rich (A(Li) > 1.4).
Key words: stars: fundamental parameters / stars: chromospheres / stars: pre-main sequence / binaries: spectroscopic / techniques: spectroscopic / X-rays: stars
Based on observations collected at the Italian Telescopio Nazionale Galileo (TNG) operated by the Fundacion Galileo Galilei - INAF (Canary Islands, Spain), at the Observatoire de Haute Provence (OHP, France), and the Osservatorio Astrofisico di Catania (OAC, Italy)
Tables A.1-A.4 are only available at the CDS via anonymous ftp to cdsarc.u-strasbg.fr (130.79.128.5) or via http://cdsarc.u-strasbg.fr/viz-bin/qcat?J/A+A/12/A96
© ESO 2018
1 Introduction
It has been shown that open clusters (OCs) cannot account for the total star formation in the Galaxy, but can only account for about 50% at most; the remaining occur in OB associations (see, e.g., Piskunov et al. 2008; Zinnecker 2008). Although at the end of their parent cloud collapse newly formed stars are located in the same region of space, many events tend to carry these stars away from each other. After they are mixed with the stellar population of the Galactic plane, young stars are hardly distinguishable from older stars. Indeed, their magnitudes and colors are similar to the latter and there is no gas left from the parent cloud that can help to identify the young stars. Other properties related to their young age, such as their kinematics, magnetic activity, infrared (IR) excess, and the presence of lithium in their atmospheres, must be used to spot these stars among the older population.
The most favorite scenario in the recent history of star formation in the solar neighborhood is that of a large structure in which giant molecular clouds generated massive stars about 50 Myr ago. The latter, exploding as supernovae, triggered star formation in a ring-like structure known as the Gould Belt (see, e.g., Comerón & Torra 1994; Bally 2008, and references therein) and cleaned the region around the Sun from the residual gas, generating the local bubble (see, e.g., Bonchkarev 1984; Gehrels & Chen 1993). Many OB associations and star forming regions (SFRs) within 500–600 pc are known to be part of the Gould Belt (Elias et al. 2009; Bobylev 2014).
Most studies on young low-mass stars in the solar vicinity were focused on SFRs or young OCs that represent homogeneous samples in terms of age and chemical composition. However, sparse populations of late-type young stars apparently unrelated to known SFRs and young OCs have been discovered (e.g., Guillout et al. 1998a, and references therein). Various scenarios, such as ejection from their birth sites by close encounters (Sterzik et al. 1995) or by a very fast dispersion of small clouds (Feigelson 1996), have been proposed to explain these sources scattered over the sky. Depending on their sky position, these sources could also be related to star formation in the Gould Belt (e.g., Biazzo et al. 2012a, and references therein).
To pick up isolated young stars scattered over the whole sky, Guillout et al. (1999) cross-correlated the ROSAT All-Sky Survey (RASS; Voges et al. 1999) and the Tycho (or HIPPARCOS) catalogs (ESA 1997). This selection produced the so-called RasTyc and RasHip samples, containing about 14 000 and 6200 active stars, respectively. These samples are very suitable for the study of the large-scale distribution of X-ray active stars in the solar neighborhood and led to the discovery of the late-type stellar population of the Gould Belt (Guillout et al. 1998a,b). A similar approach was followed by Haakonsen & Rutledge (2009) who made a statistical cross-association of the ROSAT bright source catalog with the 2MASS point source catalog (Cutri et al. 2003). However, complementary optical data are absolutely needed for a full and safe exploitation of the huge scientific potential of the RasTyc and RasHip samples, and to search for young field stars unrelated to the main nearby SFRs and young associations.
To this aim we started a large program to follow up spectroscopically a large portion of the RasTyc sample observable from the northern hemisphere. The results of the optically bright (V T ≤ 9.5 mag) subsample were presented in Guillout et al. (2009, hereafter Paper I). In that paper, we analyzed high-resolution spectra of 426 stars with no previous spectroscopic data and found that this sample is mainly composed of stars with ages between 100 and 600 Myr, and there is a minor contribution from an older population (1–2 Gyr). A high percentage of binaries and lithium-rich giants (≈ 30%), which can be considered as contaminants, was also found. Based on their high lithium abundance, we also uncovered seven very young (age ≤ 30 Myr) stars, which appear to be unrelated to any know SFR. Some of these are good post-T Tau candidates and five are likely members of Pleiades or Castor stellar kinematic groups.
In the present paper we extend this study to the optically faint (V >9.5 mag) RasTyc sources. The inclusion of optically fainter sources in the total sample of investigated RasTyc stars improves the statistics and allows us to reach a larger distance or intrinsically fainter objects.
A first result of the optically faint sample was the discovery of four lithium-rich stars packed within a few degrees on the sky in front of an area void of interstellar matter in the Cepheus complex. These stars, which form a homogeneous moving group, are likely 10–30 Myr in age. We published a preview of the results for these four stars in Guillout et al. (2010), but we include these four stars in the present paper where additional spectra have also been analyzed.
The paper is organized as follows. In Sect. 2 we present the data set and a brief description of the observations and spectra reduction. In Sect. 3 we describe the analysis aimed at measuring radial and rotational velocities (Sects. 3.1 and 3.2), atmospheric parameters (Sect. 3.3), chromospheric emission fluxes, and lithium equivalent widths (Sect. 3.4). The results are presented in Sect. 4, where the properties and evolutionary status of the targets are discussed on the basis of their position on the Hertzsprung-Russell (HR) diagram (Sect. 4.2), abundance of lithium and Hα emission (Sects. 4.3 and 4.6), kinematics (Sect. 4.8), and spectral energy distribution (SED; Sect. 4.7). The main conclusions are summarized in Sect. 5. Individual notes on the youngest stars in our sample can be found in Appendix B.
2 Observations and reduction
We used the RasTyc catalog (Guillout et al. 1999) to obtain a statistically significant sample of the youngest field stars in the solar neighborhood. We adopted the criteria described in Paper I to select the optically fainter sources to be investigated spectroscopically for this study. These criteria are briefly summarized as
-
declination Δ ≥ 0° to observe the targets with telescopes located in the northern hemisphere;
-
right ascension between 15 h and 8 h;
-
 , which is the range in which the lithium λ6707.8 Å line can be used as an age indicator;
 -
ROSAT PSPC count rate greater than or equal to 0.03 cts s−1 to avoid RASS scanning bias (see Guillout et al. 1999); and
-
V T ≤ 10.5 mag, since the Tycho catalog is largely incomplete above this limit.
As we observed many targets from La Palma, the first selection criterion has been slightly relaxed, such that this sample also contains some objects with negative declination (Δ ≥−15°). This allowed us to compare our results with those of the SACY survey (Torres et al. 2006) of southern stellar X-ray sources.
We made a detailed search of previous data and works dealing with these sources in the Simbad and Vizier astronomical databases. We did not observe the stars whose physical parameters were already derived in the literature from high-resolution spectra. However, a few stars with published high-resolution spectra are present in our list either because they were purposely selected for comparison with the results of previous surveys or because their data were published after the approval of our observation proposals. Moreover, when two stars of similar brightness are located near the X-ray source within the typical ROSAT positional accuracy of 30′′ (Voges et al. 1999),we decided to observe both of them.
We observed 134 optically faint stars from November 2001 to August 2005 with the spectrograph AURELIE at the 1.52 m telescope at the Observatoire de Haute Provence (OHP, France; see Paper I for details) and 178 stars with SARG, the high-resolution spectrograph at the 3.5 m TNG telescope (Canary Islands, Spain), in 20073. We chose the SARG setup with the yellow grism and the slit width of 0. ′′ 8, which provides a resolving power of R = λ∕Δλ ≃ 57 000 and a spectral coverage in the range 4600–7900 Å. Exposure times ranged from 4 to 35 minutes, according to the star magnitude, and allowed us to reach a signal-to-noise (S/N) ratio from 50 to 110, also depending on the seeing and sky conditions. Ten stars were observed in August 2009 and June 2011 with SARG and the red grism, which covers the wavelength range 5500–11 000 Å4. We adopted the same slit as for the previous spectra.
Moreover, 140 spectra of 120 RasTyc stars were acquired in 2000 and 2001 with the ELODIE échelle spectrograph (R ≃ 42 000) at the 1.93 m OHP telescope. Sixty-four of these targets with V ≤ 9.5 mag were included in the bright RasTyc survey (Paper I). The atmospheric parameters reported in that work were derived with the TGMET online analysis software (Katz et al. 1998) running at the 1.93 m OHP telescope. However, in the present paper we analyzed in a homogeneous way both the optically bright and faint ELODIE targets, which are all included in this study and listed in Tables A.1–A.4. Likewise, a few sources (about 25 in total) brighter than V = 9.5 mag without previous spectroscopic information or with incomplete data in Paper I were also observed with the other spectrographs and included in the present work.
Further observations of 30 sources were conducted in 2008 and 2009 at the 0.91 m telescope of the Osservatorio Astrofisico di Catania (OAC, Italy) with the FRESCO spectrograph that covers the spectral range 4250–6850 Å with a resolution R ≃ 21 000. The S/N ratio of these spectra is in the range 40–80.
In the present paper we used a total of 625 spectra of 443 different sources taken with the aforementioned instruments, while more than 1660 spectra were acquired during about ten years for the full program (bright+faint samples). We present a concise log of the observations in Table 1.
We were not able to observe the full sample of faint RasTyc sources selected according to the above criteria and about 40 stars, i.e., ~10% of the sample, remained unobserved. Although a few other very young stars could have been found among this sample, the lack of their data is not expected to significantly bias our results.
Details on the reduction of spectra acquired at OHP can be found in Paper I.
The reduction of the SARG and FRESCO spectra was basically carried out inside the IRAF5 package, following standard steps of overscan and bias subtraction, flat-field division, and scattered light subtraction. The extraction of the spectra from the prereduced images was performed with the ECHELLE task of IRAF, which allowed us to subtract thesky spectrum that was extracted from the two sides of the stellar spectrum.
Because of the gap between the two CCDs of SARG, which causes the lost of more than one échelle order, the reduction of the red and blue chip was performed separately. We paid particular care to the correction for the fringes at red and near-IR wavelengths and to the merging of échelle orders, which was very important for the analysis of broad lines that are close to the edges of spectral orders, such as the hydrogen Hα line. For these tasks we developed ad hoc tools in IDL6 environment. In particular, the fringe removal was accomplished by means of contemporaneous flat-field spectra that were rectified by low-order polynomial fits to obtain the fringing pattern. We optimized the fringe-correction procedure on spectra of hot and rapidly rotating stars.
Spectra of rapidly rotating AB stars (templates for telluric subtraction) and of radial and rotational velocity standard stars were also acquired with all spectrographs and were used for data analysis.
The telluric water vapor lines at the Hα and Na I D2 wavelengths were subtracted using an interactive procedure described by Frasca et al. (2000) and adopting the well-exposed telluric templates acquired during the observing runs. The broad and shallow spectral lines of the latter were removed by high-order polynomial fits.
Observing log for the full program (bright + faint sample).
3 Data analysis
We made ananalysis of the spectra with different purposes: i) to measure the radial velocity (RV) and the projected rotational velocity (v sin i); ii) to determine the basic atmospheric parameters (Teff, log g, and [Fe/H]); iii) to evaluate the photospheric lithium content; and iv) to define the level of chromospheric activity.
We used various techniques and reached different goals and accuracies for single stars, double-lined spectroscopic binaries (SB2), and triple (SB3) or multiple systems.
3.1 Radial velocity
The measurement of RV for AURELIE and ELODIE spectra was already described in Paper I. It is based on the use of a numerical mask or a synthetic spectrum as RV template. For the ELODIE spectra this task is normally carried out by the online reduction pipeline just after the acquisition of the spectrum.
For the SARG and FRESCO échelle spectra, the RV was measured by means of the cross-correlation between the target spectrum and a template chosen among a list of spectra of RV standard stars (Table 2) that were observed with the same instrument and in the same seasons as our targets. All these stars are slow rotators and display a very low or negligible level of magnetic activity such that they were also used as non-active templates (Sect. 3.4). The cross-correlation functions (CCFs) were computed for all échelle orders but those with the lowest S/N ratio (usually for blue wavelengths). Very broad lines, such as Na I D2 and Hα, and strong telluric features were excluded from the CCF analysis. The latter was performed with an ad hoc software developed by us in the IDL environment. The CCF peak was fitted with a Gaussian to evaluate its centroid and full width at half maximum (FWHM). The RV error for each spectral order, σi, was estimated by the fitting procedure accounting for the CCF noise (far from the peak). For a few spectra, we compared the results of our code with those from the IRAF task FXCOR, finding similar results and errors.
The final RV is obtained as the weighted mean (weight wi = 1∕σi) of the RV i values measured in the individual orders. We adopted as RV uncertainty the standard error of the weighted mean, σRV. The RV values and errors for single stars or single-lined binaries (SB1) are reported in Table A.1. The targets observed more than once were classified as SB1 systems whenever the difference of two RV values is larger than the sum of the corresponding errors. A note about SB1 systems is added in Table A.4. We classified each target with a single RV measurement as a single star (S), although this does not exclude that the star could indeed be an SB1 system, or even an SB2 system observed close to the conjunction, when the lines of the individual components are fully blended.
This procedure was also used to measure the RV of the components of SB2 or multiple systems. We considered a secondary CCF peak as significant whenever it exceeded the 5σ level, where σ is the CCF noise calculated far from the peaks.
Radial/rotational velocity standard stars.
3.2 Projected rotational velocity
The v sin i was measured in two different ways. The first is based on the FWHM of the CCF peak through calibrations FWHM–v sin i obtained forseveral standard stars among those listed in Table 2. For each standard star, the calibration relationship was defined by measuring the FWHM of the CCF peak obtained by correlating the original spectrum with the same spectrum after being artificially broadened by the convolution with a rotation profile of increasing v sin i (from 0 to 150 km s−1). We applied this method only to 21 échelle orders of the blue-chip SARG spectra covering the wavelength range from about 4900 to 6000 Å. We rejected the orders with very wide lines, which would make the results worse. The FWHM measured on the CCF of each échelle order of target spectra and RV standard stars was converted to vsin i using these calibrations. We took the average of the values for each order and the standard deviation as v sin i and error, respectively. The same procedure was applied to the FRESCO spectra, for which we used nine échelle orders in the range 5400–6400 Å, and to the single-order AURELIE spectra, for which synthetic templates were adopted (see Paper I). The measure of v sini on the ELODIE spectra was also performed with this method. We adopted the relation proposed by Queloz et al. (1998) to convert the σ of the Gaussian fitted to the CCF peak into v sin i. In a few cases, it was necessary to perform a new cross-correlation analysis on the original ELODIE spectra to measure the RV and v sin i because the range of radial velocity encompassed by the CCF made on the fly during the observation was not sufficient. This was the case for a few very rapid rotators and SB2 systems.
This method was also used to measure the v sin i for the components of SB2 and SB3 systems. We performed independent Gaussian fits to the CCF peaks of the system components whenever they are well separated, while a double (or multiple) Gaussian fit was applied in cases of blended CCFs. In the latter case the accuracy of v sin i and RV determinations decreases with the increase of line blending and with the decrease in peak intensity. The RV and v sin i of the individual components of SB2 and SB3 spectroscopic systems are listed in Table A.2 and A.3, respectively.
The other method for measuring v sin i, which can be applied only to single stars or SB1 systems, is based on the minimization of the residuals observed − template, where the template is one of the spectra in Table 2 rotationally broadened from 0 to 150 km s−1 with a step of 0.5 km s−1. This is the same algorithm used by ROTFIT for the determination of the atmospheric parameters (see Sect. 3.3 for further details) by adopting a wider list of reference stars. For very rapid rotators, we explored a wider range of v sin i (from 0 to 500 km s−1) with a larger sampling (5 km s−1).
The values of v sin i obtained for single or SB1 stars with both methods, v sin iCCF and v sin iROTFIT, are quoted, along with their errors, in Table A.1. These values are clearly in very good agreement with each other, as shown in Fig. 1, where the two data sets follow a close one-to-one relationship. The average difference, calculated for values of v sin i ≤ 100 km s−1, is only 0.38 km s−1, which is not significant, accounting for measurement errors. The standard deviation of the residuals is 2.26 km s−1. We note that the scatter enhances for the stars rotating faster than about 30 km s−1, especially for the ELODIE data. This is probably due to the fit of the CCF peak, whose shape is far from a Gaussian for high v sini, and to the Queloz et al. (1998) calibration relation adopted for the ELODIE spectra, which has a full validity for v sini up to 20 km s−1. A few discrepant values around 10 km s−1 are visible for the FRESCO data. This is likely the result of the lower resolution of this instrument for which the minimum detectable vsin i is about 5–7 km s−1. From the above arguments, we consider as most reliable the values derived with ROTFIT, which are used in the following.
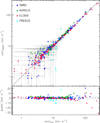 |
Fig. 1 Top panel: comparison between the v sin i values measured with ROTFIT and those derived from the FWHM of the cross-correlation peak (Table A.1). A different colored dot corresponds to each instrument, as indicated in the legend. The continuous line is the one-to-one relationship. Bottom panel: the residuals from the one-to-one relationship, excluding the values with vsin i ≥ 100 km s−1, have a mean of +0.38 km s−1 (dashed line) and a standard deviation of 2.26 km s−1 (dotted lines). |
3.3 Atmospheric parameters and spectral classification
The MK spectral classification and determination of the basic atmospheric parameters (Teff, log g, and [Fe/H]) were performed by means of the code ROTFIT (Frasca et al. 2006). We adopted, as templates, a library of 270 high-resolution spectra of slowly rotating stars with well-known parameters (Soubiran et al. 2010) spanning a wide range of effective temperature, gravity, and iron abundance, which were retrieved from the ELODIE Archive (Moultaka et al. 2004).
The SARG spectra (RSARG = 57 000) were degraded to the ELODIE resolution (RELODIE = 42 000) by means of the convolution with a Gaussian kernel of width  Å. We applied ROTFIT only to the échelle orders with the best S/N ratio, which span from about 4500 to 6800 Å, both in the SARG and FRESCO spectra. To match the lower resolution of FRESCO spectra (RFRESCO = 21 000) we degraded the resolution of the ELODIE templates by convolving them with a Gaussian kernel of width
  Å. The same was done for the AURELIE spectra, even though their resolution (RAURELIE ≃ 40 000) is close to the ELODIE spectra.
All the selected échelle orders were analyzed independently. We excluded from the analysis thecores of Balmer lines, which can be contaminated by chromospheric emission; the Li I λ6707.8 line; and the spectral regions severely affected by telluric line absorption or by CCD defects. The final stellar parameters are weighted averages of the results of each ith échelle order, where the weight accounts for both the  of the fit (more weight is given to the most closely fitted or higher S/N orders) and the amount of information contained in each spectral order, which is expressed by the total line absorption, fi = ∫ (Fλ∕FC − 1)dλ, where Fλ ∕FC is the continuum-normalized spectrum in the ith échelle order. The uncertainties of atmospheric parameters are the standard errors of the weighted means to which we added in quadrature the average uncertainties of the reference stars evaluated as ±50 K, ±0.1 dex, and ±0.1 dex for Teff, log g, and [Fe/H], respectively.
As already explained in Sect. 3.1, ROTFIT also provides us with a measure of the star projected rotational velocity because it iteratively broadens each template spectrum in a wide range of v sini and finds the χ2 minimum. However, the values of v sin i reported in Table A.1 were obtained using as templates the few inactive and slowly rotating standard stars of Table 2, whose spectra were acquired with the same instrumentation as for the target spectra. This enabled us to overcome any possible systematic error due to the different resolution.
Finally, the MK classification of the target star is also provided by the code. It is defined by the spectral type and the luminosity class of the reference star that more frequently matches the target spectrum in the different échelle orders.
In Table A.4, we list the stellar parameters, along with their errors ( , σlog g, and σ[Fe ∕H]), and the MK classification for the single stars and SB1 binaries. The median errors of the atmospheric parameters are about 100 K, 0.16 dex, and 0.11 dex, for Teff, log g, and [Fe/H], respectively.
For double-lined spectroscopic binaries (SB2) and triple systems we do not determine the atmospheric parameters but we only provide the values of radial and rotational velocities of their components measured thanks to the CCF analysis (cf. Sect. 3.1). The spectral classification and estimates of the atmospheric parameters of the components of SB2s via the COMPO2 code (see, e.g., Frasca et al. 2006) are deferred to a subsequent work devoted to systems with more observations, for which we will also discuss their orbital parameters. However, ten SB2 and one SB3 systems, for which one component is much brighter than the other, have been also analyzed with ROTFIT.
3.4 Chromospheric activity and lithium equivalent width
As we did for the optically bright sources (Paper I), we evaluated the level of chromospheric activity from the emission in the core of the Balmer Hα line for the single stars and SB1 systems. A rough age classification was performed based on the lithium abundance (see Sect. 4.3).
We measured both the lithium equivalent width and the chromospheric emission level with the spectral subtraction technique (see, e.g., Herbig 1985; Frasca & Catalano 1994; Montes et al. 1995). This technique is based on the subtraction of a template, which is the spectrum of a slowly rotating star rotationally broadened to the vsin i of the target. We chose templates with the same spectral type as the target, a negligible level of chromospheric activity, and without any detectable lithium absorption line. This method allows us to remove the Fe I λ 6707.4 Å absorption line, which is normally blended with the lithium line from the target spectrum. Likewise, the subtraction of the photospheric absorption profile of the non-active template allows us to measure the net chromospheric emission that fills in the Hα line core. Therefore, the equivalent width of the lithium line, WLi, and the net equivalent width of the Hα line,  , were measured in the residual spectrum obtained by subtracting the non-active template. The values of WLi and
  have been obtained by integrating the residual emission (absorption for the lithium line) profile (see Fig. 2). The errors on the equivalent width of Hα and lithium lines,
  and
and  , were estimated as the product of the integration range and the mean error per spectral point, which results from the standard deviation of the flux values of the residual spectrum measured at the two sides of the line. The equivalent widths of Hα and lithium lines are reported in Table A.4 together with their errors.
We also evaluated the Hα surface flux (or radiative losses), FHα, and the ratio of the Hα and bolometric luminosity,  7, which are calculated according to the following equations:

where F6563 is the continuum flux at the stellar surface at the Hα wavelength, which has been evaluated from the NextGen synthetic low-resolution spectra (Hauschildt et al. 1999) at the stellar temperature and surface gravity of the target. We evaluated the flux error considering the  error and the uncertainty in the continuum flux at the line center, F6563, which is obtained propagating the Teff and logg errors.
Finally, as far as the lithium line is concerned, we estimated the threshold for lithium line detection as ≈ 10 mÅ on the basis of typical WLi errors and S/N ratios.
The Teff – logg diagram of the single and SB1 sources is shown in Fig. 3, where the symbols are color coded according to the value of WLi (Fig. 3a) and  (Fig. 3b).
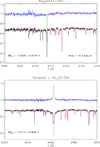 |
Fig. 2 Example of the subtraction technique applied to an active and lithium-rich star both in the lithium (upper panel) and Hα spectral regions (lower panel). In both panels, the continuum of the residual spectrum (blue line) is set to 1, while the original spectrum (full black line) and the non-active template (thin red line) are shifted downward by 0.3 in continuum units. The green lines indicate the residual absorption (for Li I) or emission (for Hα) profile that has been integrated to obtain the equivalent width. |
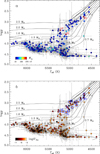 |
Fig. 3 Teff– logg diagram for all the single stars and SB1 systems. The symbols are color coded by WLi (upper panel) and |

4 Results
4.1 Binaries and multiple systems
Close binaries are expected to give a large contribution to X-ray selected or chromospherically active stellar samples (see, e.g., Brandner et al. 1996). In fact, the tidal synchronization of the rotation of the components with the orbital period can greatly intensify the magnetic field, and hence the level of activity. Therefore, stellar samples like the RasTyc sample allow us to detect close binaries, which can be followed up for the study of their properties. At the same time, they behave as contaminants when looking for young stars. Based on the CCF shape and the variation of the peak centroid, we found 12 SB3 (2.7%), 114 SB2 (25.7%), and 38 SB1 (8.6%) systems. We note that these numbers, especially that of SB1, must be considered as lower limits, since stars with only one observation or even with more spectra could be indeed SB1 systems observed in similar configurations or SB2 close tothe conjunctions. Indeed, eight SB1 systems were discovered by the comparison of our single RV value with that reported in the SACY catalog (see Sect. 4.5). Altogether, the close binary systems account for more than 37% of the whole sample. A similar contamination (31%) was estimated for the bright sample in Paper I.
4.2 Hertzsprung-Russell diagram
In Fig. 4, we report the position of the single and SB1 targets with known parallaxes in the HR diagram, which are 263 out of a total of 328 such targets. We used the Teff values derived with ROTFIT (Table A.4) and the V magnitudes from the Tycho catalog that are listed in Table A.1. For most stars (241) the parallaxes are retrieved from the TGAS catalog in the first Gaia data release (Gaia Collaboration 2016), while for 22 objects with no entry in that catalog we adopted the values reported by van Leeuwen (2007). The V magnitudes were corrected for the interstellar extinction as in Paper I, i.e., assuming a mean extinction of AV = 1.7 mag/kpc on the Galactic plane (|b| < 5°) and 0.7 mag/kpc out of the plane. To convert the V magnitudes to bolometric magnitudes we used the bolometric correction (BC) derived by interpolating the relation Teff –BC of Pecaut & Mamajek (2013). In the same figure we overplot the post-main sequence evolutionary tracks by Girardi et al. (2000).
As apparent in Fig. 4, the values of log g found from the analysis of the spectra are fully consistent with the evolutionary status of the targets, supporting the reliability of the atmospheric parameters derived by ROTFIT with these spectra.
4.3 Lithium abundance and age
Lithium is burned at relatively low temperatures in stellar interiors (~ 2.5 × 10⁶ K). As a consequence, it is progressively depleted from the stellar atmospheres of late-type stars when mixing mechanisms pull it deeply in their convective layers. Thus, its abundance can be used as an empirical indicator of age for stars cooler than about 6500 K. A simple and effective way to get an age estimate is a diagram showing the equivalent width of lithium as a function of the color index  together with the upper envelopes of young OCs that serve as boundaries to delimit the various age classes (Fig. 5). Although the stars are not very distant from the Sun, their colors are affected by reddening, which was calculated from the magnitude extinction, AV (see Sect. 4.2) according to standard extinction law E(B − V) = AV∕3.1.
We adopted, as in Paper I, the upper envelopes of the following clusters: the Hyades (Soderblom et al. 1990), the Pleiades (Soderblom et al. 1993c; Neuhäuser et al. 1997), and IC 2602 (Montes et al. 2001a), whose ages are of about 650 (White et al. 2007), 125 (White et al. 2007), and 30 Myr (Stauffer et al. 1997), respectively. As shown by Soderblom et al. (1993b), the lower envelope of the Pleiades behaves as an upper boundary for the members of the Ursa Major (UMa) cluster (age ≈ 300 Myr). Therefore, we considered as pre-main sequence (PMS) or very young star candidates (PMS-like) those stars located above the Pleiadesupper envelope (big dots in Fig. 5) or very close to it (triangles) and divided the remaining stars into Pleiades-like, UMa-like, Hyades-like, and Old classes according to their position in the diagram; the Old classes are those with a WLi < 10 mÅ. We remark that our selection criterion is not conservative, but it is inclusive; in fact we are not taking into account the errors on WLi and  . On the other hand, the upper envelopes of OCs are not knife-like edges that can sharply separate classes of objects of different ages. That is why we used the suffix “like” in our classes. This also means, for example, that the PMS-like class can include stars that are indeed closer to the Pleiades age.
As a further test of our method to select young stars, we calculated the lithium abundance, A(Li), from our values of Teff, log g, and WLi by interpolating the curves of growth of Soderblom et al. (1993c). We adopted this calibration to treat our data homogeneously to Sestito & Randich (2005) for the stars in 22 Galactic OCs. In Fig. 6 we show the lithium abundance as a function of Teff along with the upper envelopes ofthe distributions of some young OCs shown by Sestito & Randich (2005). We note that, contrary to the color indices, the effective temperature does not need to be corrected for interstellar reddening, and we thereby avoid introducing further uncertainties. Apart from the large errors of A(Li), which take into accountboth the Teff and WLi errors8, Fig. 6 clearly shows that all the 33 PMS-like stars already selected from the WLi diagram (Fig. 5), with the exception of only two sources, are located on or above the Pleiades upper envelope. The 2 stars falling just below the Pleiades upper envelope are RasTyc 0316+5638 (#11) and RasTyc 2039+2644 (#22). However, considering the errors, they can be still included in the PMS-like class. Moreover, the 4 stars that lie just below the upper envelope of the Pleiades at 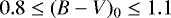 mag in Fig. 1 (green triangles) are located above or exactly superimposed to it in the Teff -A(Li) diagram (Fig. 6). In addition, 11 other stars that were not selected on the basis of WLi show a high lithium abundance above the Pleiades A(Li) upper envelope. We indicated these stars with open squares and flagged the stars with letters from a to k both in Figs. 5 and 6 as well as in Table 3. The inclusion of these targets leads the number of very young star candidates to 44.
In the end, the percentage of PMS-like, Pleiades-like, UMa-like, Hyades-like, and Old stars is about 14%, 13%, 34%, 19%, and 20%, respectively, while for the bright sample (Paper I) they were about 3%, 7%, 39%, 19%, and 32%. Considering the population of very young stars as defined in Paper I, i.e., PMS-like, Pleiades-like, and UMa-like stars taken altogether, their percentage in the faint sampleincreases from 49% to 61%, while the fraction of the older population decreases of about 10% accordingly. In particular, the fraction of the youngest stars (PMS-like and Pleiades-like) is almost three times higher in the faint sample than in the bright sample.
In an X-ray flux-limited and optically magnitude-limited sample, the fraction of the various populations depends on the X-ray and optical horizons, i.e., the maximum distance at which we can detect stars in X-ray and at optical wavelengths, respectively. On average, when the X-ray horizon is farther than the optical horizon and the last is increased by changing the limiting magnitude of the sample (fainter stars detected at larger distance), the fraction of young stars increases as well. This can be easily understood because young stars are brighter in X-ray and thus also detectable at larger distances compared to older stars. However, this applies only in general terms because of the role of other stellar parameters in the X-ray luminosity, which depends, inter alia, on both age and mass, making the details more complicated. X-ray population models are absolutely needed for a meaningful interpretation of the observed properties (sky positions, distance distribution, magnitudes, colors, proper motions, etc.) of the RasTyc sample. This is out of the scope of the present work and will be the subject of a dedicated paper. We also note that the differences may also arise from the higher incidence of Gould Belt sources in the optically faint sample that reaches beyond the space volume sampled in Paper I.
Figure 7 shows the HR diagram for the PMS-like objects along with the PMS evolutionary tracks and isochrones by Siess et al. (2000). We note that stars #17 and #27 lie above the isochrone at 1 Myr and are likely lithium-rich giants, as also shown in Fig. 4 where they lie close to the post-main sequence tracks for stellar models with 3.0 M⊙ and 1.5 M⊙, respectively. We have therefore disregarded them as PMS-like candidates (see also Table 3 and Appendix B).
Very young stars and PMS candidates selected from the lithium content.
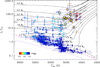 |
Fig. 4 Hertzsprung-Russell diagram of the single and SB1 sources with known parallaxes. The symbols are color coded by log g. The evolutionary tracks of Girardi et al. (2000) are shown as solid lines with the labels representing their masses. The zero-age main sequence (ZAMS) with solar metallicity (Z = 0.019) and with Z = 0.001 by the same authors are also shown with a dashed and a dotted line, respectively. The lithium-rich giant candidates listed in Table 4 are enclosed in open squares. The two giants with the highest Li abundance are labeled as in Table 3. |
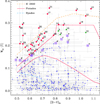 |
Fig. 5 Equivalent width of the Li Iλ6707.8 line (WLi) plotted as a function of the dereddened Johnson |

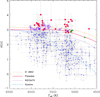 |
Fig. 6 Lithium abundance as a function of Teff for the stars in Table A.4. The upper envelopes of A(Li) for IC 2602, Pleiades, NGC 6475 (age ≈ 300 Myr), and Hyades clusters adapted from Sestito & Randich (2005) are overplotted. The meaning of the symbols is the same as in Fig. 5. Another 11 stars with high lithium content are found thanks to this diagram (open squares) and are labeled with letters from a to k, as in Table 3. |
4.4 Evolved stars
Besides the two stars mentioned above, a considerable number of giants and subgiants are present among single stars and SB1 systems, as is apparent from the Teff –logg diagram (Fig. 3) and the HR diagram (Fig. 4). Considering as evolved stars those with log g ≤ 3.5, we got a sample of 39out of 328 sources, i.e., 12 % of the single+SB1 sources. Half of these also exhibit a remarkable chromospheric emission (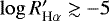 see Fig. 3b), which is normally paired to a rapid rotation (v sin i ≳ 9 km s−1). It is worth noticing that all the SB1 and possible SB2 systems (10 in total) among the 39 evolved stars also display a high chromospheric activity level. The remaining active giants could be either single stars that are rotating fast as a result of a particular evolutionary path or spectroscopic binaries that are still undetected.
Fourteen out of the 39 evolved stars are lithium-rich giant candidates (A(Li) > 1.4, e.g., Charbonnel & Balachandran 2000). Their properties are summarized in Table 4. Among these stars, only the bright source HD 214995 is already known as a Li-rich giant at the position of the red-giant bump (Charbonnel & Balachandran 2000). The other stars, with the exception of perhaps BD+48 3149 and HD 220338, are hotter than the boundary corresponding to the deepest penetration of the convective zone during the first dredge up (cf. Fig. 1 of Charbonnel & Balachandran 2000), which is around 4400–4600 K for the stars in our mass range. Therefore, these stars have started but not yet completed the standard first dredge-up dilution and should not be considered as abnormally lithium rich. They would exhibit a lithium abundance close to its initial value. As suggested by Fekel & Balachandran (1993), angular momentum may be dredged up from the stellar interior along with Li-rich material during this phase, giving rise to a faster rotation and, consequently, to a higher activity level. This can explain the higher incidence (more than 35%) of lithium-rich giant candidates in our X-ray selected sample compared to the typical fraction of 1 % found in several spectroscopic surveys of giant stars (e.g., de la Reza et al. 2012, and references therein). This is also in line with the high percentage (about 50%) of Li-rich candidates among fast rotating K giants (with vsin i ≥ 8 km s−1) reported by Drake et al. (2002). It is worth noticing that most of the stars listed in Table 4 are indeed rotating faster than 8 km s−1.
The source TYC 3501-626-1 could be an SB2 system with a faint component on the basis of the CCF. It has a high chromospheric activity level 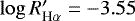 and has been reported as a rotationally variable source (Prot ≃ 7.93 days) by Kiraga & Stepien (2013). The presence of the faint secondary component could have affected the determination of the atmosphericparameters of this star; therefore we cannot exclude that it is a binary system containing young Li-rich stars. In addition, seven of the stars in Table 4, namely TYC 4319-714-1, TYC 4364-1262-1, BD+06 3372a, BD+02 3384, BD-04 5118, HD 205173, and HD 220338, are also classified as rotationally variable sources by Kiraga & Stepien (2013) and Watson et al. (2015), who have reported photometric periods of 34.5, 35.6, 6.5, 20.4, 39.8, 101.8, and 15.4 days, respectively. With the exception of TYC 4364-1262-1 and HD 220338, which we detected as SB1 systems (see Tables A.1 and A.4), these stars have been observed only once and are therefore preliminarily classified as single stars. We cannot exclude that they are single-lined binaries similar to some long-period RS CVn systems, which also show a fast rotation and lithium enrichment (e.g., Pallavicini et al. 1992; Barrado y Navascués et al. 1998).
Lithium-rich giant candidates.
4.5 Comparison with the SACY survey
As anticipated in Sect. 2, a similar high-resolution spectroscopic survey of optical counterparts of Southern X-ray sources (SACY) was carried out by Torres et al. (2006). They cross-correlated the RASS catalog with the HIPPARCOS and Tycho -2 catalogs to build their sample of stellar X-ray sources and considered only stars with (B − V) ≥ 0.6, as we have done in Paper I and in the present work. Unlike us, these authors observed stars at all right ascensions, but excluded all HIPPARCOS stars having MV < 2.0 mag to reduce the sample contamination by evolved stars as much as possible. Moreover, they excluded all the already known giants and active binaries of the RS CVn and W UMa classes. This explains the higher incidence of such objects in our survey with respect to SACY.
As we have observed a few stars with a low or negative declination (mainly with SARG), we have some sources in common with the SACY survey. In Table 5 we compare the parameters derived by us for the single stars and SB1 systems with those in the SACY survey. The SACY catalog (Torres et al. 2006) lists the spectral type, RV, WLi for 16 of such sources and vsin i for 8 of the sources. For 3 other stars da Silva et al. (2009) report WLi, vsin i, and Teff (instead of spectral type), while Elliott et al. (2014) quote their RV values. As shown in Table 5, there is a general good agreement between Teff values (within 150 K), spectral types (within 1–2 spectral subclasses), vsin i (within 10 %), and WLi (within 10%) with only three exceptions. For RasTyc 2155−0947 there is a large discrepancy between spectral types. It is an eclipsing binary system according to the ASAS data analyzed by Kiraga (2012). The presence of a secondary component could have affected the spectra giving rise to this large discrepancy. We found a very different spectral type for RasTyc 2256+0235 as well. This source is classified by Kiraga (2012) as a rotationally variable star with a very short period, Prot = 0.8389 day. Various Teff determinations are available in the literature, including that of 5316 K (Muñoz Bermejo et al. 2013) based on the same ELODIE spectrum taken by us. This determination is midway between Teff ≃ 4900 K corresponding to the SACY K1 IV spectral type (according to the relation of Pecaut & Mamajek 2013) and our value of 5665 K. The distortion of spectral lines and CCF that is likely due to starspots can be responsible for that discrepancy. RasTyc 2352−1143 shows instead a remarkable difference of v sin i values, which is still larger if compared tothe value of 8.2 km s−1 reported by Jenkins et al. (2011), who also quote a value of RV = −13.4 ± 1.9 km s−1. This star has been recently discovered to be a close visual binary with a separation of only 0. ′′ 22 (Horch et al. 2011).
As regards the RV, we note that 10 objects have very discrepant values and should be considered as SB1 systems. For 8 of these objects, we could collect only one spectrum; therefore, without literature data, we would have preliminarly classified them as single stars.
Comparison with SACY parameters for single stars and SB1 systems.
4.6 Chromospheric activity
The Hα fluxes and  indices, plotted against Teff, are shown in Fig. 8, where the boundary between accreting objects and chromospherically active stars, as defined by Frasca et al. (2015), is also shown.
Our targets display a wide range in  with only a few of these sources close to the saturation of magnetic activity, i.e., with log (FHα) ≥ 6.3 (e.g., Martínez-Arnáiz et al. 2011, and references therein) or
  (e.g., Soderblom et al. 1993a). There is no object above the activity/accretion boundary, but only the target with the highest Hα flux, namely #31 (V395 Cep), is nearly superimposed to it. This star is classified by Kun et al. (2009) as a classical T Tau star (CTTS) belonging to the L1261 cloud. Indeed, the Hα emission profile displayed by the SARG spectrum is broad and double-peaked, with a central absorption, i.e., it is typical for a CTTS. Moreover, the full width at 10% of the line peak (10%WHα) is about 480 km s−1, suggesting an accreting object according to the White & Basri (2003) criterion, 10%WHα ≥ 270 km s−1. From the Hα luminosity, we have also estimated the mass accretion rate as Ṁ acc ≃ 3.6 × 10⁻⁹ M⊙/yr, following the prescriptions of Biazzo et al. (2012b). This value confirms #31 as a CTTS that displays a significant accretion (e.g., Alcalá et al. 2017). This object is also a class II source, as testified by the large IR excess (see Fig. 9).
The other two stars close to the boundary are #2 (TYC 4496-780-1) and #26 (TYC 1154-1546-1). The former belongs to a small group of young stars discovered by Guillout et al. (2010) in the surroundings of the Cepheus flare region (e.g., Tachihara et al. 2005, and references therein). It is the only object that displays a substantial IR excess among those in Guillout et al. (2010). Furthermore, its Hα profile is similar to that of a CTTS with a double-peaked shape and 10%WHα ≃ 510 km s−1. However, this star is a close visual binary (e.g., Fabricius et al. 2002) that deserves a deeper analysis, which is deferred to a subsequent work. The second star (#26) is an ultrafast rotator (v sin i ≃ 234 km s−1) with a broad and shallow Hα profile filled in by emission. This object is likely a zero-age main sequence (ZAMS) star, as also suggested by the HR diagram (Fig. 7) and by the lack of IR excess (see Fig. 9).
One of the candidate lithium-rich giants, namely #27 (HD 214995) shows a very low Hα emission ( ), while the other (#17 = HD 234808) has
  , which is similar to the values of other very young stars in our sample. We note that the former star does not display IR excess, while star #17 shows far-infrared excess (see Sect. 4.7).
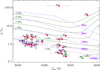 |
Fig. 7 Hertzsprung-Russell diagram of the PMS-like sources with known parallaxes. The symbols are as in Fig. 5. The PMS evolutionary tracks of Siess et al. (2000) are shown as solid lines with the labels representingtheir masses. The isochrones at ages of 1, 3, 10, 30, and 300 Myr are shown with dashed lines. The stars labeled as #17 and #27 lie above the 1-Myr isochrone and are likely lithium-rich giants. |
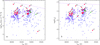 |
Fig. 8 Hα flux (a) and |

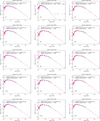 |
Fig. 9 Spectral energy distributions (dots) of the PMS-like sources and the two lithium-rich giants discussed in the paper. In each panel, the best fitting low-resolution NextGen spectrum (Hauschildt et al. 1999) is shown by a continuous line. Mid-infrared fluxes are shown with different symbols, as indicated in the legends of the plots. |
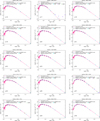 |
Fig. 9 continued |
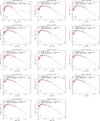 |
Fig. 9 continued |
4.7 Spectral energy distributions of very young sources
We analyzed the SED of the very young and PMS-like candidates to check the consistency between the photometry and the stellar parameters derived from our spectra. This analysis also allowed us to detect IR excesses and classify the sources in the Lada (1987) scheme.
We constructed the SED of the RasTyc sources using the optical and near-infrared (NIR) photometric data available in the literature. In particular, we used BV R photometry from the NOMAD catalog (Zacharias et al. 2004), where the magnitudes in the Johnson B and V bands are obtained by transformations from Tycho BT –V T system and the R magnitude is normally taken from the USNO-B1.0 catalog (Monet et al. 2003). Whenever available (in a few cases), a more precise simultaneous photometry in the optical bands was adopted instead (e.g., Guillout et al. 2010; Frasca et al. 2011; Fröhlich et al. 2012). For all the sources we retrieved I magnitudes from the TASS catalog (Droege et al. 2006) and completed the optical/NIR SED with the 2MASS JHKs photometry (Cutri et al. 2003; Skrutskie et al. 2006). The mid-infrared (MIR) photometry was retrieved from the AllWISE data release (Wright et al. 2010; Cutri et al. 2013) and, for a few sources, from AKARI (Ishihara et al. 2010) and IRAS (e.g., Helou & Walker 1995; Abrahamyan et al. 2015).
We adopted the grid of NextGen low-resolution synthetic spectra, with log g in the range3.5–5.0 and solar metallicity by Hauschildt et al. (1999), to fit the optical-NIR portion (from B to J band) of the SEDs, following Frasca et al. (2009). In the fitting procedure we fixed Teff and log g of each target to the values found with the code ROTFIT (Table 3) and let the angular stellar diameter and the extinction AV vary until a minimum χ2 was reached. For the stars with known distance, this also provides us with a measure of the stellar radius. We always found low values of AV, ranging from 0.0 to 0.6 mag, in agreement with the estimates made in Sect. 4.2.
We found a relevant MIR excess only for two stars, RasTyc 0013+7702 and RasTyc 2320+7414 (V395 Cep), which behave as class II IR sources. This classification agrees with their Hα profiles, which are typical of CTTS. In addition, another star in Cepheus, namely RasTyc 0000+7940 (#1) displays a small MIR excess (class III) in line with its weak-line T Tauri star (WTTS) nature.
4.8 Kinematics of the very young sources
The availability of accurate radial velocities and the Gaia DR1 TGAS parallaxes and proper motions (Gaia Collaboration 2016) allowed us to calculate the Galactic space-velocity components for most of the sources investigated in the present paper. We used the outline of Johnson & Soderblom (1987) to compute the velocity components, U⊙, V ⊙, and W⊙ and their uncertainties, which we report in a heliocentric, left-handed coordinate system, where U⊙ is directed toward the Galactic anticenter.
Space-velocity components are of great importance to assign membership to a known stellar kinematic group (SKG). We show in Fig. 10 the (U⊙, V ⊙) and (V ⊙, W⊙) diagrams for the PMS-like stars, along with the average position of the five major young SKGs discussed in Montes et al. (2001b), namely the IC 2391 supercluster (~ 50 Myr), the Local Association or Pleiades group (~20–150 Myr Asiain et al. 1999; Montes et al. 2001b), the Castor (~300 Myr), and the Hyades supercluster (~600 Myr). Additional SKGs and loose associations, such as TW Hya (3–15 Myr), β Pic (10–24 Myr), Octans (20–40 Myr), AB Dor (50–150 Myr), and Coma Ber (~ 400 Myr) have been also considered (e.g., Zuckerman et al. 2001, 2004, 2013; Riedel et al. 2017, and references therein). The locus of the young-disk population (YD; age ≤ 2 Gyr) as defined by Eggen (1996, and references therein) is shown as well.
We note that the two lithium-rich giant candidates, #17 and #27, lie outside the YD locus, which confirms the nature of evolved stars.
Most of the PMS-like sources have U⊙, V ⊙, and W⊙ compatible with the Pleiades and/or Castor and/or TW Hya SKGs, which are the youngest SKGs considered in this study. However, #12, #16, #24, and #29 are located far outside of the YD locus in the (U⊙, V ⊙) plane. With the exception of #16, for which we measured the same RV in the two spectra within the errors, the other three sources havebeen observed only once. Therefore we cannot exclude that they are SB1 systems observed far from the conjunctions, so that their barycentric RV could be very different from the value measured by us. This would lead to wrong space velocity components.
Some notes about the possible association with the aforementioned SKGs are given in Appendix B.
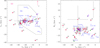 |
Fig. 10 (V ⊙, U⊙) (left panel) and (V ⊙, W⊙) (right panel) diagrams for PMS-like sources and two lithium-rich giants discussed in the paper. The symbols are as in Fig. 5 and the labels are as in Table 3. The average velocity components (blue asterisks) of some young SKGs and the locus of the YD population (Eggen 1996) are also indicated in the (V ⊙, U⊙) plane. The position of the source #17 (V ⊙ = −2.5 km s−1, U⊙ = 83.5 km s−1) is out of thescale of the plot, as indicated by the red arrow. |
5 Summary
We have presented the results of a high-resolution spectroscopic survey of optical counterparts of X-ray sources. Our targets were selected from the RasTyc sample (Guillout et al. 1999), which is obtained by the cross-correlation of the Tycho and RASS catalogs. In particular, we measured RV and projected rotational velocities (v sin i) for 443 stars, most of which are optically faint RasTyc sources (V ≥ 9.5 mag). We found 114 double-lined spectroscopic binaries (SB2) and 12 triple systems among these sources.
For the remaining targets, including 38 single-lined binaries (SB1), we were also able to determine the atmospheric parameters (Teff, log g, and [Fe/H]), lithium abundance, and the level of chromospheric activity as measured by the ratio of Hα and bolometric luminosity. The trigonometric parallax from the TGAS catalog (Gaia Collaboration 2016) or from the catalog of van Leeuwen (2007) is also available for 263 of the stars with measured parameters. The position of these stars in the HR diagram is in very good agreement with the gravities derived with our analysis code (ROTFIT).
The equivalent width of the Li Iλ6707.8 and the lithium abundance allowed us to perform an age classification of our targets that were divided into five classes: PMS-like (14%), Pleiades-like (13%), UMa-like (34%), Hyades-like (19%), and Old stars (20%). The higher percentage of PMS-like and Pleiades-like stars found in comparison with the bright RasTyc sample is likely the result of the greater distances reached in the present work for objects optically fainter. Indeed, at larger distances, the X-ray brighter sources (younger stars) are more easily detected compared to less active (older) stars.
We have investigated in more detail the 44 PMS-like candidates and found that two of these sources must be rejected from this class because their position in the HR diagram, their spectral classification, and their space velocity components suggest theyare lithium-rich giants. The remaining PMS-like sources display a rather high level of chromospheric activity,  and, with few exceptions, are located in the domain of the (V ⊙, U⊙) plane occupied by YD stars. The two objects with the highest values of
  (#2 and #31) are very close to the dividing line between chromospheric sources and accreting stars defined by Frasca et al. (2015). They both display a broad and double-peaked Hα profile that is typical of CTTS, as well as a remarkable IR excess in their SEDs.
Another important outcome of this survey is the presence of a significant percentage of giant and subgiant stars (~12%). Half of these stars also display a high activity level that is comparable to the activity level of some PMS-like sources, and a rather rapid rotation, which could be the result of a particular evolutionary path or the effect of an undetected binarity (spin-orbit synchronization). Some of these evolved stars (~36%) are also rich in lithium (A(Li) > 1.4).
Acknowledgements
This paper is dedicated to the memory of our colleague and friend Rubens Freire Ferrero. We thank the anonymous referee for useful suggestions. We are grateful to the TNG staff and, particularly, to Aldo F. Fiorenzano and Antonio Magazzù for conducting the service observations with SARG. We also thank the night assistants of the OHP and OAC observatories for their support and help with the observations. Support from the Italian Ministero dell’Istruzione, Università e Ricerca (MIUR) is also acknowledged. D.M. acknowledges financial support from the Universidad Complutense de Madrid (UCM) and the Spanish Ministry of Economy and Competitiveness (MINECO) from project AYA2016-79425-C3-1-P. This research made use of SIMBAD and VIZIER databases, operated at the CDS, Strasbourg, France. This publication uses ROSAT data. This publication makes use of data products from the Wide-field Infrared Survey Explorer, which is a joint project of the University of California, Los Angeles, and the Jet Propulsion Laboratory/California Institute of Technology, funded by the National Aeronautics and Space Administration. This work has made use of data from the European Space Agency (ESA) mission Gaia (https://www.cosmos.esa.int/gaia), processed by the Gaia Data Processing and Analysis Consortium (DPAC, https://www.cosmos.esa.int/web/gaia/dpac/consortium). Funding for the DPAC has been provided by national institutions, in particular the institutions participating in the Gaia Multilateral Agreement.
Appendix A: The data
The data resulting from our analysis are listed in Tables A.1–A.4, which are only available at the CDS.
Radial (RV) and rotational (v sin i) velocities for the single stars and SB1 binaries.
Radial (RV) and rotational (v sin i) velocities for the components of SB2 binaries.
Radial (RV) and rotational (v sin i) velocities for the components of SB3 binaries.
Spectral types, atmospheric parameters, and equivalent widths of Li I and Hα lines for the single stars (S) and SB1 binaries.
Appendix B: Notes onthe very young stars and PMS-like candidates
We briefly summarize the known properties of the very young stars and PMS-like candidates listed in Table 3 from the Simbad and Vizier databases and the literature.
- #1
RasTyc 0000+7940 (=BD+78 853) was discovered by Guillout et al. (2010) as a WTTS in the surroundings of the Cepheusflare region (e.g., Tachihara et al. 2005, and references therein). Guillout et al. (2010), on the basis of the v sin i values measured in the two AURELIE spectra, suspected that it was an SB2, but they warned that the different v sin i may also be the result of a different CCF shape in the two spectral domains. In several spectra subsequently acquired with FRESCO we always measured the same RV, within the errors, and no significant v sin i variation (see Table A.1). Therefore, we considered this star as a single star. The position on the HR diagram with the Siess et al. (2000) isochrones suggests an age of ≈20 Myr (Fig. 7).
- #2
RasTyc 0013+7702 (=TYC 4496-780-1) was discovered by Guillout et al. (2010) as a CTTS star, with a broad double-peaked emission, in the surroundings of the Cepheus flare region. They noticed two peaks with a very different height in the CCF that are centered at about 5 and 45 km s−1, which suggests an SB2 system with components of very different luminosity. Other spectra subsequently taken with FRESCO confirm the binary nature of this source (see Table A.2). We assumed that the atmospheric parameters derived with ROTFIT are basically those of the primary component and the effect of the secondary star is negligible because of its faintness. RasTyc 0013+7702 is a also a close visual binary (ρ = 1. ′′41, ΔV ≃ 2.2 mag; Fabricius et al. 2002). The companion was also detected in the H band by the SEEDS survey (Uyama et al. 2017).
- #3
RasTyc 0038+7903 (=TYC 4500-1478-1) was discovered as a PMS star by Tachihara et al. (2005), who reported a K1 spectral type. It is one of the four co-moving PMS stars in the Cepheus flare region investigated by Guillout et al. (2010). It is a single star, based on the spectrum appearance and the constant RV. Its position on the HR diagram suggests an age of ≈10 Myr (Fig. 7).
- #4
RasTyc 0039+7905 (=BD+78 19) was the fourth PMS discovered by Guillout et al. (2010) in the surroundings of the Cepheus flare region. These authors suggested that BD+78 19 may be a binary system of mass ratio ≈1. Indeed, our further observations revealed two CCF peaks of the same intensity with a separation of about 25 km s−1 in two epochs (see Table A.2). The atmospheric parameters listed in Tables 3and A.4 were derived from the analysis of the spectra taken at the conjunctions and can be considered as typical for both components. The position on the HR diagram suggests and age of ≈10 Myr (Fig. 7). However, considering the system composed of two nearly equal stars, the luminosity of each component should be a factor of two less, bringing these sources closer to the 20 Myr isochrone.
- #5
RasTyc 0046+4808 (=TYC 3266-1767-1) is one the stars with the highest WLi in our sample. No specific reference is found in the Simbad database. This object is listed in the catalog of the International Deep Planet Survey (Galicher et al. 2016) as a K3.5-type star with an age between 5 and 30 Myr. The classification is in fairly good agreement with our own (K2). No distance is reported in the Gaia DR1 catalog, which prevented us from estimating its age from the position on the HR diagram and studying its kinematical properties.
- #6
RasTyc 0222+5033 (=BD+49 646) was proposed as the optical counterpart of the X-ray source RX J0222.5+5033 by Motch et al. (1998) and classified as an active corona source on the basis of the ROSAT hardness ratios. The star is located just below the Pleaides upper envelope in the
 –WLi
diagram (see Fig. 5). The space velocity components are fully compatible with the AB Dor moving group.
–WLi
diagram (see Fig. 5). The space velocity components are fully compatible with the AB Dor moving group. - #7
RasTyc 0230+5656 (=TYC 3695-2260-1). From its sky location Kharchenko et al. (2004) gave a possible membership to the h and χ Per open clusters. However its magnitude and colors are totally inconsistent with the color–magnitude diagrams of these clusters and the Gaia distance of 165 pc, which is much smaller than that of these clusters (~2.3 kpc). The position on the HR diagram suggests an age of ≈ 20 Myr (Fig. 7) and its space velocity components are fairly compatible with the Pleiades SKG or the TW Hya association.
- #8
RasTyc 0252+3728 (=TYC 2338-35-1) is given as a G5 IV T Tau-type star in Simbad. It is listed in the Washington Visual Double Star (WDS) catalog (Mason et al. 2001) as a close physical visual binary with a separation of 0. ′′6 and components of 9.34 and 10.77 mag in the K band; a third component of 13.4 mag separated by 4. ′′9 is reported in the same catalog, but it is not given as a physical component. Li & Hu (1998) reported an
 Å and WLi = 220 mÅ. Li (2004) classifies the system as a WTTS candidate with proper motions consistent with the Pleiades. From their survey with adaptive optics of young solar analogs Metchev & Hillenbrand (2009) estimated an age of about 200 Myr and a mass M = 1.1 M⊙ by adopting a distance of 170 pc. From high-resolution spectroscopy White et al. (2007) found an
 = 2.29Å and WLi=166 mÅ. Moreover they reported RV = 0.78 ± 2.20 km s−1 and v sin i = 29.59 ± 1.55 km s−1, in very good agreement with our determinations. We found a larger lithium EW (WLi = 293 ± 187 mÅ) but with a large error, due to the low S/N of our spectrum. We confirm that the space velocity components are compatible with the Pleiades SKG.
 - #9
RasTyc 0300+7225 (=TYC 4321-507-1) This star is located just below the Pleaides upper envelope in the
 –WLi diagram (see Fig. 5). The position in the HR diagram is close to the ZAMS. The space velocity components are compatible with the Pleiades SKG.
 - #10
RasTyc 0311+4810 (=Cl Melotte 20 94) is given as a rotationally variable F9V star in Simbad. Prosser (1992) classified it as a photometric member of the α Per cluster (d = 185 pc, age = 72 Myr). From kinematic parameters and a distance of 190 pc assumed for the center of the α Per cluster, Makarov (2006) estimated for this star an RV = 2.65 km s−1 and a distance d = 156 pc, which are in reasonable agreement with our RV and the TGAS distance of 133 ± 5 pc.
- #11
RasTyc 0316+5638 (=TYC 3710-406-1) in the catalog of Hoogerwerf (2000), who reported this star as a member of the α Per OB association. The position on the sky along with the strong lithium line, the strongly filled in Hα line, and its kinematics suggest that this star is related to the α Per association.
- #12
RasTyc 0323+5843 (=TYC 3715-195-1). In the WISE catalog (Wright et al. 2010) a weak probable variability in the W1 (3.35 μm) band is reported. The Hα line, in our SARG spectrum, is totally filled in by core emission that reaches the local continuum. Its position on the HR diagram suggests an age of ≈15 Myr (Fig. 7). However, its space velocity components are far from the known young SKGs. It also lies outside of the locus of the YD population (see Fig. 10). With only one spectrum, we cannot exclude that this source is an SB1 system observed far from the conjunction.
- #13
RasTyc 0331+4859 (=Cl Melotte 20 935) is a F9.5V star, in the α Per cluster. From high-resolution spectroscopy Prosser (1992) found RV = −2.7 km s−1 and v sin i = 78 km s−1 and defined the star as a member of α Per cluster. In their analysis of rotation in young OCs Marilli et al. (1997) found V = 10.05 mag, B–V = 0.62 mag, a rotation period Prot = 0.275 d and a variation amplitude of 0.05 mag in the V band. From high-dispersion spectra of young nearby stars White et al. (2007) reported an absorption Hα feature with an equivalent width of 3.02 Å, a lithium absorption with WLi = 110 mÅ, RV = −1.8 km s−1, and v sin i = 64.44 km s−1. On our SARG spectrum we measured nearly the same v sin i (66.2 km s−1), a slightlyhigher radial velocity (RV = 3.35 ± 2.17km s−1), and revealed an Hα strongly filled in by core emission.
- #14
RasTyc 0359+4404 (=TYC 2876-1944-1) is given as a rotationally variable star in Simbad. The variability with a period Prot ≃ 0.456 d and a variation amplitude in the V band of 0.18 mag has been detected by ASAS (Kiraga & Stepien 2013). We found an RV variation of about 11 km s−1 in the two AURELIE spectra, which is, however, just smaller than the sum of the two uncertainties. Therefore, we classified this star as single, but further observations are needed to exclude binarity.
- #15
RasTyc 0616+4516 (=TYC 3375-720-1) displays a Hα line thatis strongly filled in by core emission in our SARG spectrum. Its kinematics is not far from the average of the IC 2391 supercluster.
- #16
RasTyc 0621+5415 (=TYC 3764-338-1) has an age of ≈ 20 Myr based on its position on the HR diagram (Fig. 7). However, its space velocity components are far from the known young associations and moving groups. It is also outside the locus of the YD population (see Fig. 10).
- #17
RasTyc 1908+5018 (=HD 234808) was already included in Paper I (the only reference present in the Simbad database), but the data were not analyzed in that paper. The position of this star in the HR diagram is well above the region occupied by the PMS stars and is more consistent with a giant star (see Figs. 4 and 7). The spectral classification (G8III-IV), the logg value of 3.39 dex and the kinematics strengthen the hypothesis of a lithium-rich giant. This star shows far-infrared excess (see Sect. 4.7 and Fig. 9). The high lithium content of this target could have been synthesized through the Cameron & Fowler (1971) mechanism. This seems to be also supported by the presence of IR excess, which could be due to a dust shell possibly generated via the same mechanism (de la Reza et al. 1996). A conclusive explanation is out of the scope of this work.
- #18
RasTyc 1925+4429 (=KIC 8429280) was identified as the optical counterpart of the X-ray source RX J1925.0+4429 by Motch et al. (1998). It is an active star observed by the Kepler space telescope whose light curves were analyzed by Savanov (2011) and Frasca et al. (2011) reconstructing the star spot pattern and evolution. In addition to measuring the differential rotation, Frasca et al. (2011) have also measured the atmospheric parameters, RV, v sin i, WLi and chromospheric fluxes from the analysis of SARG and FRESCO spectra. These data have been also used in the present work. Unfortunately, the Gaia DR1 TGAS parallax and proper motions are not available for this source.
- #19
RasTyc 2004−0239 (=BD−03 4778) was identified as the optical counterpart of the X-ray source 1RXS J200449.5-023915 by Haakonsen & Rutledge (2009). A lower mass stellar companion (ΔK ≃ 2.2 mag at about 2. ′′5) was discovered by Elliott et al. (2015).
From high-resolution spectroscopy, da Silva et al. (2009) found Teff = 5083 K, WLi = 290 mÅ, and v sin i = 8 km s−1. Desidera et al. (2015) reported a K1 V spectral type and values of Teff = 5160 ± 30 K, vsin i = 8 km s−1, and WLi = 280 mÅ. Folsom et al. (2016), with high-resolution spectropolarimetry, determined Teff = 5130 ± 161 K, log g = 4.45 ± 0.27, vsin i = 9.6 km s−1, and measured the magnetic field. These values are close to our determinations (Teff = 5183 ± 63 K, WLi = 298 mÅ, vsin i = 9 km s−1). Messina et al. (2010) found it as a member of AB Dor association and measured a rotation period Prot = 4.68 d and a full amplitude of the variation in the V band of about 0.10 mag. This star is located just above the Pleiades upper envelope in our
 –WLi diagram (Fig. 5), which indicates an age of ≈100 Myr; this is in line with the age adopted by Desidera et al. (2015) and with that of AB Dor (100–125 Myr, Luhman et al. 2005). Its position on the HR diagram is, however, closer to 300 Myr isochrone, but the isochrones at ages larger than 50 Myr are very close to each other for Teff > 5000 K, such that they are not very useful to infer ages in this case. The space velocity components derived by us (Fig. 10) confirm the membership to the AB Dor association.
 - #20
RasTyc 2016+3106 (=HD 332091) was identified as the optical counterpart of the X-ray source 1RXS J200449.5-023915 by Haakonsen & Rutledge (2009). A temperature about 350 K cooler than our value was found by Muñoz Bermejo et al. (2013), who analyzed the same ELODIE spectra acquired by us. We note that our temperature value, Teff = 5082 K is closer to the value of 5500 K derived with the Pecaut & Mamajek (2013) calibrations from the dereddened color index
 mag than the value Teff = 4704 K reported by Muñoz Bermejo et al. (2013). The Hα line is a faint emission feature in all the three ELODIE spectra with a variation of ≈30%. The kinematics of this star suggest membership to the Pleiades SKG.
 - #21
RasTyc 2036+3456 (=TYC 2694-1627-1). A temperature about 160 K cooler than our value was found by Muñoz Bermejo et al. (2013) from the analysis of our ELODIE spectrum. The Hα line is filled in by core emission. The kinematics of this star suggest membership to the Pleiades SKG.
- #22
RasTyc 2039+2644 (=TYC 2178-1225-1) is given as a rotationally variable star in Simbad. The variability with a period Prot ≃ 3.485 d and a variation amplitude in the V band of 0.06 mag has been detected by ASAS (Kiraga & Stepien 2013). The components of the space velocity indicate a possible association with the Pleiades supercluster.
- #23
RasTyc 2106+6906 (=BD+68 1182) is a chromospherically active star with the Hα line filled in by core emission and v sin i ≃ 40 km s−1. Both the position on the HR diagram (Fig. 7) and on the
 –WLi
diagram (Fig. 5) indicate a PMS object with an age of ≈20–30 Myr. Its space-velocity components are close to those of the other stars in the Cepheus flare region discovered by Guillout et al. (2010). Despite the large apparent distance on the sky, both the kinematics and age suggest that RasTyc 2106+6906 could be related to this stellar group.
–WLi
diagram (Fig. 5) indicate a PMS object with an age of ≈20–30 Myr. Its space-velocity components are close to those of the other stars in the Cepheus flare region discovered by Guillout et al. (2010). Despite the large apparent distance on the sky, both the kinematics and age suggest that RasTyc 2106+6906 could be related to this stellar group. - #24
RasTyc 2120+4636 (=TYC 3589-3858-1) was identified as the optical counterpart of the X-ray source RX J2120.9+4636 by Motch et al. (1997), who derived a spectral type F9V on the basis of medium-resolution spectra. Our spectral classification (G1.5 V) is in fairly good agreement with the previous work. It is classified as a rotationally variable star in Simbad. The variability with a period Prot ≃ 0.266 d and a variation amplitude in the V band of 0.08 mag has been detected by ASAS (Kiraga & Stepien 2013). RasTyc 2120+4636 is a very fast rotating star (v sin i ≃ 110 km s−1) with a filled Hα line. Its space velocity components are far from the known young SKGs. It is also outside the locus of the YD population (see Fig. 10). With only one spectrum, we cannot exclude that this source is an SB1 system observedfar from the conjunction.
- #25
RasTyc 2223+7741 (=BD+76 857a). Both the position on the HR diagram (Fig. 7) and on the
 –WLi
diagram (Fig. 5) indicate a PMS object with an age of ≈20 Myr. Its space-velocity components are close to the Castor SKG and Cepheus flare group.
–WLi
diagram (Fig. 5) indicate a PMS object with an age of ≈20 Myr. Its space-velocity components are close to the Castor SKG and Cepheus flare group. - #26
RasTyc 2233+1040 (=TYC 1154-1546-1) was identified as the optical counterpart of the X-ray source RX J2232.9+1040 by Appenzeller et al. (1998). Zickgraf et al. (2005) gave an uncertain spectral type K2V: Teff = 4836 K, v sin i = 97 km s−1, and WLi = 285 mÅ, which lead to an abundance A(Li) = 2.76. With these parameters, they classified the source as a ZAMS star with a lithium abundance between the lower and upper envelope of the Pleiades. We find a very similar WLi = 282 mÅ, but a very different temperature (Teff = 5544 K) and projected rotation velocity (v sin i = 234 km s−1). As a consequence of the higher Teff, we determine a much higher lithium abundance, A(Li) = 3.65 and the star lies over the Pleiades upper envelope, both in Figs. 5 and 6. We note that the Tycho B − V = 0.558, which becomes
 considering the reddening, is inconsistent with both the Zickgraf et al. (2005) and our Teff determinations. The color listed in the APASS catalog (Henden et al. 2016), B − V = 0.723 or
 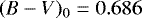 , agrees much better with our Teff determination and that of 5361 K by Ammons et al. (2006). This star, owing to the aforementioned inconsistencies, deserves future investigations.
 - #27
RasTyc 2241+1430 (=HD 214995) was identified as the optical counterpart of the X-ray source RX J2241.9+1431 by Appenzeller et al. (1998). Zickgraf et al. (2005) reported a K0III spectral type, Teff = 5152 K, WLi = 307 mÅ, A(Li) = 3.36 and classified this star as evolved lithium-rich. The strong lithium line (WLi = 389 mÅ) was confirmed by Luck & Heiter (2007). It was originally included in our list of ELODIE targets, but, based on the literature following our observations and on our results, we discard RasTyc 2241+1430 as PMS candidate and confirm its nature as a lithium-rich giant. The values of Teff and logg listed in the PASTEL catalog (Soubiran et al. 2010) are in the ranges 4560–4709 K and 2.61–2.70 dex, respectively. Our determinations (Table A.4) are in very good agreement with these values.
- #28
RasTyc 2244+1754 (=BD+17 4799) is given as a K2 star in Simbad. This source was selected by Jeffries (1995) as optical counterpart of an extreme ultraviolet source. From intermediate-resolution spectroscopy, he estimated a spectral type K0V/IV, RV spanning from 0.7 to 5.9 km s−1, WLi ≃ 300 mÅ, and was also able to obtain a spectrum of a secondary visual component of spectral type M2Ve, V = 12.7 mag, and RV = − 2.5 km s−1, with a separation of about 3′′; from kinematical analysis the system turned out to belong to the Local Association. From high-resolution spectroscopy, Fekel (1997) found for the primary visual component RV = − 20.2 km s−1, suggesting a SB1 behavior, and v sin i = 11.4 km s−1. Christian & Mathioudakis (2002) gave v sin i = 8 km s−1 and WLi = 244 mÅ (A(Li) = 2.8) in excellent agreement with our values (see Table A.4). López-Santiago et al. (2010) found from high-resolution spectra an average RV = − 16.4 km s−1, v sin i = 11.03 km s−1 and WLi = 248 mÅ, confirming the membership to the Local Association. Their values of Hα equivalent width in the subtracted spectrum,
 , are in the range 0.51–0.76 Å, in good agreement with our values of 0.60–0.72 Å. The spectrum of this source is shown in Fig. 2. The two RV values measured in our spectra are − 16.58 and − 15.28 whose difference is larger than the sum of errors. For this reason and from the literature data, we consider this star as SB1. The kinematical properties are still consistent with the Local Association, but the velocity components are closer tothe AB Dor association (see Fig. 10).
 - #29
RasTyc 2246+5749 (=TYC 3992-349-1) has only one reference in Simbad. It has been used as a local photometric standardstar by Henden et al. (1999), who provide BV RCIC photometry, in a study of two eclipsing variables in Cepheus. Its space velocity components are far from the known young associations. It is also outside the locus of the YD population (see Fig. 10). With only one spectrum, we cannot exclude that this source is an SB1 system observed far from the conjunction.
- #30
RasTyc 2307+3150 (=TYC 2751-9-1) is given as a K-type variable star in Simbad. In the General Catalogue of Variable Stars (GCVS; Samus et al. 2012) a period Prot = 7.7129 d with an amplitude of 0.04 mag is given. The space-velocity components are fairly consistent with Octans association or Castor group.
- #31
RasTyc 2320+7414 (=V395 Cep) is given as a variable star of Orion type in Simbad. Herbig (1977) reported a radial velocity of − 10 km s−1 with a strong Li I line and a spectral type G5-8Ve. In the Catalog of Emission-Line Stars of the Orion Population, Herbig & Bell (1988) reported emission in the Hα line with an equivalent width of about 8 Å and located the star in the L1259 nebulosity. In a study of PMS stars in the Cepheus flare region, Kun et al. (2009) classified this object as a CTTS belonging to the L1261 cloud. With the exception of the two lithium-rich giants, this is the star with the highest position on the HR diagram, close to the 5 Myr isochrone of Siess et al. (2000). Our SARG spectrum displays a broad double-peaked Hα emission profile with a central absorption, which is typical of CTT stars.
- #32
RasTyc 2321+0721 (=TYC 584-343-1) is given as a rotationally variable star in Simbad. A rotation period Prot ≃ 2.5 d and an amplitude ΔV ≃ 0.076 mag are reported by Watson et al. (2015). Torres et al. (2006) quoted a K0V spectral type, v sin i = 14.6 km s−1 and WLi ≃ 300 mÅ. Muñoz Bermejo et al. (2013), from the analysis of our ELODIE spectrum, found Teff = 5221 K. Our determinations (K0V, Teff = 5207 K, v sin i = 14.3 km s−1, WLi = 277 ± 25 mÅ) are in excellent agreement with the aforementioned values from the literature. A visual companion at 5. ′′1, which is 2 mag fainter in the J band, has been discovered by Elliott et al. (2015). Both the position on the HR diagram (Fig. 7) and on the
 –WLi diagram (Fig. 5) indicate a young object with an age of ≈30 Myr. Its space-velocity components are just outside the YD locus but they are not far from those of the Octans association.
 - #33
RasTyc 2351+7739 (=TYC 4606-740-1). In the Tycho Double Star Catalogue (Fabricius et al. 2002) it is quoted as a close visual binary with a separation of 0. ′′82 and components of V magnitudes 11.34 and 11.49 mag. The position on the
 –WLi diagram (Fig. 5) indicates a PMS-like object on the upper envelope of the IC 2602 cluster (age ≈ 30 Myr).Unfortunately, the parallax is not available, preventing us from placing this object on the HR diagram and investigating its kinematical properties.
 -
a
RasTyc 0106+3306 (=TYC 2282-1396-1) is quoted as a close visual pair (ρ = 0. ′′85, ΔV ≃ 0.29 mag; Fabricius et al. 2002). The B − V color reported in Tycho catalog (B − V = 1.092 mag) is probably unreliable as are the individual colors of both components (B − V ≈ 1.0 − 1.1 mag; Fabricius et al. 2002), which are at odds with our spectral classification. This could be due to the binary nature of the source. However, the value of B − V = 0.646 mag reported by Henden et al. (2016) agrees much better with our G4V type and Teff = 5606 K. With this color RasTyc 0106+3306 would move to the left side in the
 –WLi diagram (Fig. 5), overcoming the Pleiades upper envelope. The parallax is not available, preventing us from placing this object on the HR diagram and investigating its kinematical properties. Anyway, Dias et al. (2014) considered this star as a member of the cluster Platais 2 (age ~ 350 Myr).
 -
b
RasTyc 0249+4255 (=BD+42 636) is given as a G3 star of the NGC 1039 OC (d = 499 pc, age = 180 My) in Simbad. Kharchenko et al. (2004) found that the star is not a member of NGC 1039. Indeed, the Gaia DR1 TGAS distance, d = 118.3 ± 13.9 pc, is inconsistent with NGC 1039. The space-velocity components are close to those of the TW Hya association.
-
c
RasTyc 0344+5043 (=TYC 3325-98-1) is reported as a close pair in the WDS catalog (Mason et al. 2001) and has a separation of 0. ′′7 and components of magnitudes 10.80 and 12.80 mag. This star is well inside the inner radius of the α Per cluster, but its photometry and kinematics exclude membership to the cluster (Kharchenko et al. 2004). The Gaia DR1 parallax is not available, preventing us from placing this object on the HR diagram and investigating its kinematical properties.
-
d
RasTyc 0646+4147 (=TYC 2949-780-1) has no specific reference in Simbad.
-
e
RasTyc 1731+2815 (=TYC 2087-1742-1) is quoted as a rotationally variable star in Simbad. The rotation period of about 1.26 d was measured both by SuperWASP (Norton et al. 2007) and ASAS (Kiraga 2012) observations. Dragomir et al. (2007) associated the X-ray source 1RXS J173103.4+281510 with this optical counterpart and classified it as a G/K star from low-resolution spectra. This star was observed spectroscopically by Binks et al. (2015) who found RV = –18.2 ± 0.5 km s−1, WLi = 265 ± 36 mÅ, and a faint Hα absorption line with equivalent width of 0.19 Å. They estimated the age in the range 30–150 Myr, based on WLi, and a lower limit of 37 Myr, on the basis of the Hα and (V − I) color. Our values of RV = − 19.22 ± 0.62 km s−1 and WLi = 243 ± 22 mÅ are not significantly different from that of Binks et al. (2015). The Hα line is totally filled in with emission.
-
f
RasTyc 1956+4345 (=KIC 7985370) was discovered as a periodic variable in the field of the Kepler space telescope by Pigulski et al. (2009), who found a period Prot = 0.4249 d and amplitudes of 0.04 mag and 0.02 mag in the V and I light curves, respectively. The Kepler light curves were analyzed by Fröhlich et al. (2012) who redetermined the period as2.86 d and reconstructed the starspot distribution and evolution over 229 days with a Bayesian spot model. In addition to measuring the differential rotation, Fröhlich et al. (2012) have also measured the atmospheric parameters, RV, v sin i, WLi, and chromospheric fluxes from the analysis of SARG and FRESCO spectra. These data have also been used in the present work. As already discussed by Fröhlich et al. (2012), the kinematical properties of KIC 7985370 indicate it is a member of the Local Association (Pleiades SKG).
-
g
RasTyc 2038+3546 (=BD+35 4198) was included in the bright catalog (Paper I) but the ELODIE spectrum was not analyzedwith ROTFIT. In the present paper, the analysis of the ELODIE and a new SARG spectrum provided us with revised values of atmospheric parameters, WLi, and
 . The value of Teff we find (5895 K) is slightly larger than in Paper I and agrees better with the determination of 5954 K by Muñoz Bermejo et al. (2013). Based on its kinematical properties, it could be a member of the Pleiades SKG.
 -
h
RasTyc 2114+3941 (=BD+39 4490) was included in the RasTyc bright catalog (Paper I) but the ELODIE spectrum was not analyzed with ROTFIT. In that paper the parameters were derived from two AURELIE spectra, which providedTeff = 5731 K, WLi = 101 mÅ, and
 mÅ. The ELODIE spectrum is higher quality, especially in terms of its wider spectral range, and provides us with a higher value of Teff (5930 K); this agrees better with the value of 5955 K derived by Muñoz Bermejo et al. (2013). The slightly larger WLi = 131 ± 27 mÅ measured in the ELODIE spectrum leads to a lithium abundance A(Li)=3.01, which brings the star just above the Pleiades upper envelope in Fig. 6. We also find a higher
  mÅ, which is likely due to variations of the chromospheric activity. The U⊙ and V ⊙ velocity components are close to Castor, but the W⊙ is not.
 -
i
RasTyc 2203+3809 (=TYC 3198-1809-1) has no specific reference in Simbad. We did not find any spectroscopic study in the literature. This object lies under the Pleiades upper envelope in the
 –WLi
diagram (Fig. 5), but it is just above it in the diagram Teff–A(Li) (Fig. 6).
–WLi
diagram (Fig. 5), but it is just above it in the diagram Teff–A(Li) (Fig. 6). -
j
RasTyc 2308+0000 (=TYC 576-1220-1) is quoted as a PMS star in Simbad. It was associated with the X-ray source RX J2308.8+0001 by Zickgraf et al. (2003). Torres et al. (2006) quoted a G8V spectral type, RV = 7.4 km s−1, v sin i = 39.0 ± 9.0 km s−1 and WLi = 250 mÅ. We find an earlier spectral type (G2V) and a slightly lower WLi = 216 ± 43 mÅ. The v sin i value of 42.8 ± 5.2 km s−1 agrees with that of Torres et al. (2006), but the RV = 5.30 ± 0.22 km s−1 can be indicative of an SB1 system, even though Torres et al. (2006) did not provide the error of their RV measure. However, an RV variation is also indicated by the value of RV = 1.696 ± 2.642 km s−1 reported in the RAVE 5th data release (Kunder et al. 2017). In this catalog, values for the atmospheric parameters of Teff = 6000 K, logg = 4.00, and [Fe/H] = –0.25 are also reported. The effective temperature of Teff = 5533 K derived by Kunder et al. (2017) with the infrared flux method is in better agreement with our determination of Teff = 5620 ± 211 K. This star lies between the 20- and 30-Myr isochrones in the HR diagram (Fig. 7) and close to the UVW position of Octans association.
-
k
RasTyc 2324+6215 (=TYC 4283-219-1) has no specific reference in Simbad, where an F8 spectral type is reported. The Gaia DR1 parallax is not available, preventing us from placing this object on the HR diagram and investigating in detail its kinematical properties.
References
- Abrahamyan, H. V., Mickaelian, A. M., & Knyazyan, A. V. 2015, Astron. Comput., 10, 99 [NASA ADS] [CrossRef] [Google Scholar]
- Alcalá. J. M., Nanara, C. F., Natta, A., et al. 2017, A&A, 600, A20 [NASA ADS] [CrossRef] [EDP Sciences] [Google Scholar]
- Ammons, S.M., Robinson, S.E., Strader, J., et al. 2006, ApJ, 638, 1004 [NASA ADS] [CrossRef] [Google Scholar]
- Appenzeller, I., Thiering, I., Zickgraf, F.-J., et al. 1998, ApJS, 117, 319 [NASA ADS] [CrossRef] [Google Scholar]
- Asiain, R., Figueras, F., & Torra, J. 1999, A&A, 350, 434 [NASA ADS] [Google Scholar]
- Bally, J. 2008, in Handbook of Star Forming Regions, ed. B. Reipurth (ASP Monograph Publications), I, 459 [Google Scholar]
- Barrado y Navascués, D., De Castro, E., Fernández-Figueroa, M. J., Cornide, M., & García López, R. J. 1998, A&A, 337, 739 [NASA ADS] [Google Scholar]
- Biazzo, K., Alcalá, J. M., Covino, E., et al. 2012a, A&A, 542, A115 [NASA ADS] [CrossRef] [EDP Sciences] [Google Scholar]
- Biazzo, K., Alcalá, J. M., Covino, E., et al. 2012b, A&A, 547, A104 [NASA ADS] [CrossRef] [EDP Sciences] [Google Scholar]
- Binks, A. S, Jeffris, R. D., & Maxted, P. F. L. 2015, MNRAS, 452, 173 [NASA ADS] [CrossRef] [Google Scholar]
- Bobylev, V. V., 2014, Astrophysics, 57, 583 [NASA ADS] [Google Scholar]
- Boller, T., Freyberg, M. J., Truemper, J., et al. 2016, A&A, 588, A103 [NASA ADS] [CrossRef] [EDP Sciences] [Google Scholar]
- Bonchkarev, N. G. 1984, Ap&SS, 138, 229 [NASA ADS] [CrossRef] [Google Scholar]
- Brandner, W., Alcalá, J. M., Kunkel, M., Moneti, A., & Zinnecker, H. 1996, A&A, 307, 121 [NASA ADS] [Google Scholar]
- Cameron, A. G. W., & Fowler, W. A. 1971, ApJ, 164, 111 [Google Scholar]
- Charbonnel, C., & Balachandran, S. C. 2000, A&A, 359, 563 [NASA ADS] [Google Scholar]
- Christian, D. J., & Mathioudakis, M. 2002, AJ, 123, 2796 [NASA ADS] [CrossRef] [Google Scholar]
- Comerón, F., & Torra, J. 1997, A&A, 281, 35 [Google Scholar]
- Cutri, R. M., Skrutskie, M. F., Van Dyk, S., et al. 2003, 2MASS All-Sky Catalog of Point Sources, University of Massachusetts and Infrared Processing and Analysis Center (IPAC/California Institute of Technology) [Google Scholar]
- Cutri, R. M., et al. 2013, AllWISE Data Release, IPAC/Caltech University of Massachusetts and Infrared Processing and Analysis Center (IPAC/California Institute of Technology) [Google Scholar]
- da Silva, L., Torres, C. A. O., de La Reza, R., et al. 2009, A&A, 508, 833 [NASA ADS] [CrossRef] [EDP Sciences] [Google Scholar]
- de la Reza, R., & Drake, N. A. 2012, ASP Conf. Ser., 464, 51 [NASA ADS] [Google Scholar]
- de la Reza, R., Drake, N. A., & da Silva, L. 1996, ApJ, 456, 115 [NASA ADS] [Google Scholar]
- Desidera, S., Covino, E., Messina, S., et al. 2015, A&A, 573, A126 [NASA ADS] [CrossRef] [EDP Sciences] [Google Scholar]
- Dias, W. S., Monteiro, H., Caetano, T. C., et al. 2014, A&A, 564, A79 [NASA ADS] [CrossRef] [EDP Sciences] [Google Scholar]
- Dragomir, D., Roy, P., & Rutledge, R. E. 2007, AJ, 133, 2495 [NASA ADS] [CrossRef] [Google Scholar]
- Drake, N. A., de la Reza, R., da Silva, L., & Lambert, D. L. 2002, AJ, 123, 2703 [NASA ADS] [CrossRef] [Google Scholar]
- Droege, T. F., Richmond, M. W., Sallman, M. P., & Creager, R. P. 2006, PASP, 118, 1666 [NASA ADS] [CrossRef] [Google Scholar]
- Eggen, O. J. 1996, AJ, 112, 1595 [NASA ADS] [CrossRef] [Google Scholar]
- Elias, F., Alfaro, E. J., & Cabrera-Caño, J. 2009, MNRAS, 397, 2 [NASA ADS] [CrossRef] [MathSciNet] [Google Scholar]
- Elliott P., Bayo, A., Melo, C. H. F., et al. 2014, A&A, 568, A26 [NASA ADS] [CrossRef] [EDP Sciences] [Google Scholar]
- Elliott P., Huelamo N., Bouy, H., et al. 2015, A&A, 580, A88 [NASA ADS] [CrossRef] [EDP Sciences] [Google Scholar]
- Fabricius, C., Høg, E.; Makarov, V. V., et al. 2002, A&A, 384, 180 [NASA ADS] [CrossRef] [EDP Sciences] [Google Scholar]
- Fekel, F. C. 1997, PASP, 109, 514 [NASA ADS] [CrossRef] [Google Scholar]
- Fekel, F. C., & Balachandran, S. 1993, ApJ, 403, 708 [NASA ADS] [CrossRef] [Google Scholar]
- Feigelson, E. D. 1996, ApJ, 468, 306 [NASA ADS] [CrossRef] [Google Scholar]
- Folsom C. P., Petit, P., Bouvier, J., et al. 2016, MNRAS, 457, 580 [NASA ADS] [CrossRef] [Google Scholar]
- Frasca, A., & Catalano, S. 1994, A&A, 284, 883 [NASA ADS] [Google Scholar]
- Frasca, A., Freire Ferrero, R., Marilli, E., & Catalano, S. 2000, A&A, 364, 179 [NASA ADS] [Google Scholar]
- Frasca, A., Guillout, P., Marilli, E., et al. 2006, A&A, 454, 301 [NASA ADS] [CrossRef] [EDP Sciences] [Google Scholar]
- Frasca, A., Covino, E., Spezzi, L., et al. 2009, A&A, 508, 1313 [NASA ADS] [CrossRef] [EDP Sciences] [Google Scholar]
- Frasca, A., Biazzo, K., Kővári, Zs., Marilli, E., & Çak"i"rl"i", Ö. 2010, A&A, 518, A48 [NASA ADS] [CrossRef] [EDP Sciences] [Google Scholar]
- Frasca, A., Fröhlich, H.-E., Bonanno, A., et al. 2011, A&A, 523, A81 [NASA ADS] [CrossRef] [EDP Sciences] [Google Scholar]
- Frasca, A., Biazzo, K., Lanzafame, A. C., et al. 2015, A&A, 575, A4 [NASA ADS] [CrossRef] [EDP Sciences] [Google Scholar]
- Fröhlich, H.-E. 2007, Astron. Nachr., 238, 1037 [NASA ADS] [CrossRef] [Google Scholar]
- Fröhlich, H.-E., Frasca, A., Catanzaro, G., et al. 2011, A&A, 543, A146 [Google Scholar]
- Gaia Collaborations, (Brown, A. G. A., et al.) 2016, A&A, 595, A2 [NASA ADS] [CrossRef] [EDP Sciences] [Google Scholar]
- Galicher R., Marois C., Macintosh B., et al. 2016, A&A, 594, A63 [NASA ADS] [CrossRef] [EDP Sciences] [Google Scholar]
- Gehrels, N., & Chen, W. 1993, Nature, 361, 706 [NASA ADS] [CrossRef] [Google Scholar]
- Gillet, D., Burnage, R., Kohler, D., et al. 1994, A&AS, 108, 181 [NASA ADS] [Google Scholar]
- Girardi, L., Bressan, A., Bertelli, G., & Chiosi, C. 2000, A&AS, 141, 371 [NASA ADS] [CrossRef] [EDP Sciences] [Google Scholar]
- Glebocki, R., & Gnacinski, P. 2005, The Catalogue of Rotational Velocities of Stars, ESA SP, 560, 571 [Google Scholar]
- Guillout, P., & Motch, C. 2003, Astron. Nachr., 324, 81 [NASA ADS] [CrossRef] [Google Scholar]
- Guillout, P., Sterzik, M. F., Schmitt, J. H. M. M., et al. 1998a, A&A, 334, 540 [NASA ADS] [Google Scholar]
- Guillout, P., Sterzik, M. F., Schmitt, J. H. M. M., et al. 1998b, A&A, 337, 113 [NASA ADS] [Google Scholar]
- Guillout, P., Schmitt, J. H. M. M., Egret, D., et al. 1999, A&A, 351, 1003 [NASA ADS] [Google Scholar]
- Guillout, P., Hérent, O., & Motch, C. 2006, in The X-ray Universe 2005, ed. A. Wilson, (ESA SP-604), 89 [Google Scholar]
- Guillout, P., Klutsch, A., Frasca, A., et al. 2009, A&A, 504, 829 (Paper I) [NASA ADS] [CrossRef] [EDP Sciences] [Google Scholar]
- Guillout, P., Frasca, A., Klutsch, A., Marilli, E., & Montes, D. 2010, A&A, 520, A94 [NASA ADS] [CrossRef] [EDP Sciences] [Google Scholar]
- Gray, D. F. 1992, The Observation and Analysis of Stellar Photospheres, 2nd ed. (Cambridge University Press) [Google Scholar]
- Haakonsen, C. B., & Rutledge, R. E. 2009, ApJS, 184, 138 [NASA ADS] [CrossRef] [Google Scholar]
- Hauschildt, P. H., Allard, F., & Baron, E. 1999, ApJ, 512, 377 [NASA ADS] [CrossRef] [Google Scholar]
- Helou, G., & Walker, D. W. 1995, Infrared astronomical satellite catalogs and atlases. Vol. 7: The small scale structure catalog – Technical Report (Washington, DC: NASA) [Google Scholar]
- Henden, A. A., Guarro-Flo, J., & Garcia-Melendo, E. 1999, Inf. Bull. Var. Stars, 4807 [Google Scholar]
- Henden, A. A., Levine, S., Terrell, D., & Welch, D. L. 2015, APASS - The Latest Data Release, Amer. Astron. Soc. Meet., 225, 336 [Google Scholar]
- Herbig, G. H. 1977, ApJ, 214, 747 [NASA ADS] [CrossRef] [Google Scholar]
- Herbig, G. H. 1985, ApJ, 289, 269 [NASA ADS] [CrossRef] [Google Scholar]
- Herbig, G. H., Bell, K. R. 1988, Lick Observatory Bull. No. 1111 [Google Scholar]
- Høg, E., Fabricius, C., Makarov, V.V., et al. 2000, A&A, 355, L27 [Google Scholar]
- Hoogerwerf, R. 2000, MNRAS, 313, 43 [NASA ADS] [CrossRef] [Google Scholar]
- Horch, E. P., Van Belle, G. T., Davidson, J. W. Jr., et al. 2015, AJ, 150, 151 [NASA ADS] [CrossRef] [Google Scholar]
- Ishihara, D., Onaka, T., Kataza, H., et al. 2010, A&A, 514, A1 [NASA ADS] [CrossRef] [EDP Sciences] [Google Scholar]
- Jeffries, R. D. 1995, MNRAS, 273, 559 [NASA ADS] [Google Scholar]
- Jenkins, J. S., Murgas, F., Rojo, P., et al. 2011, A&A, 531, A8 [NASA ADS] [CrossRef] [EDP Sciences] [Google Scholar]
- Johnson, D. R. H. & Soderblom, D. R. 1987, AJ, 93, 864 [NASA ADS] [CrossRef] [Google Scholar]
- Katz, D., Soubiran, C., Cayrel, R., Adda, M., & Cautain, R. 1998, A&A, 338, 151 [NASA ADS] [Google Scholar]
- Kharchenko, N. V., Piskunov, A. E., Roeser, S., Schilbach, E., & Scholz, R.-D. 2004, Astron. Nachr., 325, 740 [NASA ADS] [CrossRef] [Google Scholar]
- Kiraga, M. 2012, Acta Astron., 62, 67 [NASA ADS] [Google Scholar]
- Kiraga, M., & Stepien K. 2013, Acta Astron., 63, 53 [NASA ADS] [Google Scholar]
- Klutsch, A., Frasca, A., Guillout, P., et al. 2008, A&A, 490, 737 [NASA ADS] [CrossRef] [EDP Sciences] [Google Scholar]
- Kun, M., Balog, Z., Kenyon, S. J., Mamajek, E. E., & Gutermuth, R. A. 2009, ApJS, 185, 451 [NASA ADS] [CrossRef] [Google Scholar]
- Kunder, A., Kordopatis, G., Steinmetz, M., et al. 2017, AJ, 153, 75 [NASA ADS] [CrossRef] [Google Scholar]
- Lada, C. J. 1987, in Star forming regions, IAU Symp., 115, 1 [Google Scholar]
- Li, J. Z. 2004, Chin. J. Astron. Astrophys., 4, 258 [NASA ADS] [CrossRef] [Google Scholar]
- Li, J. Z., Hu, J. Y. 1998. A&AS, 132, 173 [NASA ADS] [CrossRef] [EDP Sciences] [Google Scholar]
- López-Santiago, J., Montes, D., Gálvez-Ortiz, M. C., et al. 2010, A&A, 514, A97 [NASA ADS] [CrossRef] [EDP Sciences] [Google Scholar]
- Luck, R. E., & Heiter U. 2007, AJ, 133, 2464 [NASA ADS] [CrossRef] [Google Scholar]
- Luhman, K. L., Stauffer, J. R., & Mamajek, E. E. 2005, ApJ, 628, L69 [NASA ADS] [CrossRef] [Google Scholar]
- Makarov, V. V. 2006, AJ, 131, 2967 [NASA ADS] [CrossRef] [Google Scholar]
- Marilli, E., Catalano, S., & Frasca, A. 1997, Mem. Soc. Astron. Ital., 68, 895 [NASA ADS] [Google Scholar]
- Martínez-Arnáiz, R., López-Santiago, J., Crespo-Chacón, I., & Montes, D. 2011, MNRAS, 414, 2629 [NASA ADS] [CrossRef] [Google Scholar]
- Mason, B.D., Wycoff, G.L., Hartkopf, W.I., Douglass, G.G., & Worley, C.E. 2001, AJ, 122, 3466 [Google Scholar]
- Messina, S., Desidera, S., Turatto, M., Lanzafame, A. C., & Guinan, E. F. 2010, A&A, 520, 15 [Google Scholar]
- Metchev, S. A., & Hillenbrand, L. A. 2009, ApJS, 181, 62 [NASA ADS] [CrossRef] [Google Scholar]
- Moultaka, J., Ilovaisky, S. A., Prugniel, P., & Soubiran, C. 2004, PASP, 116, 693 [NASA ADS] [CrossRef] [Google Scholar]
- Monet, D. G., Levine, S. E., Canzian, B., et al. 2003, AJ, 125, 984 [NASA ADS] [CrossRef] [Google Scholar]
- Montes, D., Fernández-Figueroa, M. J., De Castro, E., & Cornide, M. 1995, A&AS, 109, 135 [NASA ADS] [Google Scholar]
- Montes, D., López-Santiago, J., Fernández-Figueroa, M. J., & Gálvez, M. C. 2001a, A&A, 379, 976 [NASA ADS] [CrossRef] [EDP Sciences] [Google Scholar]
- Montes, D., López-Santiago, J., Gálvez, M. C., et al. 2001b, MNRAS, 328, 45 [NASA ADS] [CrossRef] [MathSciNet] [Google Scholar]
- Motch, C., Guillout, P., Haberl, F., et al. 1997, A&A 318, 111 [NASA ADS] [Google Scholar]
- Motch, C., Guillout, P., Haberl, F., et al. 1998, A&AS, 132, 341 [NASA ADS] [CrossRef] [EDP Sciences] [Google Scholar]
- Muñoz Bermejo, J., Asensio Ramos, A., & Allende Prieto, C. 2013, A&A, 553, A95 [NASA ADS] [CrossRef] [EDP Sciences] [Google Scholar]
- Neuhäuser, R., Torres, G., Sterzik, M. F., & Randich,. 1997, A&A, 325, 647 [NASA ADS] [Google Scholar]
- Nidever, D. L., Marcy, G. W., Butler, R. P., Fischer, D. A. & Vogt, S. S. 2002, ApJS, 141, 503 [NASA ADS] [CrossRef] [Google Scholar]
- Nordström, B., Mayor, M., Andersen, J., et al. 2004, A&A, 418, 989 [NASA ADS] [CrossRef] [EDP Sciences] [Google Scholar]
- Norton, A. J., Wheatley, P. J., West, R. G., et al. 2008, A&A, 467, 785 [Google Scholar]
- Pallavicini, R., Randich, S., & Giampapa, M. S. 1992, A&A, 253, 185 [NASA ADS] [Google Scholar]
- Pecaut, M. J., & Mamajek, E. E. 2013, ApJS, 208, 9 [NASA ADS] [CrossRef] [Google Scholar]
- Pigulski, A., Pojman’ski, G., Pilecki, B. & Szczygiel, D. M. 2009, Acta Astron., 59, 33 [NASA ADS] [Google Scholar]
- Piskunov, A. E., Kharchenko, N. V., Schilbach, E., et al. 2008, A&A, 487, 557 [NASA ADS] [CrossRef] [EDP Sciences] [Google Scholar]
- Prosser, C. F. 1992, AJ, 103, 488 [NASA ADS] [CrossRef] [Google Scholar]
- Queloz, D., Allain, S., Mermilliod, J.-C., Bouvier, J., & Mayor, M. 1998, A&A, 335, 183 [NASA ADS] [Google Scholar]
- Riedel, A. R., Blunt, S. C., Lambrides, E. L., et al. 2017, AJ, 153, 95 [NASA ADS] [CrossRef] [Google Scholar]
- Rucinski, S. M., Pribulla, T., Mochnacki, S. W., et al. 2008, AJ, 136, 586 [NASA ADS] [CrossRef] [Google Scholar]
- Samus, N. N., Durlevich, O. V., Kazarovets, E. V., et al. 2012, GCVS database, Version 2012 Jan, CDS B/gcvs [Google Scholar]
- Savanov, I. S. 2011, Astron. Rep., 55, 801 [NASA ADS] [CrossRef] [Google Scholar]
- Sestito, P. & Randich S. 2005, A&A, 442, 615 [NASA ADS] [CrossRef] [EDP Sciences] [Google Scholar]
- Siess, L., Dufour, E., & Forestini, M. 2000, A&A, 358, 593 [NASA ADS] [Google Scholar]
- Soderblom, D. R., Oey, M. S., Johnson, D. R. H., & Stone, R. P. S. 1990, AJ, 99, 595 [NASA ADS] [CrossRef] [Google Scholar]
- Soderblom, D. R., Stauffer, J. R., Hudon, J. D., & Jones, B. F. 1993a, ApJS, 85, 315 [NASA ADS] [CrossRef] [Google Scholar]
- Soderblom, D. R., Pilachowski, C. A., Fedel, S. B., & Jones, B. F. 1993b, AJ, 105, 2299 [NASA ADS] [CrossRef] [Google Scholar]
- Soderblom, D. R., Jones, B. F., Balachandran, S., et al. 1993c, AJ, 106, 1059 [NASA ADS] [CrossRef] [Google Scholar]
- Soubiran C., Le Campion J.-F., Cayrel de Strobel G., & Caillo A. 2010, A&A 515, A111 [NASA ADS] [CrossRef] [EDP Sciences] [Google Scholar]
- Stauffer, J. R., Hartmann, L. W., Prosser, C. F., et al. 1997, ApJ, 479, 776 [NASA ADS] [CrossRef] [Google Scholar]
- Sterzik, M. F., Alcalá, J. M., Neuhaeuser, R., & Schmitt, J. H. M. M. 1995, A&A, 297, 418 [NASA ADS] [Google Scholar]
- Skrutskie, M. F., Cutri, R. M., Stiening, R., et al. 2006, AJ, 131, 1163 [NASA ADS] [CrossRef] [Google Scholar]
- Torres, C. A. O., Quast, G. R., da Silva, L., et al. 2006, A&A, 460, 695 [NASA ADS] [CrossRef] [EDP Sciences] [Google Scholar]
- Tachihara, K., Neuhäuser, R., Kun, M., & Fukui, Y. 2005, A&A, 437, 919 [NASA ADS] [CrossRef] [EDP Sciences] [Google Scholar]
- The HIPPARCOS and Tycho Catalogues, 1997, ESA SP-1200 [Google Scholar]
- Udry, S., Mayor, M., & Queloz, D. 1999, Precise Stellar Radial Velocities, IAU Colloq., 170, eds. J. B. Hearnshaw, & C. D. Scarfe, ASP Conf. Ser., 185, 367 [Google Scholar]
- Uyama, T., Hashimoto, J., Kuzuhara, M., et al. 2017, AJ, 153, 106 [Google Scholar]
- van Leeuwen, F. 2007, A&A, 474, 653 [NASA ADS] [CrossRef] [EDP Sciences] [Google Scholar]
- Voges, W., Aschenbach, B., Boller, T., et al. 1999, A&A, 349, 389 [NASA ADS] [Google Scholar]
- Watson, C. L., Henden, A. A., & Price, A. 2015, AAVSO International Variable Star Index VSX - CDS/ADC Collection of Electronic Catalogues [Google Scholar]
- White, R. J., & Basri, G. 2003, ApJ, 582, 1109 [NASA ADS] [CrossRef] [Google Scholar]
- White, R. J., Gabor, J. M., & Hillenbrand, L. A. 2007, AJ, 133, 2524 [NASA ADS] [CrossRef] [Google Scholar]
- Wright, E. L. Eisenhardt, P. R. M., Mainzer, A.K., et al. 2010, AJ, 140, 1868 [NASA ADS] [CrossRef] [Google Scholar]
- Zacharias, N., Monet, D. G., Levine, S. E., et al. 2004, Amer. Astron. Soc. Meeting, 205, #4815, BAAS, 36, 1418 [Google Scholar]
- Zickgraf, F.-J., Engels, D., Hagen, H.-J., Reimers, D., & Voges, W. 2003, A&A, 406, 535 [NASA ADS] [CrossRef] [EDP Sciences] [Google Scholar]
- Zickgraf, F.-J., Krautter, J. Reffert, S., et al. 2005, A&A, 433, 151 [NASA ADS] [CrossRef] [EDP Sciences] [Google Scholar]
- Zinnecker, H. 2008, Workshop on Star Formation Across the Milky Way Galaxy (ESO) [Google Scholar]
- Zuckerman, B., Webb, R. A., Schwartz, M., & Becklin, E. E. 2001, ApJ, 549, L233 [NASA ADS] [CrossRef] [Google Scholar]
- Zuckerman, B., Song, I., & Bessell, M. S. 2004, ApJ, 613, L65 [NASA ADS] [CrossRef] [Google Scholar]
- Zuckerman, B., Vican, L., Song, I., & Schneider, A. 2013, ApJ, 778, 5 [NASA ADS] [CrossRef] [Google Scholar]

All Tables
Radial (RV) and rotational (v sin i) velocities for the single stars and SB1 binaries.
Radial (RV) and rotational (v sin i) velocities for the components of SB2 binaries.
Radial (RV) and rotational (v sin i) velocities for the components of SB3 binaries.
Spectral types, atmospheric parameters, and equivalent widths of Li I and Hα lines for the single stars (S) and SB1 binaries.
All Figures
|
Fig. 1 Top panel: comparison between the v sin i values measured with ROTFIT and those derived from the FWHM of the cross-correlation peak (Table A.1). A different colored dot corresponds to each instrument, as indicated in the legend. The continuous line is the one-to-one relationship. Bottom panel: the residuals from the one-to-one relationship, excluding the values with vsin i ≥ 100 km s−1, have a mean of +0.38 km s−1 (dashed line) and a standard deviation of 2.26 km s−1 (dotted lines). |
| In the text | |
|
Fig. 2 Example of the subtraction technique applied to an active and lithium-rich star both in the lithium (upper panel) and Hα spectral regions (lower panel). In both panels, the continuum of the residual spectrum (blue line) is set to 1, while the original spectrum (full black line) and the non-active template (thin red line) are shifted downward by 0.3 in continuum units. The green lines indicate the residual absorption (for Li I) or emission (for Hα) profile that has been integrated to obtain the equivalent width. |
| In the text | |
|
Fig. 3 Teff– logg diagram for all the single stars and SB1 systems. The symbols are color coded by WLi (upper panel) and |
| In the text | |
|
Fig. 4 Hertzsprung-Russell diagram of the single and SB1 sources with known parallaxes. The symbols are color coded by log g. The evolutionary tracks of Girardi et al. (2000) are shown as solid lines with the labels representing their masses. The zero-age main sequence (ZAMS) with solar metallicity (Z = 0.019) and with Z = 0.001 by the same authors are also shown with a dashed and a dotted line, respectively. The lithium-rich giant candidates listed in Table 4 are enclosed in open squares. The two giants with the highest Li abundance are labeled as in Table 3. |
| In the text | |
|
Fig. 5 Equivalent width of the Li Iλ6707.8 line (WLi) plotted as a function of the dereddened Johnson |
| In the text | |
|
Fig. 6 Lithium abundance as a function of Teff for the stars in Table A.4. The upper envelopes of A(Li) for IC 2602, Pleiades, NGC 6475 (age ≈ 300 Myr), and Hyades clusters adapted from Sestito & Randich (2005) are overplotted. The meaning of the symbols is the same as in Fig. 5. Another 11 stars with high lithium content are found thanks to this diagram (open squares) and are labeled with letters from a to k, as in Table 3. |
| In the text | |
|
Fig. 7 Hertzsprung-Russell diagram of the PMS-like sources with known parallaxes. The symbols are as in Fig. 5. The PMS evolutionary tracks of Siess et al. (2000) are shown as solid lines with the labels representingtheir masses. The isochrones at ages of 1, 3, 10, 30, and 300 Myr are shown with dashed lines. The stars labeled as #17 and #27 lie above the 1-Myr isochrone and are likely lithium-rich giants. |
| In the text | |
|
Fig. 8 Hα flux (a) and |
| In the text | |
|
Fig. 9 Spectral energy distributions (dots) of the PMS-like sources and the two lithium-rich giants discussed in the paper. In each panel, the best fitting low-resolution NextGen spectrum (Hauschildt et al. 1999) is shown by a continuous line. Mid-infrared fluxes are shown with different symbols, as indicated in the legends of the plots. |
| In the text | |
|
Fig. 9 continued |
| In the text | |
|
Fig. 9 continued |
| In the text | |
|
Fig. 10 (V ⊙, U⊙) (left panel) and (V ⊙, W⊙) (right panel) diagrams for PMS-like sources and two lithium-rich giants discussed in the paper. The symbols are as in Fig. 5 and the labels are as in Table 3. The average velocity components (blue asterisks) of some young SKGs and the locus of the YD population (Eggen 1996) are also indicated in the (V ⊙, U⊙) plane. The position of the source #17 (V ⊙ = −2.5 km s−1, U⊙ = 83.5 km s−1) is out of thescale of the plot, as indicated by the red arrow. |
| In the text | |
Current usage metrics show cumulative count of Article Views (full-text article views including HTML views, PDF and ePub downloads, according to the available data) and Abstracts Views on Vision4Press platform.
Data correspond to usage on the plateform after 2015. The current usage metrics is available 48-96 hours after online publication and is updated daily on week days.
Initial download of the metrics may take a while.