| Issue |
A&A
Volume 611, March 2018
|
|
|---|---|---|
| Article Number | L2 | |
| Number of page(s) | 5 | |
| Section | Letters to the Editor | |
| DOI | https://doi.org/10.1051/0004-6361/201732521 | |
| Published online | 16 March 2018 | |
Letter to the Editor
Stellar metallicity variations across spiral arms in disk galaxies with multiple populations
1
GEPI, Observatoire de Paris, PSL Université, CNRS,
5 Place Jules Janssen,
92190
Meudon, France
e-mail: This email address is being protected from spambots. You need JavaScript enabled to view it.
2
Observatoire de Paris, LERMA, CNRS, PSL Univ., UPMC, Sorbonne Univ.,
75014
Paris, France
3
Collège de France,
11 Place Marcelin Berthelot,
75005
Paris, France
Received:
21
December
2017
Accepted:
24
January
2018
Abstract
This Letter studies the formation of azimuthal metallicity variations in the disks of spiral galaxies in the absence of initial radial metallicity gradients. Using high-resolution N-body simulations, we model composite stellar discs, made of kinematically cold and hot stellar populations, and study their response to spiral arm perturbations. We find that, as expected, disk populations with different kinematics respond differently to a spiral perturbation, with the tendency for dynamically cooler populations to show a larger fractional contribution to spiral arms than dynamically hotter populations. By assuming a relation between kinematics and metallicity, namely the hotter the population, the more metal-poor it is, this differential response to the spiral arm perturbations naturally leads to azimuthal variations in the mean metallicity of stars in the simulated disk. Thus, azimuthal variations in the mean metallicity of stars across a spiral galaxy are not necessarily a consequence of the reshaping, by radial migration, of an initial radial metallicity gradient. They indeed arise naturally also in stellar disks which have initially only a negative vertical metallicity gradient.
Key words: galaxies: evolution / galaxies: kinematics and dynamics / galaxies: structure
© ESO 2018
1 Introduction
The physical origin of spiral arms in disk galaxies is a classical problem of galactic astronomy (Shu 2016). Spiral structures can be interpreted as stationary discrete density waves (Lin & Shu 1964; Bertin et al. 1977; Lau & Bertin 1978; Bertin & Lin 1996, and references therein). Some studies, using N-body simulations, have pointed out that spiral arms in pure stellar disks are short-lived structures (e.g., Sellwood 2011; Baba et al. 2013), but the increase in numerical resolution (e.g., Fujii et al. 2011; D’Onghia et al. 2013) or the modeling of multicomponent stellar-gaseous disks (Orlova et al. 2002; Khoperskov et al. 2012; Ghosh & Jog 2015) have demonstrated that spiral waves can maintain their morphological structure for a longer time. Independently of their nature, spiral structures are seen in all disk components of late-type galaxies (see, e.g., Rix & Zaritsky 1995; Eskridge et al. 2002) where they appear as azimuthal variations in the baryonic density distribution.
Spiral arms in a stellar component can stimulate the formation of molecular clouds (e.g., Bonnell et al. 2006) and enhance star formation (e.g., Bigiel et al. 2008). Spirals can also induce radial migration of stars (Sellwood & Binney 2002). Hence their presence in a galaxy disk can generate differences in the mean chemical composition of starsin the arm and inter-arm regions. The existence of azimuthal variations in the chemical composition of stars has been well established by observations of different external spiral galaxies (e.g., Davies et al. 2009; Li et al. 2013; Ho et al. 2017; Vogt et al. 2017; Sánchez-Menguiano et al. 2018). In the Milky Way disk, the detection of azimuthal metallicity patterns has become possible quite recently through large spectroscopic surveys. For instance, analyzing RAVE data, Antoja et al. (2017) detected asymmetric metallicity patterns for a sample of stars in a cylinder of 0.5 kpc radius from the Sun. Using APOGEE red clump stars, Bovy et al. (2014) quantified the strength of azimuthal variations in the median metallicity of stars at few kiloparsec from the Sun to be on the order of 0.02 dex. Davies et al. (2009) reported strong (0.4 dex) azimuthal gradients for O, Mg, and Si by combining data from HII regions, Cepheids, B stars and red supergiant stars in the inner disk in a region that might be associated with the end of the Milky Way bar. These trends are usually interpreted to be due to the orbital effects of the Galactic bar and to the radial metallicity gradients in the disk.
Despite recent observational progress, only a few theoretical studies have investigated azimuthal variations in the metallicity (or abundances) of stars in a disk galaxy and their link to spiral structures. It has been shown that azimuthal variations can be generated by radial migration in a stellar disk that initially has a negative radial metallicity gradient. For instance, Di Matteo et al. (2013) have shown that radial migration induced by a bar leads to significant azimuthal variations in the metallicity distribution of old stars. The combination of both tangential and radial velocity asymmetries creates streaming motions along spirals, with metal-rich stars from the inner disk that migrate through spiral patterns to the outer parts of the disk (see, e.g., Minchev et al. 2012; Kubryk et al. 2013; Kawata et al. 2014; Grand et al. 2015). Recently, Grand et al. (2016) used a high-resolution cosmological zoom simulation of a Milky Way-sized halo to demonstrate that radial flows associated with spiral arms can produce an overdensity of metal-rich stars on the trailing side of the spiral and an overdensity of metal-poor stars on the leading side. This shows that in all these works, azimuthal metallicity variations are the result of the transformation of a preexisting radial negative metallicity gradient under the effect of radial migration.
Disk galaxies contain several populations of stars including bulge, thick and thin disks as well as stellar halo. Their chemical and kinematic characteristics provide information about their formation epochs and the secular and dynamical processes that shaped them over time (Freeman & Bland-Hawthorn 2002). Stellar disk populations of different ages have a wide range of chemical and kinematical characteristics (van der Kruit & Freeman 2011). In particular, in the disk of our Galaxy, the velocity dispersion of stars depends on their age and metallicity. Although the exact shape of theage-metallicity-velocity dispersion relation is still debated, it is evident that younger stars tend to have a higher metallicity and smaller random motions than older stars, which are on average more metal-poor and have higher random motions (see, e.g., Meusinger et al. 1991; Holmberg et al. 2007). Hence metal-rich and metal-poor stars in a disk like that of our Galaxy can be described askinematically cold and kinematically hot components, respectively, and – their contribution to spiral arms is expected to be different because of their different kinematics.
We study the differential response of stars in a composite disk galaxy consisting of kinematically cold and hot populations to spiral perturbations and the induced azimuthal variations in the mean metallicity of the disk. We present a model in which stellar populations with different initial kinematics but the same radial density distribution, differentiate as a spiral structure appears in the galactic disk. We wish to make some testable predictions that can be checked particularly in the Milky Way disk with ongoing and future spectroscopic surveys (e.g., APOGEE, Gaia, and WEAVE).
2 Model
We performed a single N-body simulation of the evolution of a composite stellar disk, embedded in a live dark matter halo. The disk in this simulation consists of three cospatial populations (cold, warm, and hot disks) with different velocity dispersions, but the same radial density distribution. Each disk component was represented by 2 × 10⁶ particles redistributed following a Miyamoto–Nagai density profile, with a characteristic scale length of 3 kpc and a mass of 2.86 × 10¹⁰ M⊙. The cold, warm and hot populations have characteristic scale-heights equal to 0.15, 0.3, and 0.6 kpc, respectively. Our simulation also includes a live dark matter halo (4 × 10⁶ particles) whose density distribution follows a Plummer sphere, with a total mass of 4 × 10¹¹ M⊙ and a radius of 21 kpc. This approach is similar to recent studies by Debattista et al. (2017) and Fragkoudi et al. (2017). The initial kinematics (circular velocity and dispersion profiles) of these components is presented in Figure 1. Initial conditions have been generated using the iterative method described in Rodionov et al. (2009). We used the parallel tree code developed by Khoperskov et al. (in prep.) with the adoption of the standard opening angle θ = 0.7 and a gravitational softening parameter equal to 50 pc. For the time integration, we used a leapfrog integrator with a fixed step size of 0.2 Myr.
Our simulation is dissipationless, and as a consequence we do not model star formation and chemical enrichment. However, we can trace the metallicity distribution and its temporal evolution, by flagging each particle in the disk with a corresponding metallicity. Depending on the way we assign metallicities to our disk particles, we can generate different models and quantify the strength of the azimuthal variations and how they are related to the initial metal distribution in the disk. In particular we analyze three different models here (see Fig. 2). In Model 1 we assume that each disk population is characterized by a unique value of metallicity ([Fe∕H]), independent of the distance R from the galaxy center, and equal, respectively, to − 0.6 dex, −0.3 dex, and 0 dex for the hot, warm, and cold disk, respectively. No dependency on z, the height above the plane, is modeled, for any of the three disk components. The choice of these values is in agreement with the mean characteristics of the stellar populations of the Milky Way disk (see, e.g., Bovy et al. 2012). We note, however, that the exact value of the metallicities of each population is not critical; their relative variations in metallicity is more important. However, because the simulations contain populations with different initial thickness, and these populations have different mean metallicities, a vertical gradient naturally arises in the initial disk when all populations are considered together. In Model 2 we assume that each population has an initial radial metallicity gradient equal to −0.04 dex kpc−1 but different central (i.e., at R = 0) metallicities. This model thus initially results in both a radial and a negative metallicity gradient when the disk populations are analyzed all together. Finally, in Model 3, the three populations all have the same radial gradient (−0.04 dex kpc−1) and the same central metallicity, that is, identical trends of the metallicity with R. No vertical metallicity gradient is assigned for any of the three populations. As a consequence of these assumptions, Model 3 initially represents a disk with a radial metallicity gradient, but no vertical metallicity gradient. We emphasize here that since we analyze the variations of the mean metallicity, we assume no metallicity scatter in any of the populations. We checked, however, that an initial metallicity dispersion of 0.15 dex does not lead to any differences in the results.
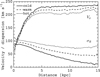 |
Fig. 1 Initial profiles of the rotational velocity V ϕ and the radial velocity dispersion σR for the hot (solid lines), warm (dashed lines) and cold (dotted lines) disk populations. |
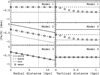 |
Fig. 2 Initial metallicity profiles adopted for the different models: radial profiles in the equatorial plane (left panels) and vertical profiles at R = 7.5 kpc (right panels). |
3 Results
We focus our analysis on two snapshots of the evolution at 0.3, and 0.6 Gyr, when a well-formed two-arm spiral structure is present in all three disk components. At later times, the spiral structure decays, and we show a single snapshot at 1.3 Gyr in order to underline that the signatures we found are related to the presenceof spiral arms. We show the relative perturbation of the stellar surface density where quasi-harmonic variations can be seen;the cooler components show the sharper density profiles (see Fig. A.1). The reason is that in a comoving rest frame, stars of warmer components have a higher kinetic energy within the potential well of the spiral arms. A warmer component is therefore less sensitive to spiral perturbations than a cooler one, with stars from the latter spending a longer time in the spiral arm regions. Consequently the fraction of dynamically cold stars inside the spiral arms is higher than that of warmer stellar components. In the inter-arm regions, we find the opposite, and the warm and dynamically hot components contribute to these regions for the majority. Thus, stellar disk populations with initially different random motions are spatially differentiated in the presence of a spiral perturbation, similarly to what has been found for cospatial populations in the Milky Way bar (Debattista et al. 2017; Fragkoudi et al. 2017).
We now consider possible variations in the metallicity distribution induced by this kinematic differentiation of stellar populations in the presence of spiral patterns. In Figure 3 we show 2D maps of the differential surface density, δΣ = (Σ(R, ϕ) −⟨Σ(R, ϕ)⟩ϕ)∕⟨Σ(R, ϕ)⟩ϕ, and of the azimuthal metallicity variations, δ[Fe∕H] = [Fe∕H](R, ϕ) −⟨[Fe∕H](R, ϕ)⟩ϕ, for the three models. In the definition of these two quantities, the brackets ⟨⟩ϕ indicate the mean (i.e. azimuthally averaged) value of the quantity at a given radius. As soon as the spirals start to develop, the spatial distribution of metals becomes asymmetric. We note that the metallicity patterns do not precisely trace the density variations. In our Model 1 (without an initial radial metallicity gradient for any of the disk components, but with an initial global vertical gradient) we find a very prominent spiral-like periodical variations in metallicity with a substantial contamination of metal-rich stars (cooler components) in spirals and of metal-poor stars (hotter components) in the inter-arm regions. These azimuthal variations in metallicity remain strong as long as the spirals arms are present in the disk (t < 1 Gyr). We emphasize here that since in this model stars belonging to the same disk population all have the same metallicity, the azimuthal variations in the metal distribution found are only a manifestation of the different responses of these disk populations to the bar and spiral perturbation alone. Results less contrasting but similar are obtained for Model 2, where the only difference with respect to Model 1 is that in each disk component, stellar metallicity depends on their distance R from the galaxy center. For Model 3, where identical radial metallicity profiles are imposed for all three populations, and where as a consequence at all radii, stars in the cold, warm, and hot populations all have the same metallicity, the azimuthal variations in the metal distribution are only a manifestation of the radial migration (by churning and blurring) of stars in the disk induced by the bar and spiral arms (Roškar et al. 2008). Stars initially in the inner disk that by construction have the highest metallicities, can migrate outward through the spiral arms, and conversely, stars from the outer disk can migrate inward, which gives rise to the metallicity patterns that have been observed. We note that Models 2 and 3 show a flattening with time of the radial gradient, which is a well-known result of radial migration of stars through resonance scattering (see, e.g., Sánchez-Blázquez et al. 2009; Pilkington et al. 2012).
To analyze the metallicity variations more quantitatively, we show in Figure 4 the azimuthal profiles of the metallicity variations, δ[Fe∕H]. The patterns show that azimuthal variations in the metallicity in all models appear as soon as stellar asymmetries start to develop. At early times, the amplitude of the metallicity variations is similar in all our models, but in the inner disk region, it is more pronounced in Model 1 without the radial gradient. Since we observe the formation of a bar in the innermost part (R < 5 kpc), the impact of the spiral structure can be better appreciated at R = 7.5 kpc, where the amplitude of the metallicity variations is ≈0.1, 0.08, and 0.05 dex for Models 1, 2, and 3 respectively. At later stages of the evolution, when the spiral patterns decay (t > 1 Gyr), the metallicity distribution for all models becomes more complex and shallow. In this case, systematic azimuthal metallicity variations can be found only in the inner bar-region (R < 5 kpc). Some small-scale structures appear at the outskirts, where inhomogeneities are related to the radial migration of stars (Minchev et al. 2012; Di Matteo et al. 2013).
In our Model 1, the metal-rich peaks coexist with the maxima of the density perturbations (Fig. 4), where the contamination of the kinematically cool (metal-rich) population is highest. For Model 3 metal-rich peaks lie mostly on the trailing side of the spiral, as was suggested by Grand et al. (2016). In this regard, we find a possible qualitative difference between purely kinematically driven metallicity patterns (Model 1) and the azimuthal variations shaped by radial migration (Model 3). In reality, both effects (kinematic differentiation and radial migration) probably need to be taken into accountin the interpretation of the metallicity patterns that are found in external galaxies and in the Milky Way disk.
We can also compare the effect of initial radial and vertical gradients onthe amplitude of the azimuthal variations in the metal distribution. To do this, we varied the initial metallicity values for the different components in Model 1 (thus effectively changing the initial vertical metallicity gradient in the model) and the strength of the radial gradient value in Model 3. In Figure 5 we plot the amplitude of azimuthal metallicity variation as a function of the initial vertical and radial gradients. We show that the vertical gradient needs to be by a factor of a few larger than in the radial direction to produce the same azimuthal metallicity variation. Inother words, the azimuthal variations are more sensitive to the radial gradient. Figure 5 also shows a qualitative agreement with Grand et al. (2016), who reported a more pronounced azimuthal gradient when the radial (or vertical) gradient was steeper.
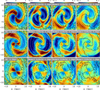 |
Fig. 3 Maps of the differential surface density δΣ (first column) and of the azimuthal metallicity variations δ[Fe∕H] for Model 1, Model 2, and Model 3 (from the second to the fourth column). The different rows show the δΣ and δ[Fe∕H] maps at different times, corresponding to t = 0.3 Gyr (top), t = 0.5 Gyr (middle), and t = 1.3 Gyr (bottom). In all panels, the solid black contour represents δΣ = 0, and dashed circles show the radii R = 5, R = 7.5, and R = 10 kpc. |
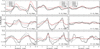 |
Fig. 4 Azimuthal profiles of the metallicity variations (δ[Fe∕H]) at different radii (R = 5 (top panels), R = 7.5 (middle panels), and R = 10 kpc (bottom panels))for the different models. The profilesare shown at three times: t = 0.3 Gyr (left columns), t = 0.5 Gyr (middle column), and t = 1.3 Gyr (right column). The red lines represent the differential surface density (δΣ ) as a function of azimuth at the same radius. To facilitate comparison with the metallicity variations, the values of δΣ have been rescaled; see legend. |
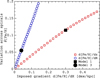 |
Fig. 5 Amplitude of the azimuthal metallicity variations vs. the initial vertical (red squares) and radial (blue circles) metallicity gradients for a single snapshot at 0.3 Gyr at R = 7.5 kpc. The values corresponding to Model 1 and 3 are shown, with a filled square and a filled dot, respectively. |
4 Conclusions
By means of a high-resolution N-body simulation, we have studied the large-scale variations in stellar metallicity in the disk of a spiral galaxy consisting of cospatial populations with different initial velocity dispersions. We showed, as expected, that spiral patterns are more sharply defined for dynamically colder populations and are smoother for dynamically hotter ones. Because of this different response, significant azimuthal variations in the metal distribution in a galaxy disk are observed. Thus, preexisting radial metallicity gradients are not a necessary condition for azimuthal metallicity variations, which can indeed also be produced in disks that initially have zero radial gradients, but do have vertical gradients. Although the exact shape of the age-metallicity-velocity dispersion relation of stars in disk galaxies is debated, it is evident that younger stars have a lower metallicity and smaller random velocity component than older stars. We therefore expect that the mechanism described in this paper is also able to produce azimuthal age variations in the disk. The existence and strength of azimuthal variations in the Milky Way and the influence of the bar and spiral arms on the distribution of metals are still open questions, but we will soon be able to investigate them with data from Gaia and follow-up spectroscopic surveys. It will then be interesting to verify whether these variations can be explained by the effect described here.
Acknowledgements
We thank the anonymous referee for their comments and Ivan Minchev for stimulating discussions. This work was granted access to the HPC resources of CINES under the allocation 2017-040507 (PI : P. Di Matteo) made by GENCI. This work has been supported by the ANR (Agence Nationale de la Recherche) through the MOD4Gaia project (ANR-15-CE31-0007, P.I.: P. Di Matteo). SAK also acknowledges the Russian Foundation for Basic Research (16-32-60043).
Appendix A Additional figure
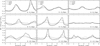 |
Fig. A.1 Azimuthal variations of the density perturbation for the cold (solid), warm (dashed), and hot (dotted) disk components at different radii: R =5 (top panels), R = 7.5 (middle panels), and R = 10 kpc (bottom panels) and at different times: t = 0.3 Gyr (left column), t = 0.5 Gyr (middle column) and t = 1.3 Gyr (right column). |
References
- Antoja, T., Kordopatis, G., Helmi, A., et al. 2017, A&A, 601, A59 [NASA ADS] [CrossRef] [EDP Sciences] [Google Scholar]
- Baba, J., Saitoh, T. R., & Wada, K. 2013, ApJ, 763, 46 [NASA ADS] [CrossRef] [Google Scholar]
- Bertin, G., & Lin, C. C. 1996, Spiral Structure in Galaxies a Density Wave Theory (Cambridge: MIT Press) [Google Scholar]
- Bertin, G., Lau, Y. Y., Lin, C. C., Mark, J. W.-K., & Sugiyama, L. 1977, Proc. Natl. Acad. Sci., 74, 4726 [NASA ADS] [CrossRef] [Google Scholar]
- Bigiel, F., Leroy, A., Walter, F., et al. 2008, AJ, 136, 2846 [NASA ADS] [CrossRef] [Google Scholar]
- Bonnell, I. A., Dobbs, C. L., Robitaille, T. P., & Pringle, J. E. 2006, MNRAS, 365, 37 [NASA ADS] [CrossRef] [Google Scholar]
- Bovy, J., Rix, H.-W., Liu, C., et al. 2012, ApJ, 753, 148 [NASA ADS] [CrossRef] [Google Scholar]
- Bovy, J., Nidever, D. L., Rix, H.-W., et al. 2014, ApJ, 790, 127 [NASA ADS] [CrossRef] [Google Scholar]
- Davies, B., Origlia, L., Kudritzki, R.-P., et al. 2009, ApJ, 696, 2014 [NASA ADS] [CrossRef] [Google Scholar]
- Debattista, V. P., Ness, M., Gonzalez, O. A., et al. 2017, MNRAS, 469, 1587 [NASA ADS] [CrossRef] [Google Scholar]
- Di Matteo, P., Haywood, M., Combes, F., Semelin, B., & Snaith, O. N. 2013, A&A, 553, A102 [NASA ADS] [CrossRef] [EDP Sciences] [Google Scholar]
- D’Onghia, E., Vogelsberger, M., & Hernquist, L. 2013, ApJ, 766, 34 [NASA ADS] [CrossRef] [Google Scholar]
- Eskridge, P. B., Frogel, J. A., Pogge, R. W., et al. 2002, ApJS, 143, 73 [NASA ADS] [CrossRef] [Google Scholar]
- Fragkoudi, F., Di Matteo, P., Haywood, M., et al. 2017, A&A, 607, L4 [NASA ADS] [CrossRef] [EDP Sciences] [Google Scholar]
- Freeman, K., & Bland-Hawthorn, J. 2002, ARA&A, 40, 487 [NASA ADS] [CrossRef] [Google Scholar]
- Fujii, M. S., Baba, J., Saitoh, T. R., et al. 2011, ApJ, 730, 109 [NASA ADS] [CrossRef] [Google Scholar]
- Ghosh, S., & Jog, C. J. 2015, MNRAS, 451, 1350 [NASA ADS] [CrossRef] [Google Scholar]
- Grand, R. J. J., Bovy, J., Kawata, D., et al. 2015, MNRAS, 453, 1867 [NASA ADS] [CrossRef] [Google Scholar]
- Grand, R. J. J., Springel, V., Kawata, D., et al. 2016, MNRAS, 460, L94 [NASA ADS] [CrossRef] [Google Scholar]
- Ho, I.-T., Seibert, M., Meidt, S. E., et al. 2017, ApJ, 846, 39 [NASA ADS] [CrossRef] [Google Scholar]
- Holmberg, J., Nordström, B., & Andersen, J. 2007, A&A, 475, 519 [NASA ADS] [CrossRef] [EDP Sciences] [MathSciNet] [Google Scholar]
- Kawata, D., Hunt, J. A. S., Grand, R. J. J., Pasetto, S., & Cropper, M. 2014, MNRAS, 443, 2757 [NASA ADS] [CrossRef] [Google Scholar]
- Khoperskov, S. A., Khoperskov, A. V., Khrykin, I. S., et al. 2012, MNRAS, 427, 1983 [NASA ADS] [CrossRef] [Google Scholar]
- Kubryk, M., Prantzos, N., & Athanassoula, E. 2013, MNRAS, 436, 1479 [NASA ADS] [CrossRef] [Google Scholar]
- Lau, Y. Y., & Bertin, G. 1978, ApJ, 226, 508 [NASA ADS] [CrossRef] [Google Scholar]
- Li, Y., Bresolin, F., & Kennicutt, Jr., R. C. 2013, ApJ, 766, 17 [NASA ADS] [CrossRef] [Google Scholar]
- Lin, C. C., & Shu, F. H. 1964, ApJ, 140, 646 [NASA ADS] [CrossRef] [MathSciNet] [Google Scholar]
- Meusinger, H., Stecklum, B., & Reimann, H.-G. 1991, A&A, 245, 57 [NASA ADS] [Google Scholar]
- Minchev, I., Famaey, B., Quillen, A. C., et al. 2012, A&A, 548, A126 [NASA ADS] [CrossRef] [EDP Sciences] [Google Scholar]
- Orlova, N., Korchagin, V., & Theis, C. 2002, A&A, 384, 872 [NASA ADS] [CrossRef] [EDP Sciences] [Google Scholar]
- Pilkington, K., Few, C. G., Gibson, B. K., et al. 2012, A&A, 540, A56 [NASA ADS] [CrossRef] [EDP Sciences] [Google Scholar]
- Rix, H.-W., & Zaritsky, D. 1995, ApJ, 447, 82 [NASA ADS] [CrossRef] [Google Scholar]
- Rodionov, S. A., Athanassoula, E., & Sotnikova, N. Y. 2009, MNRAS, 392, 904 [NASA ADS] [CrossRef] [Google Scholar]
- Roškar, R., Debattista, V. P., Quinn, T. R., Stinson, G. S., & Wadsley, J. 2008, ApJ, 684, L79 [NASA ADS] [CrossRef] [Google Scholar]
- Sánchez-Blázquez, P., Courty, S., Gibson, B. K., & Brook, C. B. 2009, MNRAS, 398, 591 [NASA ADS] [CrossRef] [Google Scholar]
- Sánchez-Menguiano, L., Sánchez, S. F., Pérez, I., et al. 2018, A&A, 609, A119 [NASA ADS] [CrossRef] [EDP Sciences] [Google Scholar]
- Sellwood, J. A. 2011, MNRAS, 410, 1637 [NASA ADS] [Google Scholar]
- Sellwood, J. A., & Binney, J. J. 2002, MNRAS, 336, 785 [NASA ADS] [CrossRef] [Google Scholar]
- Shu, F. H. 2016, ARA&A, 54, 667 [NASA ADS] [CrossRef] [Google Scholar]
- van der Kruit, P. C., & Freeman, K. C. 2011, ARA&A, 49, 301 [NASA ADS] [CrossRef] [Google Scholar]
- Vogt, F. P. A., Pérez, E., Dopita, M. A., Verdes-Montenegro, L., & Borthakur, S. 2017, A&A, 601, A61 [NASA ADS] [CrossRef] [EDP Sciences] [Google Scholar]
All Figures
|
Fig. 1 Initial profiles of the rotational velocity V ϕ and the radial velocity dispersion σR for the hot (solid lines), warm (dashed lines) and cold (dotted lines) disk populations. |
| In the text | |
|
Fig. 2 Initial metallicity profiles adopted for the different models: radial profiles in the equatorial plane (left panels) and vertical profiles at R = 7.5 kpc (right panels). |
| In the text | |
|
Fig. 3 Maps of the differential surface density δΣ (first column) and of the azimuthal metallicity variations δ[Fe∕H] for Model 1, Model 2, and Model 3 (from the second to the fourth column). The different rows show the δΣ and δ[Fe∕H] maps at different times, corresponding to t = 0.3 Gyr (top), t = 0.5 Gyr (middle), and t = 1.3 Gyr (bottom). In all panels, the solid black contour represents δΣ = 0, and dashed circles show the radii R = 5, R = 7.5, and R = 10 kpc. |
| In the text | |
|
Fig. 4 Azimuthal profiles of the metallicity variations (δ[Fe∕H]) at different radii (R = 5 (top panels), R = 7.5 (middle panels), and R = 10 kpc (bottom panels))for the different models. The profilesare shown at three times: t = 0.3 Gyr (left columns), t = 0.5 Gyr (middle column), and t = 1.3 Gyr (right column). The red lines represent the differential surface density (δΣ ) as a function of azimuth at the same radius. To facilitate comparison with the metallicity variations, the values of δΣ have been rescaled; see legend. |
| In the text | |
|
Fig. 5 Amplitude of the azimuthal metallicity variations vs. the initial vertical (red squares) and radial (blue circles) metallicity gradients for a single snapshot at 0.3 Gyr at R = 7.5 kpc. The values corresponding to Model 1 and 3 are shown, with a filled square and a filled dot, respectively. |
| In the text | |
|
Fig. A.1 Azimuthal variations of the density perturbation for the cold (solid), warm (dashed), and hot (dotted) disk components at different radii: R =5 (top panels), R = 7.5 (middle panels), and R = 10 kpc (bottom panels) and at different times: t = 0.3 Gyr (left column), t = 0.5 Gyr (middle column) and t = 1.3 Gyr (right column). |
| In the text | |
Current usage metrics show cumulative count of Article Views (full-text article views including HTML views, PDF and ePub downloads, according to the available data) and Abstracts Views on Vision4Press platform.
Data correspond to usage on the plateform after 2015. The current usage metrics is available 48-96 hours after online publication and is updated daily on week days.
Initial download of the metrics may take a while.