Fig. 4
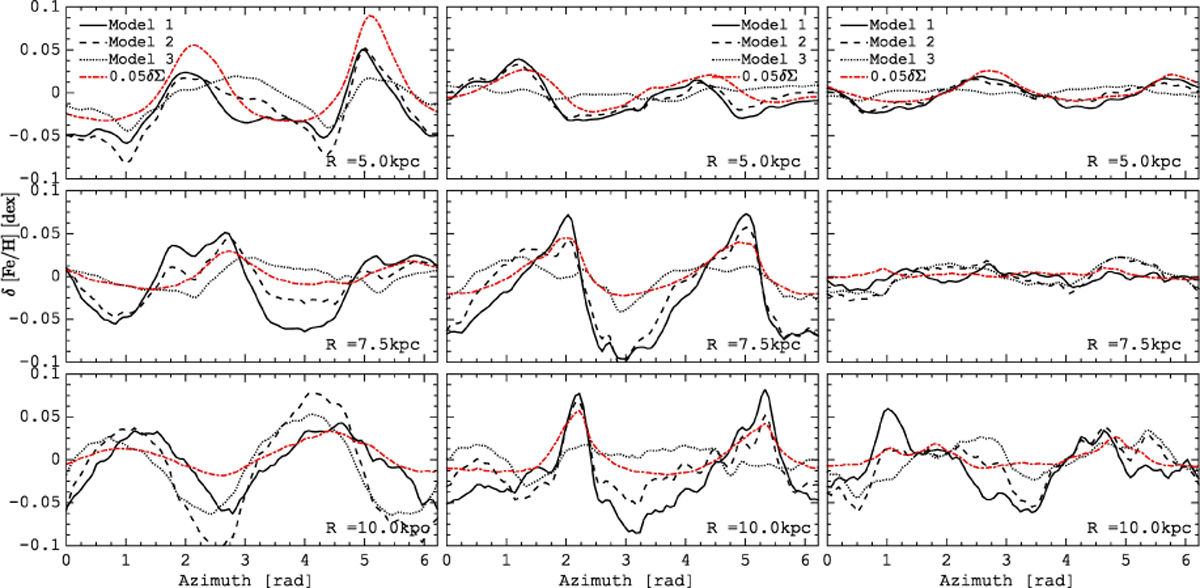
Azimuthal profiles of the metallicity variations (δ[Fe∕H]) at different radii (R = 5 (top panels), R = 7.5 (middle panels), and R = 10 kpc (bottom panels))for the different models. The profilesare shown at three times: t = 0.3 Gyr (left columns), t = 0.5 Gyr (middle column), and t = 1.3 Gyr (right column). The red lines represent the differential surface density (δΣ ) as a function of azimuth at the same radius. To facilitate comparison with the metallicity variations, the values of δΣ have been rescaled; see legend.
Current usage metrics show cumulative count of Article Views (full-text article views including HTML views, PDF and ePub downloads, according to the available data) and Abstracts Views on Vision4Press platform.
Data correspond to usage on the plateform after 2015. The current usage metrics is available 48-96 hours after online publication and is updated daily on week days.
Initial download of the metrics may take a while.