Fig. 3
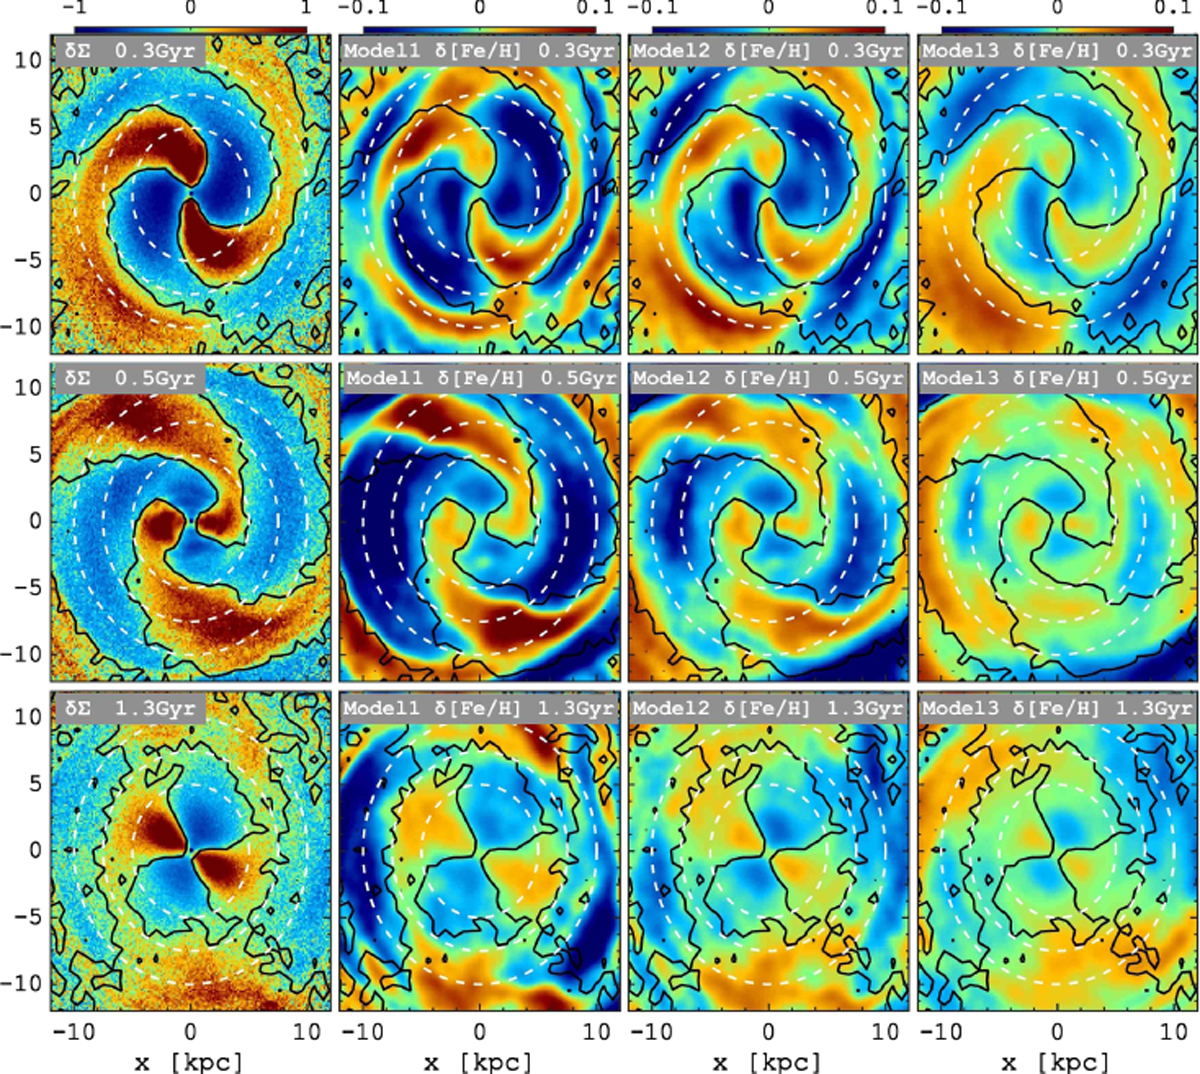
Maps of the differential surface density δΣ (first column) and of the azimuthal metallicity variations δ[Fe∕H] for Model 1, Model 2, and Model 3 (from the second to the fourth column). The different rows show the δΣ and δ[Fe∕H] maps at different times, corresponding to t = 0.3 Gyr (top), t = 0.5 Gyr (middle), and t = 1.3 Gyr (bottom). In all panels, the solid black contour represents δΣ = 0, and dashed circles show the radii R = 5, R = 7.5, and R = 10 kpc.
Current usage metrics show cumulative count of Article Views (full-text article views including HTML views, PDF and ePub downloads, according to the available data) and Abstracts Views on Vision4Press platform.
Data correspond to usage on the plateform after 2015. The current usage metrics is available 48-96 hours after online publication and is updated daily on week days.
Initial download of the metrics may take a while.