| Issue |
A&A
Volume 610, February 2018
|
|
|---|---|---|
| Article Number | A23 | |
| Number of page(s) | 6 | |
| Section | Stellar structure and evolution | |
| DOI | https://doi.org/10.1051/0004-6361/201732130 | |
| Published online | 19 February 2018 | |
Radio emission in ultracool dwarfs: The nearby substellar triple system VHS 1256–1257
1
Departament d’Astronomia i Astrofísica, Universitat de València,
C. Dr. Moliner 50,
46100
Burjassot, València, Spain
e-mail: guirado@uv.es
2
Observatori Astronòmic, Universitat de València, Parc Científic,
C. Catedrático José Beltrán 2,
46980
Paterna, València, Spain
3
Max-Planck-Institut für Radioastronomie,
Auf dem Hügel 69,
53121
Bonn, Germany
4
Instituto de Astrofísica de Canarias,
38200
La Laguna, Tenerife, Spain
5
Departamento de Astrofísica, Universidad de La Laguna,
38206
La Laguna, Tenerife, Spain
6
Departamento de Astronomía, Universidad de Chile,
Camino el Observatorio 1515, Casilla 36-D,
Las Condes, Santiago, Chile
7
Instituto de Astrofísica de Andalucía (IAA, CSIC),
Glorieta de la Astronomía, s/n,
18008
Granada, Spain
8
Departamento de Física Teórica, Facultad de Ciencias, Universidad de Zaragoza,
50009
Zaragoza, Spain
9
Consejo Superior de Investigaciones Científicas,
28006
Madrid, Spain
10
Centro de Astrobiología (CSIC-INTA),
Crta. Ajalvir km 4,
28850
Torrejón de Ardoz, Madrid, Spain
Received:
19
October
2017
Accepted:
1
December
2017
Aim. With the purpose of investigating the radio emission of new ultracool objects, we carried out a targeted search in the recently discovered system VHS J125601.92–125723.9 (hereafter VHS 1256–1257); this system is composed by an equal-mass M7.5 binary and a L7 low-mass substellar object located at only 15.8 pc.
Methods. We observed in phase-reference mode the system VHS 1256–1257 with the Karl G. Jansky Very Large Array at X band and L band and with the European VLBI Network at L band in several epochs during 2015 and 2016.
Results. We discovered radio emission at X band spatially coincident with the equal-mass M7.5 binary with a flux density of 60 μJy. We determined a spectral index α = −1.1 ± 0.3 between 8 and 12 GHz, suggesting that non-thermal, optically thin, synchrotron, or gyrosynchrotron radiation is responsible for the observed radio emission. Interestingly, no signal is seen at L band where we set a 3σ upper limit of 20 μJy. This might be explained by strong variability of the binary or self-absorption at this frequency. By adopting the latter scenario and gyrosynchrotron radiation, we constrain the turnover frequency to be in the interval 5–8.5 GHz, from which we infer the presence of kG-intense magnetic fields in the M7.5 binary. Our data impose a 3σ upper bound to the radio flux density of the L7 object of 9 μJy at 10 GHz.
Key words: brown dwarfs / stars: magnetic field / radiation mechanisms: general / techniques: interferometric
© ESO, 2018
1 Introduction
Radio observations play an important role to understand the processes involved in the formation and evolution of stellar and substellar objects. In particular, radio emission studies of ultracool objects (late M, L, and T objects; e.g., Matthews 2013; Kao et al. 2016, and references therein) are relevant to probe the magnetic activity of these objects and its influence on the formation of disks or planets. Moreover, the study of ultracool dwarfs may open a suitable route to the detection of radio emission of exoplanets. While no exoplanet has been yet detected at radio wavelengths, an increasing number of ultracool objects (McLean et al. 2012) show substantial evidence of radio emission at GHz frequencies in objects with spectral types as cool as T6.5 (Kao et al. 2016). But radio detection of ultracool dwarfs is still a relatively rare phenomenon, and new candidates are needed to improve the statistics of active cool objects. One of these targets is the system VHS J125601.92–125723.9 (hereafter VHS 1256–1257; Gauza et al. 2015); this system is composed by a 0.1′′ equal-magnitude M7.5 binary (components A and B; Stone et al. 2016) and a lower mass L7 companion (component b) separated 8′′ from the primary pair. The system is relatively young, 150–300 Myr, and nearby (12.7–17.1 pc); this locates the low-mass object b near the deuterium burning limit (Stone et al. 2016). Recently, Zapatero Osorio et al. (2017, in prep.) have determined a new trigonometric distance of 15.8 pc for the system using optical and near-infrared images spanning a few years. This distance is compatible with a likely age of 300 Myr, which agrees with the strong lithium depletion observed in the high resolution spectra of the M7.5 binary and the recent age determinations of Stone et al. (2016) and Rich et al. (2016). In this work, we adopt these values of distance and age. Using the bolometric corrections available for M7–M8 and red L dwarfs (Golimowski et al. 2004; Filippazzo et al. 2015) and the new distance, the luminosities are determined at log L∕L⊙ = −4.91 ± 0.10 dex for the faint L7 companion VHS 1256–1257 b and log L∕L⊙ = −3.24 ± 0.10 dex for each member of the M7.5 binary. By applying the luminosity – mass – age relationship of Chabrier et al. (2000), we infer masses in the interval 10–20 MJup (VHS 1256–1257 b) and 50–80 MJup (A and B components) for the age range 150–300 Myr with most likely values of 15–20 MJup and 70–80 MJup at 300 Myr. The interest in VHS 1256–1257 is obvious for several reasons: first, it is only the third multiple system in which all three components may be substellar (Bouy et al. 2005; Radigan et al. 2013) second, the L7 source belongs to one intriguing (not yet understood) population of very red L dwarfs with likely high content of atmospheric dust or highmetallicity (Rich et al. 2016); third, given their large separation (8′′), unambiguous observations of the substellar object b and the central pair AB are accessible by instruments at virtually all wavelengths, including radio; and fourth, the binarity of the host system AB permits the determination of their dynamical masses in a few years, which is essential to fully characterize the system. Additionally, Gauza et al. (2015) reports detection of the Hα line emission (656.3 nm) in the primary, which indicates the existence of chromospheric activity in this M7.5 low-mass binary, therefore showing the ability to sustain significant magnetic fields, and hence, radio emission.
In this paper we present Karl G. Jansky Very Large Array (VLA) and European very-long-baseline interferometry (VLBI) Network (EVN) observations of VHS 1256–1257. We describe our observations and report the principal results, consisting in the discovery of the radio emission of the central components of the VHS 1256–1257 system. We also present a study of the spectral behavior of the detected emission and set an upper bound to the possible radio emission of the very low-mass companion VHS 1256–1257 b.
2 Observations and data reduction
2.1 VLA observations
We observed with DDT/Exploratory Time with the VLA the system VHS 1256–1257 at X band and L band on 2015 May 15 and 2016 July 28, respectively. The observation at X band lasted 2 h and was carried out in BnA configuration, using an effective bandwidth of 4 GHz (8–12 GHz) in dual polarization. The observation at L band lasted 1 h, in B configuration, and using an effective bandwidth of 1 GHz (1–2 GHz) in dual polarization (see Table 1). We used 3C286 as absolute flux calibrator meanwhile we performed amplitude and phase calibration using interleaved observations of the radio source J1254-1317. Data reduction and imaging were carried out using the CASA1 software package of the NRAO. The standard procedure of calibration for continuum VLA data was applied. Special care was taken to flag data contaminated by radio frequency interferences (RFI) at L band. The resulting images are shown in Fig. 1.
VLA and VLBI observations of VHS 1256–1257.
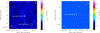 |
Fig. 1 Left: VLA image of the VHS 1256–1257 field at X-band. The detected source is readily assigned to the M7.5 binary VHS 1256–1257 AB. The location of the (undetected) L7-object b is marked with a solid white box. The 3σ threshold detection is 9 μJy. The restoring beam, shown at the bottom left corner, is an elliptical Gaussian of 0.78 × 0.45 arcsec (PA −51°). At 15.8 pc, the separation between components AB and b corresponds to 128.4 AU. Right: VLA image of the VHS 1256–1257 field at L-band. A solid box, with size that of the X-band image, is centered at the position of the X-band detection. None of the VHS 1256–1257 components is detected at this frequency band. The 3σ threshold detection is 20 μJy. The two bright knots seen in the map at the NW correspond to known extragalactic radio sources. The restoring beam, shown at the bottom left corner, is an elliptical Gaussian of 5.66 × 3.38 arcsec (PA −12°). |
2.2 VLBI observations
The VLA observations explained above confirmed the radio emission of VHS 1256–1257. This detection triggered VLBI observations that were carried out with the EVN at L band (1.6 GHz; see Table 1) with the purpose of constraining both the origin and properties of the radio emission. Each observation lasted 6–7 h and both polarizations were recorded with a rate of 1024 Mbps (two polarizations, eight subbands per polarization, 16 MHz per subband, two bits per sample). We used the phase-reference mode and the selected calibrators were J1254–1317 (as primary calibrator, separated 0.5° from VHS 1256–1257), and J1303–1051 (as secondary calibrator, separated 2.7°). The duty cycle was 1 min on the primary calibrator, 3 min on the target, and 1 min on the secondary calibrator with a total integration time at the target of ~3.5 h per epoch.
The data reduction was realized using the program Astronomical Image Processing System (AIPS) of the National Radio Astronomy Observatory (NRAO) with standard routines. Once the final data were obtained, the images were made with the Caltech imaging program DIFMAP (Shepherd et al. 1994). We did not detect either the central M7.5 binary or the very low-mass substellar companion at any epoch, establishing an average flux density upper limit of ~80 μJy (3σ). The interpretation of these non-detections are discussed in next section.
3 Results and discussion
3.1 Radio emission of the central pair VHS 1256–1257 AB
Figure 1 revealed a clear detection on 2015 May 15 (X-band) of an unresolved source with a peak flux density of 60 μJy, which can be assigned to the primary of VHS 1256–1257, the equal-mass M7.5 binary. We confirmed this identification using both the coordinates and proper motion given in Gauza et al. (2015) to find the expected position of component AB at the time of our observation; this expected position differs only 0.18′′, about one-third of the synthesized beam, from the measured position in the VLA X-band map in Fig. 1 (the source has moved ~6.3′′ between Gauza’s epoch and ours). A noise floor of ~3 μJy imposes a strong upper bound to the radio emission at the expected position of the low-mass companion VHS 1256–1257 b. In contrast, we found no detection in any of the components of the system on 2016 July 28 (L band) with a 3σ threshold detection of 20 μJy. The flux density measured at X band implies a radio luminosity of 1.95 × 10⁻¹³ erg s−1 Hz−1 at 15.8 pc. Assuming that the flux is originated at only one of the central components of VHS 1256–1257, this luminosity is similar to other single ultracool dwarfs detected with comparable spectral types (M7.5; McLean et al. 2012). We notice that the figures above are halved if we consider both components to contribute equally to the radio flux. We did not detect significant traces of variability or pulsed emission in the flux density throughout the 2 h duration of our observations, which suggests that the detected radio emission is produced either in quiescent conditions or, alternatively, during a long-duration, energetic flare. However, the latter possibility seems unlikely given the low frequency rate of energetic flares in late M dwarfs (~0.1/day) recently reported by Gizis et al. (2017).
Obtaining an estimate of the brightness temperature is difficult since the resolution of our observations does not provide a precise estimate of the size of the emitting region. Additionally, as said above, the fraction of the radio emission that is originated at each component of the central binary is unknown. Under the assumption that radio emission comes from a single object of size 0.12 R⊙ (derived from the models of Chabrier et al. 2000), we calculate a brightness temperature of 5.4 × 10⁷ K(×1/2 for equal binary contribution) that is consistent with synchrotron or gyrosynchrotron non-thermal radio emission (Dulk 1985). In principle, the low degree of circular polarization (less than 15%) seems to discard coherent mechanisms predicted for ultracool dwarfs (i.e., auroral emissions; Hallinan et al. 2015; Kao et al. 2016), which are normally associated with a high degree of polarization; however, in the case in which both components A and B contribute to the radio emission, we notice that the degree of circular polarization above would be the result of the combination of both radio emitters, not properly reflecting the polarization properties of each one. Further information about the emission mechanism acting on this object can be obtained from the 4 GHz recorded bandwidth of our X-band VLA observations. In practice, we produced four narrower band images of VHS 1256–1257 by deconvolving adjacent 1 GHz bandwidth data sets separately (see Fig. 2), from which we could obtain an indication of the spectral behavior of this system between 8 and 12 GHz. The corresponding spectral index is α = −1.1 ± 0.3 (S ∝ να); this is compatible with optically thin non-thermal synchrotron or gyrosynchrotron emission from a power-law energy distribution of electrons, which indicates, in turn, that strong magnetic fields play an active role in this system.
If the optically thin regime were held down to frequencies as low as 1.4 GHz, we should have detected radio emission in VHS 1256–1257 with a flux density above 300 μJy (actually, this was the motivation for the 1.6 GHz VLBI observations reported in Sect. 2.2); however, no flux above 20 μJy is detected at the nominal position of VHS 1256–1257 at L band. Ultracool dwarfs have shown to be strongly variable source in radio (Bower et al. 2016), therefore arguments of variability could explain this lack of detection. However, the persistent non-detection in our VLBI observations (with a noise floor 10 times smaller than the expected 1.6 GHz flux density according to the spectral index derived) led us to formulate a different hypothesis consisting in considering that the radio emission is actually self-absorbed at the frequency of 1.4 GHz.
We have further explored this hypothesis following the analytic expressions developed by White et al. (1989; W89) for gyrosynchrotron radio emission of dMe stars in quiescent conditions, which provide estimates of the spectral index for the optically thick and thin components, and, therefore, the turnover frequency. We notice that synchrotron radio emission is not ruled out by our data, but gyrosynchrotron from midly relativistic electrons seems to be the preferred mechanism for previously studied M-dwarfs (i.e., Osten & Jayawardhana 2006; Osten et al. 2009), which in turn justifies the use of W89 formulation. These authors assume a dipolar magnetic field, which scales as B(r) ∝ r−n, where n = 3 and r are the distance measured from the dipole and a power-law electron distribution N′ (E), which also scales as 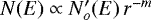 , where the index m varies from 0 (isotropic electron distribution) to m = 3 (= n, the radial dependence of the electron distribution is the same as that of the magnetic field). Taking our measured optically thin spectral index (α = −1.1 ± 0.3), which implies an energy index δ = 2.6, W89 expressions provide two values for the spectral index of theoptically thick component of the radiation, α = 0.6, and α = 1.2, corresponding to the two extreme cases of m = 0, and m = 3, respectively.With the constraints above, we can set lower bounds to the turnover frequency of ~8 GHz (m = 0) and ~5 GHz (m = 3), effectively limiting the turnover frequency to the range 5–8.5 GHz (Fig. 3).
In addition, for gyrosynchrotron emission, the turnover frequency depends strongly on the magnetic field (and very weakly of the rest of the model parameters, m and n in particular; W89) in the form B ~ 150 ν1.3, which provides magnetic field intensities for the previous turnover frequency range of 1.2–2.2 kG. Interestingly, the previous values agree with M-dwarf magnetic field estimates derived from theoretical models (Reiners & Christensen 2010): from the luminosity and mass reported for the components of VHS 1256–1257A and B (Stone et al. 2016; Rich et al. 2016), and using the radius of 0.12 R⊙ the model of Reiners & Christensen (2010) provides values of the dipole field of ~1.7 kG, which is well within the range derived previously. This estimate is near the average value of the magnetic field intensity found in a sample of M7–9.5 dwarfs (Reiners & Basri 2010).
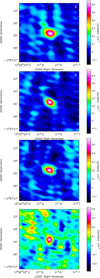 |
Fig. 2 VLA images the VHS 1256–1257 system (unresolved central binary AB) at X band made from 1 GHz subsets of the total data. From top to bottom, the center frequencies are 8.5, 9.5, 10.5, and 11.5 GHz, respectively. The peak flux density decreases from 63 μJy (top) to 45 μJy (bottom image). |
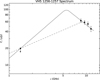 |
Fig. 3 Spectrum of VHS 1256–1257 from VLA observations. The flux densities between 8 and 12 GHz correspond to the maps shown in Fig. 2. The upper bound resulting from the non-detection at L band is denoted with a downward arrow. The solid lines illustrate two possible spectra, each one made from a combination of the behavior predicted by the White et al. (1989) model of gyrosynchrotron emission (optically thick regime, showing the two extreme cases of α = 0.6: dashed line and 1.2: solid line), and a fit to our flux density measurements (optically thin regime, α = −1.1). |
3.2 Spectral energy distribution of VHS 1256–1257 AB
Figure 4 shows the complete spectral energy distribution (SED) of VHS 1256–1257AB covering from VLA through optical observations. The data at visible, near- and mid-infraredwavelengths are taken from Gauza et al. (2015). The observed spectrum is conveniently flux calibrated using the 2MASS JHK magnitudes and the zero points given in Cohen et al. (2003). The W4 photometry reported in Gauza et al. (2015) is affected by a large uncertainty indicative of S∕N ≤ 4. Therefore, we adopt the nominal sensitivity limit of the WISE mission at 22 μm (Wright et al. 2010). The BT-Settl solar metallicity model atmosphere (Baraffe et al. 2015) computed for Teff = 2600 K and log g = 5.0 [cm s−2] is also included in Fig. 4 to illustrate the expected photospheric emission at frequencies not covered by the observations. The synthetical spectrum is normalized to the J-band emission of VHS 1256–1257AB. This temperature and surface gravity are expected for dwarfs near the star–brown dwarf borderline with an age of a few hundred Myr (Chabrier et al. 2000). They also agree with the spectral type – Teff relationship defined for high-gravity, ultracool dwarfs by Filippazzo et al. (2015) and Faherty et al. (2016). The BT-Settl photospheric model extends from ~300 up to ~7.5 × 10⁵ GHz and does not overlap in the frequency axis with the VLA observations. A linear extrapolation of the theoretical SED down to 10 GHz yields a predicted photospheric flux of ~8.3 × 10⁻⁷ mJy. The observed VLA X-band flux is ~65 800 times higher than the expected photospheric emission suggesting that the mechanism responsible for the emission at 10 GHz is extremely powerful.
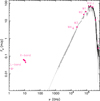 |
Fig. 4 Observed spectral energy distribution of the unresolved binary VHS 1256–1257AB from optical wavelengths through 1 GHz. The optical and near-infrared observed spectra (Gauza et al. 2015) are shown with a solid black line, while the photometric observations are plotted as pink symbols: solid circles stand for actual detections with S∕N ≥ 4 and arrows represent 4σ upper limits. The filter and passband names are labeled. The horizontal error bars represent the width of the filters. Also plotted is the BT-Settl photospheric model (gray line; Baraffe et al. 2015) normalized to the J-band flux of VHS 1256–1257AB. This model corresponds to a cool dwarf with solar metallicity, Teff = 2600 K, and log g = 5.0 [cm s−2 ], which are the parameters expected for an M7.5 source (0.06–0.072 M⊙ ) with an age of a few hundred Myr (Chabrier et al. 2000). |
3.3 Radio emission of the very low-mass companion VHS 1256–1257 b
Our non-detection at X band put a strong upper bound to the flux density of this L7 object of 9 μJy (3σ). Certainly, the ultracool dwarf samples carried out by McLean et al. (2012) and Route & Wolszczan (2013) show that radio detections at GHz frequencies are not frequent for objects later than L3.5, which could be expected by the declining activity of the cooler atmospheres of these objects. Despite this, auroral radio emission (based on electron cyclotron maser emission mechanism) has been detected in a number of late L and T dwarfs (i.e., Hallinan et al. 2015; Kao et al. 2016; Pineda et al. 2017). Could this emission be expected in VHS 1256–1257 b? At a distance of 15.8 pc, the reported luminosities of the coolest dwarfs detected in radio (Pineda et al. 2017) would produce a quiescent emission of ~4 μJy (below our 3σ detection level). In case of auroral, pulsed emission, the radio flux would significantly rise up to peaks of 100 μJy, a factor of ~10 above our detection limit in X band. However, we do not see such a peak in our data indicating that, at the moment of the VLA observations, VHS 1256–1257 b did not show strong levels of auroral activity similar to those seen in other ultracool dwarfs. Kao et al. (2016) found a strong correlation between radio aurorae and the presence of the Hα line; however, only 7–13% of the dwarfs with spectral types between L4 and T8 display Hα emission (Pineda et al. 2016). Given the absence of Hα in VHS 1256–1257 b, the statistics above do not favor the presence of auroral radio emission in this object.
On the other hand, considering the ~kG estimate of the magnetic field for VHS 1256–1257AB, along with the fact that this triple system could have formed from collapse and fragmentation of the same rotating cloud, component b may have also retained high levels of rotation and magnetic field, which eventually may produce sustainable radio emission, although variable, explaining our non-detection. Indeed, both the model of Reiners & Christensen (2010) and the scaling law reported in Christensen et al. (2009) (magnetic field ∝ energy flux, valid for fully convective, rapidly rotating objects) predict magnetic fields >102 G for an object with mass as low as 10–20 MJup, and effective temperature of 800–1000 K (Gauza et al. 2015; Rich et al. 2016).
Additionally, we can estimate the possible radio emission of VHS 1256–1257 b from the Nichols et al. (2012) model. These authors consider the auroral emission as originating from magnetosphere-ionosphere coupling currents resulting from an angular velocity shear in a fast-rotating magnetized object. By assuming the fiducial parameters given in Nichols et al. (2012) (corresponding to a Jovian-like plasma), a magnetic field of ~2 kG, and a rotation period of ~2 h (as extracted from the distribution of brown dwarf rotational periods given in Metchev et al. 2015), we find that VHS 1256–157 b may present auroral emission with a peak flux density of ~100 μJy, coincident with the estimate above resulting from the Pineda et al. (2017) compilation. However, since the currents proposed by Nichols et al. (2012) are created through magnetic field reconnections, the cool atmosphere of VHS 1256–157 b may hamper the existence of auroral emission, as there is evidence that magnetic reconnections are not allowed or are suppressed at temperatures below ~1500 K (Gizis et al. 2017).
4 Conclusions
We have reported the detection of radio emission from the VHS 1256–1257 system. Given the youth of the system (~300 Myr), its proximity, (15.8 pc), architecture (a possible triple substellar system), and presence of a very low-mass substellar object at 8′′ from the primary, this detection appears relevant to study the role of the magnetic field in brown dwarfs. The radio emission is originated at the central system AB, likely consisting in non-thermal synchrotron or gyrosynchrotron emission in the presence of kG-intense magnetic field. Further monitoring of the system at intermediate frequencies to those presented here should confirm our finding that the turnover frequency of the radiation is located between 5 and 8.5 GHz. The use of interferometers with higher resolution (eMERLIN or EVN at 5–8 GHz) should discriminate if the radio emission originates in one of the components (A or B), in both (A+B), or perhaps a sort of interaction between them. These higher resolution studies will open the door to a multiepoch astrometric study directed to the determination of the parallax of the system (modest 5 mas precise positions would result in a 1 pc precise distance) and, additionally, to precise estimates of the masses of the internal pair via monitoring of its orbital motion (4.5 yr period for a face-on orbit). VHS 1256–1257 b is not seen in our maps; however, despite our non-detection at the level of 9 μJy, ~100 G magnetic fields are expected in this 10–20 MJup object. Therefore, the presence of GHz-radio emission VHS 1256–1257 b should be further explored as this would provide useful constraints to the emission mechanism in the coolest substellar objects.
Acknowledgments
We thank Iván Martí-Vidal and Eskil Varenius (Chalmers University of Technology) for helping with the L-band VLA data reduction. The National Radio Astronomy Observatory is a facility of the National Science Foundation operated under cooperative agreement by Associated Universities,Inc. The European VLBI Network is a joint facility of independent European, African, Asian, and North American radio astronomy institutes. Scientific results from data presented in this publication are derived from the EVN project code EG092. J.C.G., R.A., and J.B.C. were partially supported by the Spanish MINECO projects AYA2012-38491-C02-01 and AYA2015-63939-C2-2-P and by the Generalitat Valenciana projects PROMETEO/2009/104 and PROMETEOII/2014/057. B.G. acknowledges support from the CONICYT through FONDECYT Fellowship grant No. 3170513. M.A.P.T. acknowledges support from the Spanish MINECO through grant AYA2015-63939-C2-1-P.
References
- Baraffe, I., Homeier, D., Allard, F., & Chabrier, G., 2015, A&A, 577, A42 [NASA ADS] [CrossRef] [EDP Sciences] [Google Scholar]
- Bouy, H., Martín, E. L., Brandner, W., & Bouvier, J., 2005, AJ, 129, 511 [NASA ADS] [CrossRef] [Google Scholar]
- Bower, G. C., Loinard, L., Dzib, S., et al. 2016, ApJ, 830, 107 [NASA ADS] [CrossRef] [Google Scholar]
- Chabrier, G., Baraffe, I., Allard, F., & Hauschildt, P. 2000, ApJ, 542, 464 [NASA ADS] [CrossRef] [Google Scholar]
- Christensen, U. R., Holzwarth, V., & Reiners, A. 2009, Nature, 457, 167 [NASA ADS] [CrossRef] [PubMed] [Google Scholar]
- Cohen, M., Wheaton, W. A., & Megeath, S. T. 2003, AJ, 126, 1090 [NASA ADS] [CrossRef] [Google Scholar]
- Dulk, G. A. 1985, ARA&A, 23, 169 [NASA ADS] [CrossRef] [Google Scholar]
- Faherty, J. K., Riedel, A. R., Cruz, K. L., et al. 2016, ApJS, 225, 10 [NASA ADS] [CrossRef] [Google Scholar]
- Filippazzo, J. C., Rice, E. L., Faherty, J., et al. 2015, ApJ, 810, 158 [NASA ADS] [CrossRef] [Google Scholar]
- Gauza, B., Béjar, V. J. S., Pérez-Garrido, A., et al. 2015, ApJ, 804, 96 [NASA ADS] [CrossRef] [Google Scholar]
- Gizis, J. E., Paudel, R. R., Mullan, D., et al. 2017, ApJ, 845, 33 [NASA ADS] [CrossRef] [Google Scholar]
- Golimowski, D. A., Leggett, S. K., Marley, M. S., et al. 2004, AJ, 127, 3516 [NASA ADS] [CrossRef] [Google Scholar]
- Hallinan, G., Littlefair, S. P., Cotter, G., et al. 2015, Nature, 523, 568 [NASA ADS] [CrossRef] [Google Scholar]
- Kao, M. M., Hallinan, G., Pineda, J. S., et al. 2016, ApJ, 818, 24 [NASA ADS] [CrossRef] [Google Scholar]
- Matthews, L. D. 2013, PASP, 125, 313 [NASA ADS] [CrossRef] [Google Scholar]
- McLean, M., Berger, E., & Reiners, A. 2012, ApJ, 746, 23 [NASA ADS] [CrossRef] [Google Scholar]
- Metchev, S. A., Heinze, A., Apai, D., et al. 2015, ApJ, 799, 154 [NASA ADS] [CrossRef] [Google Scholar]
- Nichols, J. D., Burleigh, M. R., Casewell, S. L., et al. 2012, ApJ, 760, 59 [NASA ADS] [CrossRef] [Google Scholar]
- Osten, R. A., & Jayawardhana, R. 2006, ApJ, 644, L67 [NASA ADS] [CrossRef] [Google Scholar]
- Osten, R. A., Phan-Bao, N., Hawley, S. L., Reid, I. N., & Ojha, R. 2009, ApJ, 700, 1750 [NASA ADS] [CrossRef] [Google Scholar]
- Pineda, J. S., Hallinan, G., Kirkpatrick, J. D., et al. 2016, ApJ, 826, 73 [NASA ADS] [CrossRef] [Google Scholar]
- Pineda, J. S., Hallinan, G., & Kao, M. M. 2017, ApJ, 846, 75 [NASA ADS] [CrossRef] [Google Scholar]
- Radigan, J., Jayawardhana, R., Lafrenière, D., et al. 2013, ApJ, 778, 36 [NASA ADS] [CrossRef] [Google Scholar]
- Reiners, A., & Basri, G. 2010, ApJ, 710, 924 [NASA ADS] [CrossRef] [Google Scholar]
- Reiners, A., & Christensen, U. R. 2010, A&A, 522, A13 [NASA ADS] [CrossRef] [EDP Sciences] [Google Scholar]
- Rich, E. A., Currie, T., Wisniewski, J. P., et al. 2016, ApJ, 830, 114 [NASA ADS] [Google Scholar]
- Route, M., & Wolszczan, A. 2013, ApJ, 773, 18 [NASA ADS] [CrossRef] [Google Scholar]
- Shepherd, M. C., Pearson, T. J., & Taylor, G. B. 1994, BAAS, 26, 987 [NASA ADS] [Google Scholar]
- Stone, J. M., Skemer, A. J., Kratter, K. M., et al. 2016, ApJ, 818, L12 [NASA ADS] [CrossRef] [Google Scholar]
- White, S. M., Kundu, M. R., & Jackson, P. D. 1989, A&A, 225, 112 [NASA ADS] [Google Scholar]
- Wright, E. L., Eisenhardt, P. R. M., Mainzer, A. K., et al. 2010, AJ, 140, 1868 [NASA ADS] [CrossRef] [Google Scholar]
All Tables
All Figures
|
Fig. 1 Left: VLA image of the VHS 1256–1257 field at X-band. The detected source is readily assigned to the M7.5 binary VHS 1256–1257 AB. The location of the (undetected) L7-object b is marked with a solid white box. The 3σ threshold detection is 9 μJy. The restoring beam, shown at the bottom left corner, is an elliptical Gaussian of 0.78 × 0.45 arcsec (PA −51°). At 15.8 pc, the separation between components AB and b corresponds to 128.4 AU. Right: VLA image of the VHS 1256–1257 field at L-band. A solid box, with size that of the X-band image, is centered at the position of the X-band detection. None of the VHS 1256–1257 components is detected at this frequency band. The 3σ threshold detection is 20 μJy. The two bright knots seen in the map at the NW correspond to known extragalactic radio sources. The restoring beam, shown at the bottom left corner, is an elliptical Gaussian of 5.66 × 3.38 arcsec (PA −12°). |
| In the text | |
|
Fig. 2 VLA images the VHS 1256–1257 system (unresolved central binary AB) at X band made from 1 GHz subsets of the total data. From top to bottom, the center frequencies are 8.5, 9.5, 10.5, and 11.5 GHz, respectively. The peak flux density decreases from 63 μJy (top) to 45 μJy (bottom image). |
| In the text | |
|
Fig. 3 Spectrum of VHS 1256–1257 from VLA observations. The flux densities between 8 and 12 GHz correspond to the maps shown in Fig. 2. The upper bound resulting from the non-detection at L band is denoted with a downward arrow. The solid lines illustrate two possible spectra, each one made from a combination of the behavior predicted by the White et al. (1989) model of gyrosynchrotron emission (optically thick regime, showing the two extreme cases of α = 0.6: dashed line and 1.2: solid line), and a fit to our flux density measurements (optically thin regime, α = −1.1). |
| In the text | |
|
Fig. 4 Observed spectral energy distribution of the unresolved binary VHS 1256–1257AB from optical wavelengths through 1 GHz. The optical and near-infrared observed spectra (Gauza et al. 2015) are shown with a solid black line, while the photometric observations are plotted as pink symbols: solid circles stand for actual detections with S∕N ≥ 4 and arrows represent 4σ upper limits. The filter and passband names are labeled. The horizontal error bars represent the width of the filters. Also plotted is the BT-Settl photospheric model (gray line; Baraffe et al. 2015) normalized to the J-band flux of VHS 1256–1257AB. This model corresponds to a cool dwarf with solar metallicity, Teff = 2600 K, and log g = 5.0 [cm s−2 ], which are the parameters expected for an M7.5 source (0.06–0.072 M⊙ ) with an age of a few hundred Myr (Chabrier et al. 2000). |
| In the text | |
Current usage metrics show cumulative count of Article Views (full-text article views including HTML views, PDF and ePub downloads, according to the available data) and Abstracts Views on Vision4Press platform.
Data correspond to usage on the plateform after 2015. The current usage metrics is available 48-96 hours after online publication and is updated daily on week days.
Initial download of the metrics may take a while.