Fig. 3
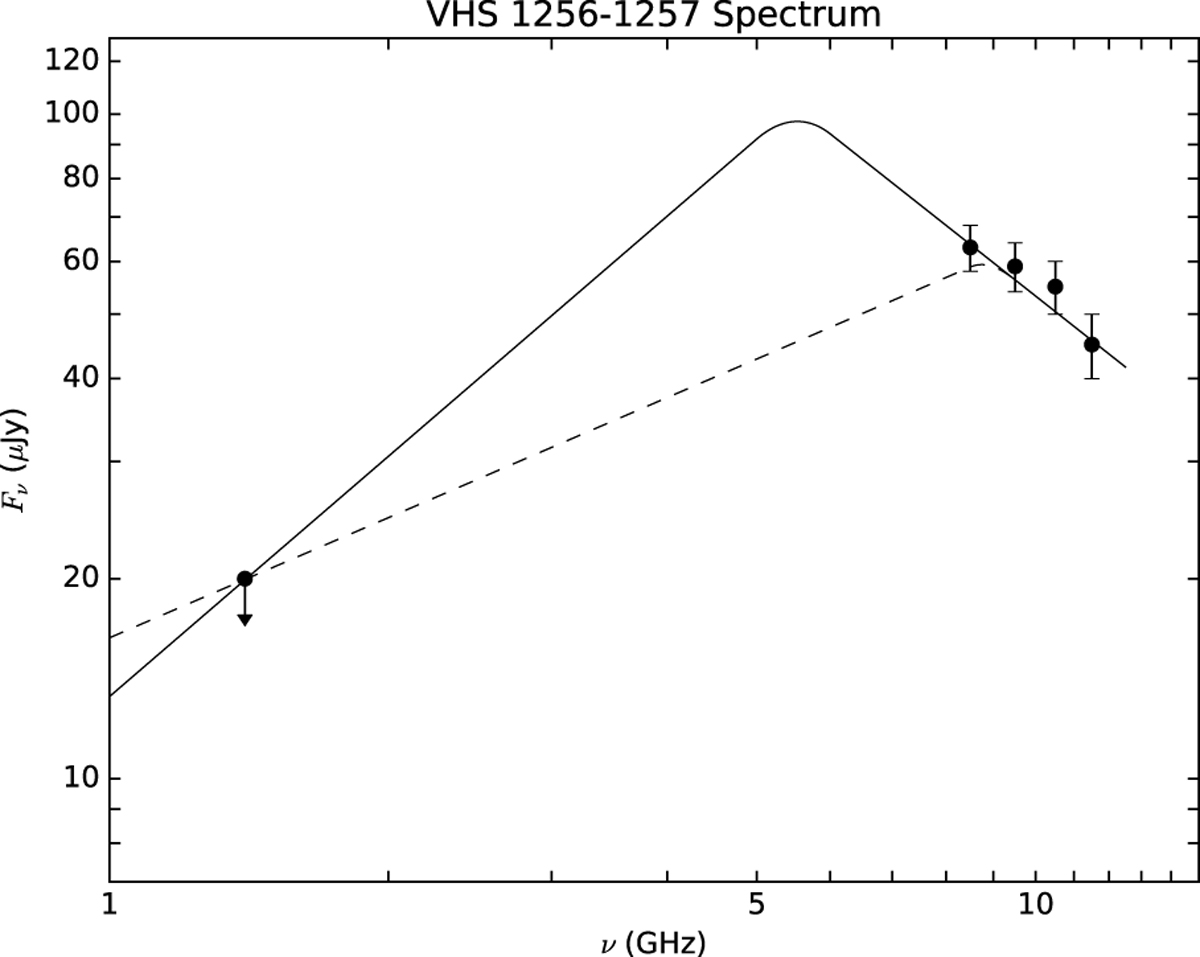
Spectrum of VHS 1256–1257 from VLA observations. The flux densities between 8 and 12 GHz correspond to the maps shown in Fig. 2. The upper bound resulting from the non-detection at L band is denoted with a downward arrow. The solid lines illustrate two possible spectra, each one made from a combination of the behavior predicted by the White et al. (1989) model of gyrosynchrotron emission (optically thick regime, showing the two extreme cases of α = 0.6: dashed line and 1.2: solid line), and a fit to our flux density measurements (optically thin regime, α = −1.1).
Current usage metrics show cumulative count of Article Views (full-text article views including HTML views, PDF and ePub downloads, according to the available data) and Abstracts Views on Vision4Press platform.
Data correspond to usage on the plateform after 2015. The current usage metrics is available 48-96 hours after online publication and is updated daily on week days.
Initial download of the metrics may take a while.