| Issue |
A&A
Volume 609, January 2018
|
|
|---|---|---|
| Article Number | A1 | |
| Number of page(s) | 10 | |
| Section | Extragalactic astronomy | |
| DOI | https://doi.org/10.1051/0004-6361/201731333 | |
| Published online | 22 December 2017 | |
FR0CAT: a FIRST catalog of FR 0 radio galaxies
1 Department of Physics and Astronomy, University of Southampton, Highfield, SO17 1BJ, UK
e-mail: This email address is being protected from spambots. You need JavaScript enabled to view it.
2 INAF–Osservatorio Astrofisico di Torino, via Osservatorio 20, 10025 Pino Torinese, Italy
3 Dipartimento di Fisica, Università degli Studi di Torino, via Pietro Giuria 1, 10125 Torino, Italy
Received: 7 June 2017
Accepted: 22 August 2017
Abstract
With the aim of exploring the properties of the class of FR 0 radio galaxies, we selected a sample of 108 compact radio sources, called FR0CAT, by combining observations from the NVSS, FIRST, and SDSS surveys. We included in the catalog sources with redshift ≤0.05, with a radio size ≲5 kpc, and with an optical spectrum characteristic of low-excitation galaxies. Their radio luminosities at 1.4 GHz are in the range 1038 ≲ νL1.4 ≲ 1040 erg s-1. The FR0CAT hosts are mostly (86%) luminous (−21 ≳ Mr ≳ −23) red early-type galaxies with black hole masses 108 ≲ MBH ≲ 109M⊙. These properties are similar to those seen for the hosts of FR I radio galaxies, but they are on average a factor ~1.6 less massive. The number density of FR0CAT sources is ~5 times higher than that of FR Is, and thus they represent the dominant population of radio sources in the local Universe. Different scenarios are considered to account for the smaller sizes and larger abundance of FR 0s with respect to FR Is. An age-size scenario that considers FR 0s as young radio galaxies that will all eventually evolve into extended radio sources cannot be reconciled with the large space density of FR 0s. However, the radio activity recurrence, with the duration of the active phase covering a wide range of values and with short active periods strongly favored with respect to longer ones, might account for their large density number. Alternatively, the jet properties of FR 0s might be intrinsically different from those of the FR Is, the former class having lower bulk Lorentz factors, possibly due to lower black hole spins. Our study indicates that FR 0s and FR I/IIs can be interpreted as two extremes of a continuous population of radio sources that is characterized by a broad distribution of sizes and luminosities of their extended radio emission, but shares a single class of host galaxies.
Key words: galaxies: active / galaxies: jets
© ESO, 2017
1. Introduction
The widespread presence of compact radio sources at the center of early-type galaxies (ETG) has been recognized in the 1970s (Ekers & Ekers 1973). Later studies (Wrobel & Heeschen 1991; but see also Sadler 1984 and Slee et al. 1994) performed deeper radio surveys and found that ~30% of the nearby ETGs are detected above ~1 mJy level, reaching luminosities as low as ~ 2 × 10¹⁹ W Hz-1 (i.e., ~ 3 × 1035 erg s-1). The vast majority of these sources are unresolved at 3–5″ resolution, indicating that they are confined within a region smaller than some kpc, and they often show short jet-like features and no large-scale jets (Nagar et al. 2005). The origin of the radio emission, whether due to star formation or to an active galactic nucleus (AGN), has not always been identified unambiguously, especially at very low radio fluxes (<mJy level, Bonzini et al. 2013). Furthermore, even for objects with a confirmed AGN origin, it is unclear whether these low-power radio galaxies (RGs) in nearby ETGs are truly the scaled-down versions of more powerful radio AGN (Ho 1999) and how the lack of very extended radio emission in sources with weak jets can be explained (Fabbiano et al. 1989). A detailed analysis of the link between the radio source and its host requires additional observational data, mainly optical imaging and spectroscopy.
Compact radio sources have been little studied by the radio community, which reasonably prefers to explore the radio morphology and properties of brighter RGs, such as the Third Cambridge Catalog of Radio Sources (3C, Edge et al. 1959; Bennett 1962) and its successors. The high-flux limit sets for these samples does not favor the inclusion of weak compact RGs. Fortunately, the advent of large-area multiwavelength surveys opens up the opportunity to set the studies of compact radio sources on strong statistical foundations. In particular, these surveys allow us to identify large numbers of radio sources, to obtain spectroscopic redshifts, and to determine the properties of their hosts. Several studies (e.g., Best et al. 2005; Baldi & Capetti 2010; Best & Heckman 2012; Mingo et al. 2016; Miraghaei & Best 2017) have used the extensive available multi-frequency information to analyze the properties of the population of low-redshift low-power radio AGN. In particular, Best & Heckman (2012) defined diagnostics to isolate galaxies in which the radio emission is produced by an active nucleus.
Baldi & Capetti (2009) studied the radio properties of miniature radio galaxies (named Core galaxies), which are known to have nuclei as the scaled-down version of nuclei of the Fanaroff-Riley type I galaxies (FR Is) of the 3C sample (Balmaverde & Capetti 2006). Nevertheless, the former show a different radio behavior because they are smaller and more core-dominated and consequently have a much lower extended radio emission. Therefore, as a further analysis, we moved our focus to large radio surveys to confirm the presence of a population of radio sources that would show such a radio peculiarity, similarly to the Core galaxies. The result emerging from these studies (Baldi & Capetti 2009, 2010) is that the majority of radio AGN are unresolved (or barely resolved) at the 5″ resolution of the FIRST survey1 and radio weak, as expected based on the local radio luminosity function (e.g., Best et al. 2005; Pracy et al. 2016). This is in contrast with the results from samples selected at higher flux limits where most radio sources are extended and belong to the FR I or FR II classes (Fanaroff & Riley 1974). The general lack of extended radio structures suggests a definition of these compact sources as FR 0 (Ghisellini 2011; Baldi et al. 2015).
Baldi et al. (2015) presented the results of a pilot program of high-resolution ( ) radio imaging of a small sample of compact sources. They found that these can be associated with both radio-quiet and radio-loud AGN; this second group, the genuine FR 0s, are located in red massive (~ 1011M⊙) ETGs with high BH masses (≳108M⊙) and are spectroscopically classified as low-excitation galaxies (LEG). These are all characteristics typical of FR I RGs. They also lie on the correlation between radio core power and [O III] line luminosity defined by FR Is, which is an indication of a common mechanism for the production of radio and ionizing radiation. This also rules out strong effects from Doppler beaming and projection effects. However, they are unresolved at sub-kpc resolution, or show jet-like radio structures on a scale of 1–3 kpc. FR 0s are more core dominated (by a factor of ~30) than FR Is (Baldi et al. 2015). In summary, the only substantial difference between compact FR 0 and extended FR I radio sources is the deficit of extended radio emission.
Since the radio selection of compact radio galaxies carried out by Baldi & Capetti (2010) corresponds to an optical selection, that is, red massive ETGs with an LEG optical spectrum, we adopted these radio and spectrophotometric characteristics to define our FR 0 class of RGs. However, a more heterogeneous population of compact radio sources are present in the local Universe, which includes radio-quiet AGN, compact steep-spectrum sources, and blazars (see Sadler et al. 2014), sources that are not investigated in this work.
The radio sample selected by Best et al. (2005) at 1.4 GHz mostly includes low-power compact RG, which are morphologically consistent with an FR 0 definition. Similarly, at higher radio frequencies, the FR 0s appear to be the dominant population (Sadler et al. 2014; Whittam et al. 2016, 2017).
This work is the third of a series of papers aimed at studying the low-power RGs in the local Universe: the first was about FR Is (Capetti et al. 2017a) and the second about FR IIs (Capetti et al. 2017b). Here, we focus more on the properties of the FR 0s by extricating a sample of compact radio sources from the catalog of radio AGN defined by Best & Heckman (2012). The properties of the FR 0s can then be compared with those of the FR I RG selected from the same original sample reported by Capetti et al. (2017a), requiring an edge-darkened radio morphology and extending at least to a 30 kpc radius (the FRICAT sample) or between 10 and 30 kpc (the sFRICAT sample).
This paper is organized as follows. In Sect. 2 we present the selection criteria of the FR 0 sample. The radio and optical properties of the FR 0 catalog are presented in Sect. 3 and discussed in Sect. 4. After a summary, our conclusions are drawn in Sect. 5.
Throughout the paper we adopt a cosmology with H0 = 67.8 km s-1 Mpc-1, ΩM = 0.308, and ΩΛ = 0.692 (Planck Collaboration XIII 2016).
2. Sample selection
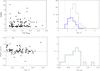 |
Fig. 1 Top left panel: measured major axis (FWHM) in arcsec vs. the FIRST flux density for sources that do not show clearly resolved radio emission; the red dashed line marks the adopted limit of 6.̋7 for the inclusion in the FR0CAT sample. Top right panel: distribution of the NVSS fluxes (left) of the 108 FR0CAT (blue), the 219 FRICAT (black), and the 14 sFRICAT sources (red). The vertical dotted line marks the 5 mJy limits of the BH12 sample. Bottom left panel: ratio between the FIRST and NVSS fluxes vs. the NVSS flux density for the FR0CAT sources; the dashed curve indicates the upper boundary of the region in which objects are located that pass the NVSS flux threshold, but were not selected due to the 5 mJy minimum FIRST flux requirement because of a large contribution of resolved emission. Bottom right panel: radio spectral index between 327 and 1400 MHz; the dashed cyan histogram represents the upper limits. |
We seek for FR 0 RGs in the sample of 18 286 radio sources built by Best & Heckman (2012; hereafter the BH12 sample) by limiting the search to a subsample of objects in which, according to these authors, the radio emission is produced by an active nucleus based on different diagnostics (i.e., SDSS spectra and radio vs. host photometry). They cross-matched the optical spectroscopic catalogs produced by the group from the Max Planck Institute for Astrophysics and The Johns Hopkins University (Brinchmann et al. 2004; Tremonti et al. 2004) based on data from the data release 7 of the Sloan Digital Sky Survey (DR7/SDSS, Abazajian et al. 2009)2, with the National Radio Astronomy Observatory Very Large Array Sky Survey (NVSS; Condon et al. 1998) and FIRST, adopting a radio flux density limit of 5 mJy in the NVSS. The catalog includes mostly RLAGN, with a small fraction (~10%) of a possible radio-quiet AGN contribution (Baldi & Capetti 2010).
We initially selected the sources with 1) redshift z ≤ 0.05 to optimize the spatial resolution; 2) a maximum offset of 2″ of the radio sources from the optical center; and 3) a minimum FIRST flux of 5 mJy. The last constraint is related to the possibility of an accurate size measurement (see below). One hundred ninety-one sources passed this selection criteria.
We visually inspected the FIRST images of these sources and discarded the objects with clearly extended radio emission. We gathered the measured sizes of the remaining sources and preserved those in which the deconvolved size is smaller than 4′′, that is, sources in which the observed major axis is smaller than 6.̋7 (Fig. 1, top left panel). At z = 0.05 this corresponds to ~5 kpc, that is, to a radius of 2.5 kpc.
All selected galaxies are characterized by a spectrum typical of LEG, with only four exceptions that have a high-excitation spectrum. Since the main aim of this project is the comparison between FR 0s and FR Is, which typically have an LEG spectrum, we limit our analysis to the LEG compact radio sources. The resulting sample, to which we refer as FR0CAT, is formed by 108 FR 0s, whose main properties are presented in Table A.1.
The size limit estimated above applies only to a source with a Gaussian shape. This is unlikely to be the case and this question thus requires a more detailed treatment. To estimate a reliable limit to the size of FR 0s, we considered two possibilities: they are 1) compact doubles; or 2) small FR Is. For the first case we measured the FWHM of a simulated source formed by two unresolved components of equal flux; the elliptical Gaussian major axis exceeds the above threshold when their separation exceeds 3.̋2.
The second case is more complex because of the variegated morphologies shown by FR Is. We explored it by simulating the images of small edge-darkened radio sources by using the sample of 14 FR Is (named sFR Is) selected in Capetti et al. (2017a) as a starting point. These sources have a redshift z< 0.05 and at least one jet that extends between 10 and 30 kpc from the host. We simulated the appearance of even smaller FR Is by reducing the angular scale of their radio images by a factor 3; this was obtained with a Gaussian smoothing and a rebinning of the images. We then measured the FWHM of the resulting images. Only 3 of these 14 sources would be considered as compact with the angular size threshold adopted for the FR 0s selection. In the original images the jets of these FR Is extend by between 12 and 15 kpc, that is, 4-5 kpc with the reduced angular scale. The 11 remaining sources, having a median size of ~20 kpc, appear to be resolved.
These simulations suggest that a radio source with either a double or an edge-darkened core-jet(s) morphology, located at z< 0.05, will be cataloged as FR 0 with our criteria only when its size does not exceed ~5 kpc.
Recently, Miraghaei & Best (2017) also selected compact RGs from the BH12 sample. They selected single-component FIRST sources, brighter than 40 mJy, in the redshift range 0.03 >z> 0.1. Their criteria were different from our selection, which leads to a marginal overlap between the two samples, with only seven objects in common.
3. Hosts and radio properties of FR 0s
The NVSS radio flux, Fr, distribution of the FR0CAT (see Fig. 1, top right panel) spans from the sample limit 5 to ~400 mJy and peaks at ~20–30 mJy. The presence of such a peak indicates that the selected sample is incomplete at a flux higher than the original selection threshold. This is due to the additional requirement of a minimum FIRST flux, FFIRST> 5 mJy. Objects close to the 5 mJy NVSS flux limit might not reach the minimum FFIRST value if there is a sufficient amount of extended emission resolved out in these higher resolution images. Nonetheless, the majority of the FR0CAT shows a ratio between the FIRST and NVSS flux densities included in the range 0.5–1.5 (Fig. 1, bottom left panel). This indicates that there is no significant amount of extended low-brightness radio emission associated with FR 0s in general.
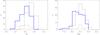 |
Fig. 2 Distributions of the r-band absolute magnitude (left) and black hole masses (right). The FRICAT histograms are all scaled by the relative number of FR I and FR 0, that is, by 108/219. Colors as in Fig. 1. |
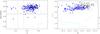 |
Fig. 3 Left panel: concentration index Cr vs. Dn(4000) index; right panel: absolute r-band magnitude, Mr, vs. u−r color of the FR0CAT (blue), FRICAT (black), and sFRICAT (red) sources. The green histogram on the bottom shows the percentage of blue ETGs (scale on the right axis) from Schawinski et al. (2009). The dashed line separates the blue ETGs from the red sequence, following their definition. Colors as in Fig. 1. |
Similarly to the FRICAT sample, the optical selection of the FR0CAT does not introduce a significant incompleteness because most of the hosts have 15.5 <r< 13, which is the r-band magnitude range where the redshift completeness of the SDSS is ~90% (Montero-Dorta & Prada 2009).
The radio spectral index can be measured for the 38 FR0CAT sources that fall into the area covered by the 327 MHz Westerbork Northern Sky Survey (WENSS, Rengelink et al. 1997). The 26 FR0CAT detected by the WENSS show a broad distribution of α327,14 000 (Fig. 1, bottom right panel); 20 of them are flat spectrum sources, α327,14 000< 0.5, and to this category, we can add seven objects undetected at the 18 mJy flux limit of the WENSS. This indicates that the radio emission in FR0CAT sources is generally dominated by a flat spectrum core, similar to the FR 0s studied by Baldi et al. (2015).
The absolute magnitude distribution of the FR 0s hosts covers the range −21 ≲ Mr ≲ −23 (see Fig. 2, left panel). Their black hole (BH) masses (Fig. 2, right panel), estimated from the stellar velocity dispersion taken from the MPA-JHU spectral analysis of the DR7 SDSS data and the relation of Tremaine et al. (2002), are in the range 8.0 ≲ log MBH ≲ 9.0 M⊙, with only ten objects having MBH ≤ 108M⊙. In the two panels we report the analogous distributions for the FRICAT sources; FR Is are associated with slightly brighter sources and more massive BHs. The differences in the medians are ΔMr = 0.59 and Δlog MBH = 0.20, respectively, corresponding to a factor ~1.6 in both cases. The comparison with sFRICAT leads to similar results, with ΔMr = 0.35 and ΔMBH = 0.16, that is, a factor ~1.4. All these differences have a statistical significance of at least 95% according to the Kolmogoroff-Smirnov test.
Similarly to what is seen in the FRICAT, the vast majority of the FR0CAT hosts are red ETGs, based on the values of the concentration Cr (Strateva et al. 2001) and spectroscopic Dn(4000) (Balogh et al. 1999) indices, see Fig. 3, left panel. Their redness is confirmed by the photometric u−r color, measured over the whole galaxy (see Fig. 3, right panel), with only two galaxies located close to the boundary between blue and red ETGs.
A small fraction of FR 0s departs from the general behavior. These are galaxies with MBH ≤ 108M⊙, Cr< 2.6, or Dn(4000)< 1.7. While this is due to spurious effects for some (in two cases the low Cr is due to a nearby star or a companion galaxy), 15 galaxies appear to be intruders, 4 of which are spiral galaxies, for instance. This indicates that compact radio sources, although they are preferentially associated with red and massive ETGs, can rarely be found in different hosts.
The WISE infrared colors further support the general passive nature of the FR0CAT hosts. FR0CAT and FRICAT sources, see Fig. 4, show mid-IR colors typical of those of elliptical galaxies (Wright et al. 2010). In particular, the FR0CAT overlaps with the FR I hosts at similarly low redshift. Nonetheless, a few galaxies of the FR0CAT extend to redder colors than those from the FRICAT. They do not follow the BL Lacs sequence (Massaro et al. 2012), but reach the locus of spiral and star-forming galaxies. Of the five sources with W2−W3 > 2.5, four are those noted above as late-type galaxies, with blue optical colors, and/or they host black holes MBH ≤ 107.8M⊙: they confirm the presence of a minority of compact radio galaxies that do not conform with the general properties of FR 0s.
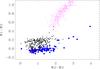 |
Fig. 4 WISE mid-IR colors of the FR0CAT hosts compared to the colors of FRICAT (black) and sFRICAT (red). We also show the region occupied by the Fermi blazars (purple dots). |
Ledlow & Owen (1996) discovered that FR Is and FR IIs populate well-separated regions in a plane, based on the host optical luminosity vs. their radio power. Owing to their low radio luminosities, FR 0s are well below the boundary between the two classical FR classes, precisely, they are lower by a factor 10 to 200 (see Fig. 5).
The line luminosity is a robust proxy of the radiative power of the AGN, and at least within objects with similar multiwavelength properties, of the accretion rate. The comparison of line emission and radio power presented in Fig. 6 (left panel) indicates that FR 0s share the same range of L[O III] of FR Is, but they have a much lower radio luminosity, with a median 30 smaller than that for the FRICAT. Low-luminosity RGs form a continuous distribution, from the FR 0s at the lowest ratios of radio/line luminosity, to the sFRICAT and FRICAT sources at intermediate ratios, and finally to the extreme 3C-FRIs. However, we note that the number of objects in this figure is not proportional to their space density because they are selected in different volumes. A proper comparison can be drawn only between FR 0s and FR Is with z< 0.05, marked with the red dots for those with 10 <r< 30 kpc and with red asterisks when r> 30 kpc. Figure 6 (left panel) also points to a similarity between FR 0s and FR Is in terms of AGN bolometric power and accretion rate. An analogous indication was found by Baldi et al. (2015) when comparing the genuine core emission of FR 0s and FR Is.
The right panel of Fig. 6 shows the relation between the radio luminosity and the BH mass for the FR0CAT, the FRICAT, and the sFRICAT. The inclusion of low-power RGs breaks down the relation between Lr an MBH observed at higher radio luminosities (Lacy et al. 2001). RGs with similar BH masses can produce sources of different radio morphologies/sizes and spanning several orders of magnitude in radio luminosity. Furthermore, a clearly empty region is present in the lower right region of the diagram, indicating that a minimum BH mass is required to launch a relativistic jet for a RLAGN.
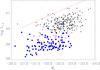 |
Fig. 5 Radio luminosity (NVSS) vs. host absolute magnitude, Mr, for FR0CAT (blue), FRICAT (black), and sFRICAT (red) sources. The solid line shows the separation between FR I and FR II reported by Ledlow & Owen (1996), to which we applied a correction of 0.34 mag to account for the different magnitude definition and the color transformation between the SDSS and Cousin systems. |
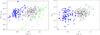 |
Fig. 6 Left panel: radio (NVSS) vs. [O III] line luminosity of the FR0CAT (blue), FRICAT (black), and sFRICAT (red) sources. The FRICAT sources with z< 0.05 are represented as black dots with a red asterisk superposed. The green line shows the correlation between these two quantities derived from the FR Is of the 3C sample from (Buttiglione et al. 2010), individually marked with the green crosses. Right panel: radio luminosity vs. BH mass (M⊙). |
4. Discussion
4.1. Comparison with previous studies
Our study follows several previous investigations of the local population of compact radio sources. In particular, Sadler et al. (2014) explored the properties of nearby galaxies (z ≲ 0.1) at 20 GHz, finding similar to our results, that compact radio sources are the dominant class. However, compared to our sample, they found a more heterogeneous population of hosts, including ~25% of HEGs (while our HEGs fraction is only ~4%), and an indication of a mixture of several types of objects, possibly also including young GHz peaked-spectrum, compact steep-spectrum, and beamed sources. The most likely origin of these differences is the higher flux limit (40 mJy) and observing frequency (20 GHz), which leads to the selection of more luminous objects, with compact sources reaching radio luminosities as high as 1042 erg s-1, which is a factor 100 higher than the most luminous FR 0s in our catalog. As we mentioned above, this luminosity difference also characterizes the study of compact sources performed by Miraghaei & Best (2017).
Conversely, our FR 0s are in general more luminous than the compact radio sources associated with nearby ETGs. For example, in the study from Wrobel & Heeschen (1991) only a handful of objects reaches ~ 1038 erg s-1, which is the luminosity limit of our sample. The multiwavelength study of these “miniature radiogalaxies” (Core galaxies, Balmaverde & Capetti 2006) shows various similarities with FR 0s, including the host properties, the nuclear LEG spectrum, and the high core dominance.
From this perspective, our study fills the gap between the population of brighter radio galaxies and the weak radio sources in nearby ETGs: FR 0s are more similar to their less luminous counterparts.
4.2. Are FR 0s young radio galaxies?
The relative number density between FR 0s and FR Is can be used to explore the relation between these two classes of RGs. If we assume that these two classes of low-luminosity RGs are linked by temporal evolution, they are intrinsically identical sources differing only by their age. This idea is supported by the strong similarity of the host properties of the FR0CAT and FRICAT sources.
In this scenario, RGs are initially compact FR 0s and then they all expand to form well-developed radio jets and appear as FR I radio sources. This means that FR 0s are “young” with respect to the time needed to form FR I RGs, whose sizes often reach 100 kpc, that is,  yr (where v3 is the expansion speed in 103 km s-1 units). By assuming a constant expansion speed, the relative space densities of the various classes are expected to be proportional to the range of sizes covered by each class. In our case, the space densities should scale with the linear size as <5:20:30 (kpc) for the FR 0s, the small FR Is (with 10 <r< 30 kpc), and the larger FR Is (with 30 <r< 60 kpc). The observed numbers are 108:14:73. The space density of FR 0s is then ≳50 times higher than predicted by this simple model.
These results could be explained, still in the evolution framework, if the expansion speed increases with time, being higher for the sources with a larger size. Nevertheless, this sharp acceleration contrasts with the results from numerical simulations of low-luminosity radio jets (Massaglia et al. 2016) that show an approximately constant advance speed out to a few kpc from the center and then a decrease by a factor ~2.
This discrepancy is not significantly reduced by excluding the FR 0s with host properties that do not conform with those of the FR Is discussed in Sect. 3 (i.e., objects having MBH< 108M⊙, Cr< 2.6, or blue colors); when we remove these likely interlopers, the FR 0s density drops by only ~15%.
On the other hand, the sizes of edge-darkened FR I radio sources that we used above to predict the relative space densities are generally underestimated because their extended plumes and tails can be detected only to the sensitivity limit of the radio images. This effect would decrease the genuine number of small FR Is, further increasing the FR 0/FR I number density ratio. An opposite effect is due to projection, since the observed size of extended radio sources is reduced on average by a factor 2 with respect to its actual value, assuming a random orientation.
Capetti et al. (2017a) discussed various sources of incompleteness of the FRICAT sample. The most important limitation in our ability to detect FR Is is related to the presence of diffuse emission, which is resolved out or does not reach the 3σ limit in the FIRST images. The FRICAT flux distribution indicates that indeed its completeness limit is higher than the original 5 mJy threshold and can be set at ~30–50 mJy. When we restrict the comparison between FR 0 and FR I to the sources above 30 mJy, the FR 0/FR I fraction decreases, but by less than a factor ~2. Conversely, we expect that the luminosity of a growing radio source increases with time as a result of the contribution from the extended emission. This causes an underestimate of the intrinsic relative densities of FR 0 and extended radio sources when using flux-limited samples.
Capetti et al. (2017b) showed that the hosts of the majority of edge-brightened radio sources (FR IIs) consist of massive ETGs, similar to those of FR I and FR 0. We then explored the effect of dropping the requirement that FR 0s evolve only into FR Is and considered all extended sources regardless of their radio morphology. In the BH12 catalog there are 203 radio AGN with z< 0.05, MBH> 108M⊙ that are spectroscopically identified as LEGs; 25 of them have 10 <r< 30 kpc, and 14 extend over 30 <r< 60 kpc. This reduces the difference between the observed and predicted number of compact radio sources by only a factor ~2.
To summarize, although the measurement of the relative number density of the various classes of RGs is subject to various uncertainties, a simple “age-size” scenario of the evolution of FR 0s into extended RGs cannot be reconciled with the properties of such a class, meaning that FR 0s cannot just be “young” RGs that will all eventually evolve into extended radio sources.
4.3. Are radio galaxies recurrent?
The activity in RGs might be recurrent (e.g., Reynolds 1997; Czerny et al. 2009) and they might experience various active phases of different length. To account for both the large fraction of compact radio sources and the presence of ~100 kpc scale sources, the duration of the active phase must cover a wide range of values with short active periods favored toward the longer ones. In this scenario, FR 0s are indeed young RGs, but they will generally not grow to form large RGs. The limit to the size of FR 0s corresponds to an age of ≲ yr.
yr.
Another constraint on recurrence comes from the bivariate radio/optical luminosity functions. Mauch & Sadler (2007) estimated that the fraction of galaxies associated with a radio source more luminous than 5 × 1038 erg s-1 at 1.4 GHz (the lower luminosity seen in FR 0s) is ~10% for hosts with MK ≲ −25, a fraction that decreases to ~2% for less luminous galaxies, −24 ≳ MK ≳ −25. When we adopt a typical color R−K = 2.7 (Mannucci et al. 2001), these values encompass the range of optical magnitudes of most FR 0s. These fractions can be interpreted within a recurrence scenario as the ratio of the duration between the active and quiescent states, the latter being between one and two orders of magnitude longer, that is, ≲107−108 yr.
In this context, it is important to explore the origin of the recurrence and what sets its timescale; it can be envisaged that the AGN feedback plays an important role in this respect (see, e.g., Pellegrini et al. 2012). A possible clue comes from the slightly higher luminosity (and BH mass) of FR Is with respect to FR 0s, and the lack of compact sources in galaxies brighter than Mr ~ −23. This suggests that the activity in more massive galaxies might last for longer periods. This agrees with the results obtained by Shin et al. (2012), with cluster central galaxies spending a much longer time in the active states than satellite galaxies.
4.4. Are FR 0s and FR Is intrinsically different?
There might also be genuine differences between FR 0s and FR Is either in their central engines or in their environment, to account for their distinct radio behavior.
The immediate environment of FR 0s and FR Is is probed by their host galaxies, which, as we discussed, are very similar: this argues against the interpretation that the FR 0 hosts have a denser interstellar medium that prevents their jets from propagating through the galaxy. The large-scale environment could have a direct effect on the radio source appearance because an extended confining medium reduces the advance speed of the jet and also the adiabatic expansion of the radio source, hence increases their detectability. However, this is unlikely to be the case because the FR 0s size limit, <5 kpc, locates these sources well within the hot coronae associated with their host. Furthermore, Miraghaei & Best (2017) concluded that FR Is and compact RGs live in a similar environment; given the differences between our FR 0 definition and their compact RGs sample, a detailed study of the FR 0 environment is needed before we can extend this conclusion to our sample.
Based on high-resolution JVLA maps Baldi et al. (2015) suggested that the differences between compact and extended sources might be due to a lower jet bulk speed, Γjet, in FR 0s than in FR Is. For this reason they are more likely to be subject to instabilities and entrainment (Bodo et al. 2013) and they disrupt while they slowly burrow their way into the external medium, which accounts for their small sizes. This is supported by the absence of one-sided kpc scale morphologies, a sign of relativistic jet boosting, in FR 0s. Conversely, more than half of the FR Is show large jet asymmetries with a jet/counter-jet flux ratio higher than 2 (Parma et al. 1987), which implies that their jets are relativistic on a kpc scale.
The possible lower Γjet in FR 0 does not appear to be related to a (currently) directly observable quantity. Baldi et al. speculated that this could be due to a positive connection between Γjet and the BH spin (as suggested by McKinney 2005; Tchekhovskoy et al. 2010; Chai et al. 2012; Maraschi et al. 2012). In this context, when we assume a galaxy evolution via BH merger and gas accretion (e.g., Volonteri et al. 2013), the result of such a process is a population with a broad distribution of properties, that is, BH mass and spin. We suggest that only under the most favorable circumstances, that is, when these parameters are maximized, is the BH associated with an RLAGN able to launch a highly relativistic jet and produce an extended RG, classified as FR I/II. This scenario predicts a large scatter of physical BH aspects, which reproduces the different radio morphologies and shapes a continuous population distribution of RGs from FR 0s to FR I/IIs. FR 0s would originate from less extreme values of the BH parameters and represent the majority of the RLAGN population.
5. Summary and conclusions
We explored the properties of compact radio sources associated with low-redshift (z< 0.05) galaxies. We selected these objects by cross-matching the SDSS, FIRST, and NVSS catalogs with a radio flux >5 mJy, a radio size ≲5 kpc, and an LEG optical spectrum. We named these sources FR 0s, in contrast to the other extended FR classes, and formed the FR0CAT catalog. With these criteria, we selected 108 objects with the following properties: 1) massive red early-type hosts associated with massive BH (≳108M⊙), as typical of RLAGN (Baldi & Capetti 2010; Best & Heckman 2012; Chiaberge & Marconi 2011), and similar to those seen in FRICAT and 3C-FRIs; 2) a tail toward slightly lower MBH values is present in FR 0s; 3) there is a notable lack of blue host galaxies in the FR0CAT, already observed in FRICAT, with respect to the general population of ETGs (Schawinski et al. 2009). The available data do not allow us to identify the origin of this effect, which might be due to a different environment or to AGN feedback, for example.
From our study we are able to estimate the number density of the different classes of RGs among the three FR-CAT samples. In the same volume we identify 108 FR 0s and 21 FR Is (14 with sizes of between 10 and 30 kpc, and 7 between 30 and 60 kpc), and just one FR II, indicating that FR 0s are the dominant population of RGs in the local Universe. This indicates that FR 0s cannot be RGs viewed preferentially at a small angle with respect to their jet axis.
The high fraction of compact RGs rules out the possibility that FR 0s are young RGs that will all evolve into extended radio sources. Two alternatives to account for both the similarities and differences between compact and extended RGs remain: 1) radio activity might be recurrent, with short active periods favored with respect to the longer ones. In this scenario, FR 0s are indeed young RGs, but they will generally not grow to form large RGs; 2) there might be intrinsic differences in their central engines, for example, compact radio sources might be associated with jets of lower bulk speed than the extended ones. Slower jets are more likely to be subject to instabilities and entrainment and they disrupt before they exit to the host interstellar medium, limiting the extension of the resulting radio source. The possible ultimate origin of this low jet bulk speed is a lower BH spin than that in FR I/IIs.
The connection between galaxy and radio properties might depend on the environment because the galaxy richness of the surroundings might lead to different evolutionary paths. In particular the specific history of mergers determines not only the evolution of the hosts but also of the BH parameters, leading to the differentiation between FR 0 and FR I sources. The availability of the FR0CAT and FRICAT samples opens the possibility for a detailed comparison of the environment of these two classes of RGs.
Gathering the results of our studies of the three FR-CAT samples of radio galaxies in the local Universe, we conclude that low-luminosity RGs are a very homogeneous population of sources: all hosted in red massive elliptical galaxies with an LEG spectrum, and confined within a small range of emission line luminosities. Combined with the information available on their nuclear properties (Baldi et al. 2015), this suggests that a common jet-launching mechanism operates in all these objects. However, they show large differences in radio behavior from the point of view of their sizes, luminosities, and morphologies. FR 0s and FR I/IIs represent the two extremes in terms of radio sizes and luminosities. Nonetheless, despite the selection criteria (i.e., the separation between compact and extended radio sources), there is no indication of dichotomous behavior: in particular, the distribution in radio luminosity of FR 0s smoothly connects with that of FR I and FR II.
Clearly, the classification of a given source in the FR classes depends on sensitivity, resolution, and frequency of the available radio data. For example, two of the FR 0s observed at high resolution (~0.̋2) by Baldi et al. (2016) show an FR I morphology. It can be envisaged that future radio surveys at high resolution will resolve most of the compact FR 0s. Nevertheless, we note that FR 0s are not simply the scaled-down versions of FR Is. The two classes differ not only from the point of view of their sizes, but also by their radio core dominance and by the ratio between line and radio luminosity, which are both higher in FR 0s. This points to a genuine physical difference, that is, a reduced ability in the production of extended radio emission.
The increasing interest in low-luminosity AGN with the forthcoming advent of the SKA array (Whittam et al. 2017) makes the study of this population of compact weak radio galaxies deserving of a deeper investigation. Progress in the study of compact RGs can come from further studies at high spatial resolution of FR 0 to explore their jet bulk speed. This can be done in particular by measuring the jet/counter-jet asymmetries in a sizable sample of FR 0s whose distribution is directly linked to the jet speed. This will be addressed in forthcoming papers that explore FR 0s at higher resolutions with the JVLA and eMERLIN radio arrays. We also expect that low-frequency radio observations from the LOFAR array will shed new light on the possible recurrent activity in RGs in general.
Faint Images of the Radio Sky at Twenty centimeters survey (Becker et al. 1995; Helfand et al. 2015).
Available at http://www.mpa-garching.mpg.de/SDSS/
The space density of the more extended FR Is (the only class visible at larger distances) is confirmed by the number of FIRST/FRIs found with z < 0.15, 158 sources within a volume 25 times larger.
Acknowledgments
We thank the anonymous reviewer for his/her comments and suggestions to improve the interpretations of the results. The authors also thank D. Williams for reading the manuscript and providing useful comments. RDB acknowledges the support of STFC under grant [ST/M001326/1]. This research made use of the NASA/ IPAC Infrared Science Archive and Extragalactic Database (NED), which are operated by the Jet Propulsion Laboratory, California Institute of Technology, under contract with the National Aeronautics and Space Administration. Funding for SDSS-III has been provided by the Alfred P. Sloan Foundation, the Participating Institutions, the National Science Foundation, and the U.S. Department of Energy Office of Science. The SDSS-III web site is http://www.sdss3.org/. SDSS-III is managed by the Astrophysical Research Consortium for the Participating Institutions of the SDSS-III Collaboration, including the University of Arizona, the Brazilian Participation Group, Brookhaven National Laboratory, University of Cambridge, Carnegie Mellon University, University of Florida, the French Participation Group, the German Participation Group, Harvard University, the Instituto de Astrofisica de Canarias, the Michigan State/Notre Dame/JINA Participation Group, Johns Hopkins University, Lawrence Berkeley National Laboratory, Max Planck Institute for Astrophysics, Max Planck Institute for Extraterrestrial Physics, New Mexico State University, New York University, Ohio State University, Pennsylvania State University, University of Portsmouth, Princeton University, the Spanish Participation Group, University of Tokyo, University of Utah, Vanderbilt University, University of Virginia, University of Washington, and Yale University.
References
- Abazajian, K. N., Adelman-McCarthy, J. K., Agüeros, M. A., et al. 2009, ApJS, 182, 543 [NASA ADS] [CrossRef] [Google Scholar]
- Baldi, R. D., & Capetti, A. 2009, A&A, 508, 603 [NASA ADS] [CrossRef] [EDP Sciences] [Google Scholar]
- Baldi, R. D., & Capetti, A. 2010, A&A, 519, A48 [NASA ADS] [CrossRef] [EDP Sciences] [Google Scholar]
- Baldi, R. D., Capetti, A., & Giovannini, G. 2015, A&A, 576, A38 [NASA ADS] [CrossRef] [EDP Sciences] [Google Scholar]
- Baldi, R. D., Capetti, A., & Giovannini, G. 2016, Astron. Nachr., 337, 114 [NASA ADS] [CrossRef] [Google Scholar]
- Balmaverde, B., & Capetti, A. 2006, A&A, 447, 97 [NASA ADS] [CrossRef] [EDP Sciences] [Google Scholar]
- Balogh, M. L., Morris, S. L., Yee, H. K. C., Carlberg, R. G., & Ellingson, E. 1999, ApJ, 527, 54 [NASA ADS] [CrossRef] [Google Scholar]
- Becker, R. H., White, R. L., & Helfand, D. J. 1995, ApJ, 450, 559 [NASA ADS] [CrossRef] [Google Scholar]
- Bennett, A. S. 1962, Mem. Roy. Astron. Soc., 68, 163 [Google Scholar]
- Best, P. N., & Heckman, T. M. 2012, MNRAS, 421, 1569 [NASA ADS] [CrossRef] [Google Scholar]
- Best, P. N., Kauffmann, G., Heckman, T. M., et al. 2005, MNRAS, 362, 25 [NASA ADS] [CrossRef] [Google Scholar]
- Bodo, G., Mamatsashvili, G., Rossi, P., & Mignone, A. 2013, MNRAS, 434, 3030 [NASA ADS] [CrossRef] [Google Scholar]
- Bonzini, M., Padovani, P., Mainieri, V., et al. 2013, MNRAS, 436, 3759 [NASA ADS] [CrossRef] [Google Scholar]
- Brinchmann, J., Charlot, S., White, S. D. M., et al. 2004, MNRAS, 351, 1151 [NASA ADS] [CrossRef] [Google Scholar]
- Buttiglione, S., Capetti, A., Celotti, A., et al. 2010, A&A, 509, A6 [NASA ADS] [CrossRef] [EDP Sciences] [Google Scholar]
- Capetti, A., Massaro, F., & Baldi, R. D. 2017a, A&A, 598, A49 [NASA ADS] [CrossRef] [EDP Sciences] [Google Scholar]
- Capetti, A., Massaro, F., & Baldi, R. D. 2017b, A&A, 601, A81 [NASA ADS] [CrossRef] [EDP Sciences] [Google Scholar]
- Chai, B., Cao, X., & Gu, M. 2012, ApJ, 759, 114 [NASA ADS] [CrossRef] [Google Scholar]
- Chiaberge, M., & Marconi, A. 2011, MNRAS, 416, 917 [NASA ADS] [CrossRef] [Google Scholar]
- Condon, J. J., Cotton, W. D., Greisen, E. W., et al. 1998, AJ, 115, 1693 [NASA ADS] [CrossRef] [Google Scholar]
- Czerny, B., Siemiginowska, A., Janiuk, A., Nikiel-Wroczyński, B., & Stawarz, Ł. 2009, ApJ, 698, 840 [NASA ADS] [CrossRef] [Google Scholar]
- Edge, D. O., Shakeshaft, J. R., McAdam, W. B., Baldwin, J. E., & Archer, S. 1959, Mem. Roy. Astron. Soc., 68, 37 [Google Scholar]
- Ekers, R. D., & Ekers, J. A. 1973, A&A, 24, 247 [NASA ADS] [Google Scholar]
- Fabbiano, G., Gioia, I. M., & Trinchieri, G. 1989, ApJ, 347, 127 [NASA ADS] [CrossRef] [Google Scholar]
- Fanaroff, B. L., & Riley, J. M. 1974, MNRAS, 167, 31 [NASA ADS] [CrossRef] [Google Scholar]
- Ghisellini, G. 2011, in AIP Conf. Ser. 1381, eds. F. A. Aharonian, W. Hofmann, & F. M. Rieger, 180 [Google Scholar]
- Helfand, D. J., White, R. L., & Becker, R. H. 2015, ApJ, 801, 26 [NASA ADS] [CrossRef] [Google Scholar]
- Ho, L. C. 1999, ApJ, 516, 672 [NASA ADS] [CrossRef] [Google Scholar]
- Lacy, M., Laurent-Muehleisen, S. A., Ridgway, S. E., Becker, R. H., & White, R. L. 2001, ApJ, 551, L17 [NASA ADS] [CrossRef] [Google Scholar]
- Ledlow, M. J., & Owen, F. N. 1996, AJ, 112, 9 [NASA ADS] [CrossRef] [Google Scholar]
- Mannucci, F., Basile, F., Poggianti, B. M., et al. 2001, MNRAS, 326, 745 [NASA ADS] [CrossRef] [Google Scholar]
- Maraschi, L., Colpi, M., Ghisellini, G., Perego, A., & Tavecchio, F. 2012, J. Phys. Conf. Ser., 355, 012016 [NASA ADS] [CrossRef] [Google Scholar]
- Massaglia, S., Bodo, G., Rossi, P., Capetti, S., & Mignone, A. 2016, A&A, 596, A12 [NASA ADS] [CrossRef] [EDP Sciences] [Google Scholar]
- Massaro, F., D’Abrusco, R., Tosti, G., et al. 2012, ApJ, 750, 138 [NASA ADS] [CrossRef] [Google Scholar]
- Mauch, T., & Sadler, E. M. 2007, MNRAS, 375, 931 [NASA ADS] [CrossRef] [Google Scholar]
- McKinney, J. C. 2005, ApJ, 630, L5 [NASA ADS] [CrossRef] [Google Scholar]
- Mingo, B., Watson, M. G., Rosen, S. R., et al. 2016, MNRAS, 462, 2631 [NASA ADS] [CrossRef] [Google Scholar]
- Miraghaei, H., & Best, P. N. 2017, MNRAS, 466, 4346 [NASA ADS] [Google Scholar]
- Montero-Dorta, A. D., & Prada, F. 2009, MNRAS, 399, 1106 [NASA ADS] [CrossRef] [Google Scholar]
- Nagar, N. M., Falcke, H., & Wilson, A. S. 2005, A&A, 435, 521 [NASA ADS] [CrossRef] [EDP Sciences] [Google Scholar]
- Parma, P., Fanti, C., Fanti, R., Morganti, R., & de Ruiter, H. R. 1987, A&A, 181, 244 [NASA ADS] [Google Scholar]
- Pellegrini, S., Ciotti, L., & Ostriker, J. P. 2012, ApJ, 744, 21 [NASA ADS] [CrossRef] [Google Scholar]
- Planck Collaboration XIII. 2016, A&A, 594, A13 [NASA ADS] [CrossRef] [EDP Sciences] [Google Scholar]
- Pracy, M. B., Ching, J. H. Y., Sadler, E. M., et al. 2016, MNRAS, 460, 2 [NASA ADS] [CrossRef] [Google Scholar]
- Rengelink, R. B., Tang, Y., de Bruyn, A. G., et al. 1997, A&AS, 124 [Google Scholar]
- Reynolds, C. S. 1997, MNRAS, 286, 513 [NASA ADS] [CrossRef] [Google Scholar]
- Sadler, E. M. 1984, AJ, 89 [Google Scholar]
- Sadler, E. M., Ekers, R. D., Mahony, E. K., Mauch, T., & Murphy, T. 2014, MNRAS, 438, 796 [NASA ADS] [CrossRef] [Google Scholar]
- Schawinski, K., Lintott, C., Thomas, D., et al. 2009, MNRAS, 396, 818 [NASA ADS] [CrossRef] [Google Scholar]
- Shin, M.-S., Ostriker, J. P., & Ciotti, L. 2012, ApJ, 745, 13 [NASA ADS] [CrossRef] [Google Scholar]
- Slee, O. B., Sadler, E. M., Reynolds, J. E., & Ekers, R. D. 1994, MNRAS, 269, 928 [NASA ADS] [CrossRef] [Google Scholar]
- Strateva, I., Ivezić, Ž., Knapp, G. R., et al. 2001, AJ, 122, 1861 [Google Scholar]
- Tchekhovskoy, A., Narayan, R., & McKinney, J. C. 2010, ApJ, 711, 50 [NASA ADS] [CrossRef] [Google Scholar]
- Tremaine, S., Gebhardt, K., Bender, R., et al. 2002, ApJ, 574, 740 [NASA ADS] [CrossRef] [Google Scholar]
- Tremonti, C. A., Heckman, T. M., Kauffmann, G., et al. 2004, ApJ, 613, 898 [NASA ADS] [CrossRef] [Google Scholar]
- Volonteri, M., Sikora, M., Lasota, J.-P., & Merloni, A. 2013, ApJ, 775, 94 [NASA ADS] [CrossRef] [Google Scholar]
- Whittam, I. H., Riley, J. M., Green, D. A., & Jarvis, M. J. 2016, MNRAS, 462, 2122 [NASA ADS] [CrossRef] [Google Scholar]
- Whittam, I. H., Jarvis, M. J., Green, D. A., Heywood, I., & Riley, J. M. 2017, MNRAS, 471, 908 [NASA ADS] [CrossRef] [Google Scholar]
- Wright, E. L., Eisenhardt, P. R. M., Mainzer, A. K., et al. 2010, AJ, 140, 1868 [NASA ADS] [CrossRef] [Google Scholar]
- Wrobel, J. M., & Heeschen, D. S. 1991, AJ, 101, 148 [NASA ADS] [CrossRef] [Google Scholar]
Appendix A: Additional table
Properties of the FR 0s candidates sample.
All Tables
All Figures
|
Fig. 1 Top left panel: measured major axis (FWHM) in arcsec vs. the FIRST flux density for sources that do not show clearly resolved radio emission; the red dashed line marks the adopted limit of 6.̋7 for the inclusion in the FR0CAT sample. Top right panel: distribution of the NVSS fluxes (left) of the 108 FR0CAT (blue), the 219 FRICAT (black), and the 14 sFRICAT sources (red). The vertical dotted line marks the 5 mJy limits of the BH12 sample. Bottom left panel: ratio between the FIRST and NVSS fluxes vs. the NVSS flux density for the FR0CAT sources; the dashed curve indicates the upper boundary of the region in which objects are located that pass the NVSS flux threshold, but were not selected due to the 5 mJy minimum FIRST flux requirement because of a large contribution of resolved emission. Bottom right panel: radio spectral index between 327 and 1400 MHz; the dashed cyan histogram represents the upper limits. |
| In the text | |
|
Fig. 2 Distributions of the r-band absolute magnitude (left) and black hole masses (right). The FRICAT histograms are all scaled by the relative number of FR I and FR 0, that is, by 108/219. Colors as in Fig. 1. |
| In the text | |
|
Fig. 3 Left panel: concentration index Cr vs. Dn(4000) index; right panel: absolute r-band magnitude, Mr, vs. u−r color of the FR0CAT (blue), FRICAT (black), and sFRICAT (red) sources. The green histogram on the bottom shows the percentage of blue ETGs (scale on the right axis) from Schawinski et al. (2009). The dashed line separates the blue ETGs from the red sequence, following their definition. Colors as in Fig. 1. |
| In the text | |
|
Fig. 4 WISE mid-IR colors of the FR0CAT hosts compared to the colors of FRICAT (black) and sFRICAT (red). We also show the region occupied by the Fermi blazars (purple dots). |
| In the text | |
|
Fig. 5 Radio luminosity (NVSS) vs. host absolute magnitude, Mr, for FR0CAT (blue), FRICAT (black), and sFRICAT (red) sources. The solid line shows the separation between FR I and FR II reported by Ledlow & Owen (1996), to which we applied a correction of 0.34 mag to account for the different magnitude definition and the color transformation between the SDSS and Cousin systems. |
| In the text | |
|
Fig. 6 Left panel: radio (NVSS) vs. [O III] line luminosity of the FR0CAT (blue), FRICAT (black), and sFRICAT (red) sources. The FRICAT sources with z< 0.05 are represented as black dots with a red asterisk superposed. The green line shows the correlation between these two quantities derived from the FR Is of the 3C sample from (Buttiglione et al. 2010), individually marked with the green crosses. Right panel: radio luminosity vs. BH mass (M⊙). |
| In the text | |
Current usage metrics show cumulative count of Article Views (full-text article views including HTML views, PDF and ePub downloads, according to the available data) and Abstracts Views on Vision4Press platform.
Data correspond to usage on the plateform after 2015. The current usage metrics is available 48-96 hours after online publication and is updated daily on week days.
Initial download of the metrics may take a while.