Fig. 3
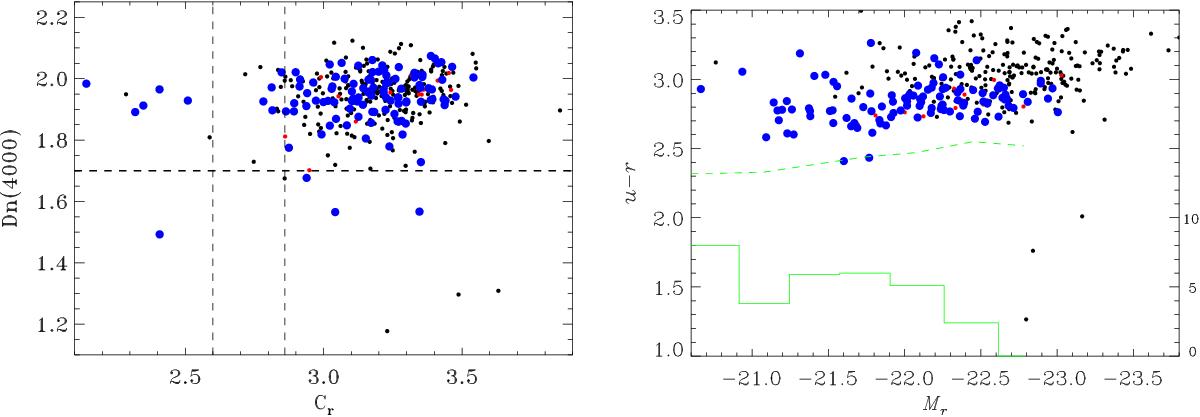
Left panel: concentration index Cr vs. Dn(4000) index; right panel: absolute r-band magnitude, Mr, vs. u−r color of the FR0CAT (blue), FRICAT (black), and sFRICAT (red) sources. The green histogram on the bottom shows the percentage of blue ETGs (scale on the right axis) from Schawinski et al. (2009). The dashed line separates the blue ETGs from the red sequence, following their definition. Colors as in Fig. 1.
Current usage metrics show cumulative count of Article Views (full-text article views including HTML views, PDF and ePub downloads, according to the available data) and Abstracts Views on Vision4Press platform.
Data correspond to usage on the plateform after 2015. The current usage metrics is available 48-96 hours after online publication and is updated daily on week days.
Initial download of the metrics may take a while.