Fig. 1
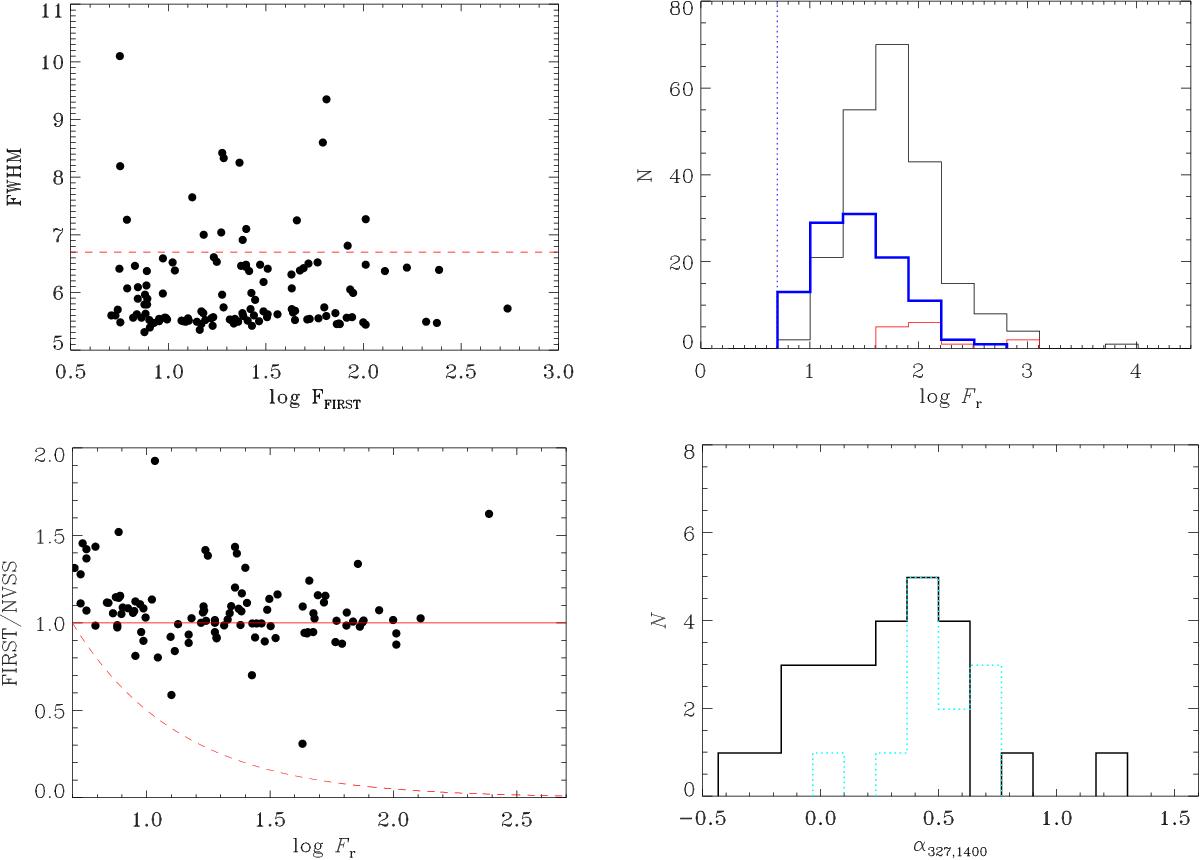
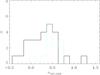
Top left panel: measured major axis (FWHM) in arcsec vs. the FIRST flux density for sources that do not show clearly resolved radio emission; the red dashed line marks the adopted limit of 6.̋7 for the inclusion in the FR0CAT sample. Top right panel: distribution of the NVSS fluxes (left) of the 108 FR0CAT (blue), the 219 FRICAT (black), and the 14 sFRICAT sources (red). The vertical dotted line marks the 5 mJy limits of the BH12 sample. Bottom left panel: ratio between the FIRST and NVSS fluxes vs. the NVSS flux density for the FR0CAT sources; the dashed curve indicates the upper boundary of the region in which objects are located that pass the NVSS flux threshold, but were not selected due to the 5 mJy minimum FIRST flux requirement because of a large contribution of resolved emission. Bottom right panel: radio spectral index between 327 and 1400 MHz; the dashed cyan histogram represents the upper limits.
Current usage metrics show cumulative count of Article Views (full-text article views including HTML views, PDF and ePub downloads, according to the available data) and Abstracts Views on Vision4Press platform.
Data correspond to usage on the plateform after 2015. The current usage metrics is available 48-96 hours after online publication and is updated daily on week days.
Initial download of the metrics may take a while.