Fig. 6
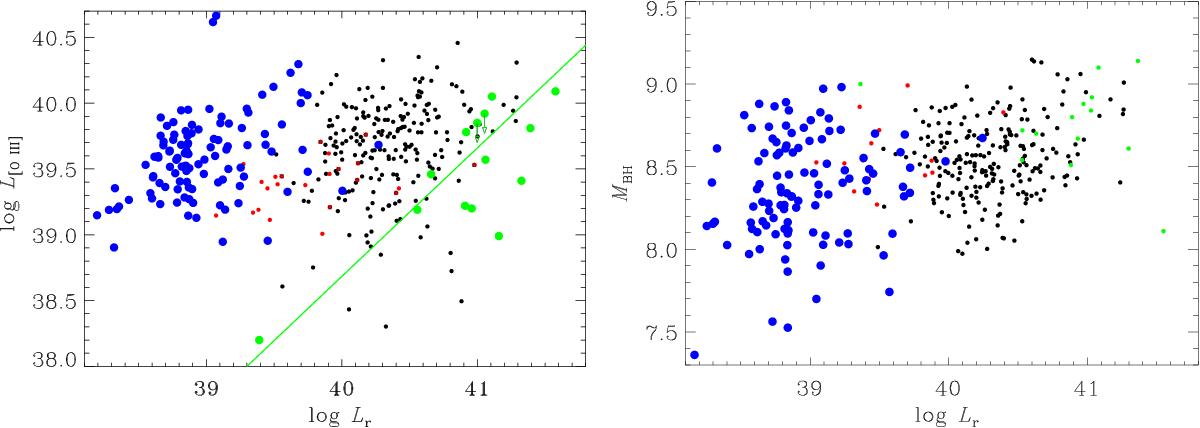
Left panel: radio (NVSS) vs. [O III] line luminosity of the FR0CAT (blue), FRICAT (black), and sFRICAT (red) sources. The FRICAT sources with z< 0.05 are represented as black dots with a red asterisk superposed. The green line shows the correlation between these two quantities derived from the FR Is of the 3C sample from (Buttiglione et al. 2010), individually marked with the green crosses. Right panel: radio luminosity vs. BH mass (M⊙).
Current usage metrics show cumulative count of Article Views (full-text article views including HTML views, PDF and ePub downloads, according to the available data) and Abstracts Views on Vision4Press platform.
Data correspond to usage on the plateform after 2015. The current usage metrics is available 48-96 hours after online publication and is updated daily on week days.
Initial download of the metrics may take a while.