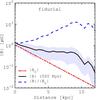
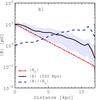
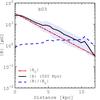
Fig. 10
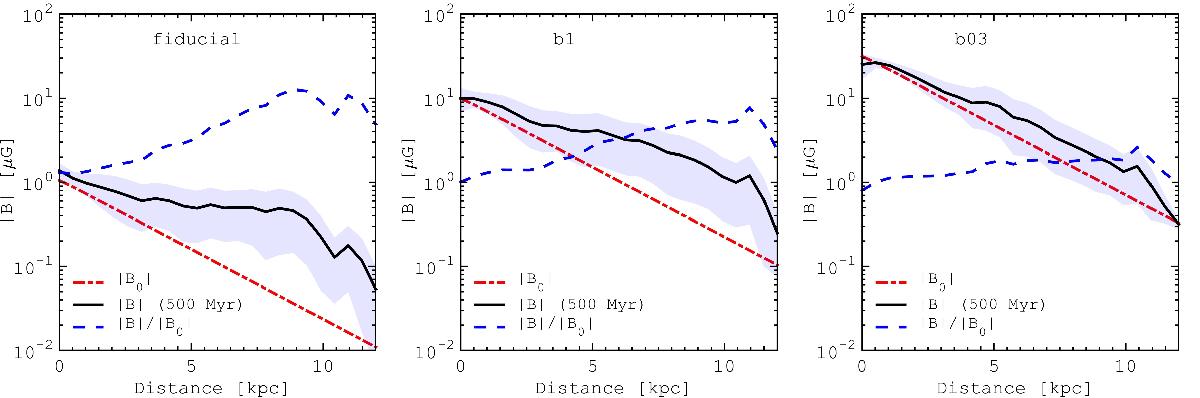
Radial profiles of the initial (red dash-dot line) and final (at t = 800 Myr, solid black line) magnetic field strength in models with a different initial magnetic field strength. The ratio between these quantities is shown by a blue dashed line. The filled area around the final magnetic field strength profile indicates the scatter at a given distance.
Current usage metrics show cumulative count of Article Views (full-text article views including HTML views, PDF and ePub downloads, according to the available data) and Abstracts Views on Vision4Press platform.
Data correspond to usage on the plateform after 2015. The current usage metrics is available 48-96 hours after online publication and is updated daily on week days.
Initial download of the metrics may take a while.