| Issue |
A&A
Volume 607, November 2017
|
|
|---|---|---|
| Article Number | A114 | |
| Number of page(s) | 15 | |
| Section | Interstellar and circumstellar matter | |
| DOI | https://doi.org/10.1051/0004-6361/201731334 | |
| Published online | 23 November 2017 | |
CO emission tracing a warp or radial flow within ≲100 au in the HD 100546 protoplanetary disk
1 School of Physics and Astronomy, University of Leeds, Leeds, LS2 9JT, UK
e-mail: This email address is being protected from spambots. You need JavaScript enabled to view it.
2 Leiden Observatory, Leiden University, PO Box 9531, 2300 RA Leiden, The Netherlands
3 Astronomy Department, Wesleyan University, 96 Foss Hill Drive, Middletown, CT 06459, USA
4 Max-Planck-Institut für Extraterrestrische Physik, Giessenbackstrasse 1, 85748 Garching, Germany
5 Institute of Astronomy, University of Cambridge, Madingley Road, Cambridge CB3 0HA, UK
Received: 7 June 2017
Accepted: 28 September 2017
Abstract
We present spatially resolved Atacama Large Millimeter/submillimeter Array (ALMA) images of 12CO J = 3−2 emission from the protoplanetary disk around the Herbig Ae star, HD 100546. We expand upon earlier analyses of this data and model the spatially-resolved kinematic structure of the CO emission. Assuming a velocity profile which prescribes a flat or flared emitting surface in Keplerian rotation, we uncover significant residuals with a peak of ≈7δv, where δv = 0.21 km s-1 is the width of a single spectral resolution element. The shape and extent of the residuals reveal the possible presence of a severely warped and twisted inner disk extending to at most 100 au. Adapting the model to include a misaligned inner gas disk with (i) an inclination almost edge-on to the line of sight, and (ii) a position angle almost orthogonal to that of the outer disk reduces the residuals to <3δv. However, these findings are contrasted by recent VLT/SPHERE, MagAO/GPI, and VLTI/PIONIER observations of HD 100546 that show no evidence of a severely misaligned inner dust disk down to spatial scales of ~ 1 au. An alternative explanation for the observed kinematics are fast radial flows mediated by (proto)planets. Inclusion of a radial velocity component at close to free-fall speeds and inwards of ≈50 au results in residuals of ≈4δv. Hence, the model including a radial velocity component only does not reproduce the data as well as that including a twisted and misaligned inner gas disk. Molecular emission data at a higher spatial resolution (of order 10 au) are required to further constrain the kinematics within ≲100 au. HD 100546 joins several other protoplanetary disks for which high spectral resolution molecular emission shows that the gas velocity structure cannot be described by a purely Keplerian velocity profile with a universal inclination and position angle. Regardless of the process, the most likely cause is the presence of an unseen planetary companion.
Key words: protoplanetary disks / planet-disk interactions / submillimeter: planetary systems / stars: individual: HD 100546
© ESO, 2017
1. Introduction
Observations of protoplanetary disks around nearby young stars offer unique insight into the initial conditions of planetary system formation. Resolved continuum observations spanning optical to cm wavelengths reveal the spatial distribution of dust across a range of grain sizes, which in turn, can highlight signposts of ongoing planet formation and/or as yet unseen massive companions/planets (e.g., cavities, gaps, rings, and spirals; see the recent reviews by Espaillat et al. 2014; Andrews 2015; and Grady et al. 2015). Likewise, spectrally and spatially resolved observations of molecular line emission disclose the spatial distribution and excitation of various gas species, from which information on disk gas properties can be extracted (e.g., Dutrey et al. 2014; Sicilia-Aguilar et al. 2016).
Second only to H2 in gas-phase molecular abundance, CO is a powerful diagnostic of various properties including the disk gas mass, radial surface density, and temperature. The primary isotopologue, 12CO, is optically thick and thus emits from the warm disk atmosphere; this allows the gas temperature in this region to be derived (e.g., Williams & Cieza 2011; Dutrey et al. 2014). The rarer isotopologues (13CO, C18O, C17O and 13C18O) have progressively lower opacities and so enable penetration towards and into the disk midplane (see, e.g., recent theoretical studies by Bruderer 2013; Miotello et al. 2016; and Yu et al. 2016). In observations with sufficiently high spatial resolution, now routine with ALMA, this allows a direct determination of the location of the CO snowline with high precision (see, e.g., Nomura et al. 2016; Schwarz et al. 2016; Zhang et al. 2017). However, it has been demonstrated recently that chemistry, in particular isotope-selective photodissociation (Visser et al. 2009), can complicate the extraction of disk gas masses from CO isotopologue emission (Miotello et al. 2014, 2016). Chemical conversion of CO to a less volatile form, e.g., CO2, complex organic molecules, or hydrocarbons, is an alternative explanation for apparently low disk masses derived from CO observations (Helling et al. 2014; Furuya & Aikawa 2014; Reboussin et al. 2015; Walsh et al. 2015; Eistrup et al. 2016; Yu et al. 2017).
Because emission from 12CO (and often 13CO) at (sub)mm wavelengths is bright, it has historically been used as a tracer of disk kinematics allowing a dynamical determination of the mass of the central star (e.g., Simon et al. 2000). However, gas motion can deviate from that expected due to Keplerian rotation alone because of a variety of different physical effects that can be inferred from spatially-resolved observations. These include spiral density waves, a substantial (and thus measurable) gas pressure gradient, radial flows mediated by accreting planets across cavities, or a disk warp (see, e.g., Rosenfeld et al. 2012; Tang et al. 2012; Casassus et al. 2013; Dutrey et al. 2014; Rosenfeld et al. 2014; Christiaens et al. 2014; Casassus et al. 2015). Spirals, radial flows, and warps can all signify the presence of (potentially massive) planetary companions; hence, perturbations from Keplerian motion traced in bright and spectrally- and spatially-resolved CO emission may expose unseen planets.
Here, we present high signal-to-noise and spectrally-resolved ALMA Cycle 0 images of 12CO J = 3−2 emission from the protoplanetary disk around the nearby Herbig Ae star, HD 100546. The HD 100546 disk has been proposed to host (at least) two massive companions (see, e.g., Acke & van den Ancker 2006; Quanz et al. 2013; Walsh et al. 2014). However, recent MagAO/GPI observations presented in Rameau et al. (2017) have raised doubt on the previous identification of the point source at 50 au as a (proto)planet by two previous and independent groups (Currie et al. 2015; Quanz et al. 2015). In Walsh et al. (2014), henceforth referred to as Paper I, we presented the 12CO (J = 3−2, ν = 345.796 GHz) first moment map and dust continuum emission (at 302 and 346 GHz). These data spatially resolved the CO emission and allowed direct determination of the radial extent of the molecular disk (≈390 au; see also Pineda et al. 2014). The continuum data analysed in Paper I showed that the (sub)mm-sized dust grains had been sculpted into two rings. Pinilla et al. (2015) showed that this dust morphology is consistent with dust trapping by two massive companions: one with mass ≈20 MJ at 10 au, and one with mass ≈15 MJ at 70 au. Hence, the ALMA data support the presence of an outer (proto)planet. Emission from 12CO (J = 3−2, 6−5, and 7−6) from HD 100546 had been detected previously in single-dish observations with APEX (Panić et al. 2010). The APEX data revealed an asymmetry in the red and blue peaks in the double-peaked line profiles most apparent in the J = 3−2 and 6−5 transitions. Panić et al. (2010) hypothesised that the asymmetry may arise due to shadowing of the outer disk by a warp in the inner disk. Using the same data set as here, Pineda et al. (2014) showed that the position-velocity diagram across the major axis of the disk is better described by a disk inclination of ≈30°, rather than an inclination of 44° that best reproduces the aspect ratio of the disk as seen in continuum emission (Paper I).
In this work we revisit the HD 100546 ALMA Cycle 0 data and conduct a deeper analysis of the spatially and spectrally resolved 12CO J = 3−2 emission. The focus of this work is the search for evidence of a warp in the inner regions of the disk, as suggested by the single dish data presented in Panić et al. (2010). In Sect. 2, we outline the imaging presented in the paper, and in Sect. 3 we describe the modelling techniques used and present the results. Sections 4 and 5 discuss the implications and state the conclusions, respectively.
2. ALMA imaging of HD 100546
HD 100546 was observed with ALMA on 2012 November 24 with 24 antennas in a compact configuration, with baselines ranging from 21 to 375 m. The self-calibrated and phase-corrected measurement set, produced as described in Paper I, is used in these analyses. In this work, we adopt the revised distance to HD 100546 determined by Gaia (109 ± 4 pc, Gaia Collaboration 2016a,b), and a stellar mass of 2.4 M⊙, (van den Ancker et al. 1998).
In Paper I, the integrated intensity and first moment maps from the 12CO J = 3−2 rotational transition at 345.796 GHz (Eup = 33.19 K and Aul = 2.497 × 10⁻⁶ s-1) were presented. The data cube from which those maps were produced was itself produced using the CASA task clean with Briggs weighting (robust = 0.5) at a spectral resolution of 0.15 km s-1. The resulting channel maps had an rms noise of 19 mJy beam-1 channel-1 and a synthesised beam of  . The 12CO was strongly detected with a signal-to-noise ratio (S/N) of 163 in the channel maps.
Because of the high S/N the imaging is redone here using uniform weighting which results in a smaller beam (and improved spatial resolution) at the expense of sensitivity. The resulting channel maps have an rms noise of 26 mJy beam-1 channel-1, a S/N of 106, and a synthesised beam of  . The maps were created using a pixel size of 0.̋12 to ensure that the beam is well sampled. Figure 1 presents the channel maps. Emission is detected (≥3σ) across 111 channels: the central channel is centred at the source velocity of 5.7 km s-1 as constrained previously by these data (see Paper I). The highest velocity emission detected is ± 8 km s-1 relative to the source velocity. Given that the disk inclination (as constrained by the outer disk) is 44° and that the stellar mass is 2.4 M⊙, emission is detected down to a radius of 16 au from the central star. Using the estimate of ≈30° for the inclination of the inner disk from Pineda et al. (2014), reduces this radius to 8 au.
The channel maps in Fig. 1 reveal the classic “butterfly” morphology of spectrally- and spatially-resolved line emission from an inclined and rotating protoplanetary disk (see, e.g., Semenov et al. 2008). Compared with the resolved 12CO emission from the disk around the Herbig Ae star HD 163296 which has a similar inclination, there is no evidence of emission from the back side of the disk that is a signature of CO freezeout in the disk midplane coupled with emission from a flared surface (de Gregorio Monsalvo et al. 2013; Rosenfeld et al. 2013). The blue-shifted emission also appears mostly symmetric about the disk major axes (especially that from the south-east of the disk) indicating that it arises from a relatively “flat” surface. This is in contrast with emission from the disk around the Group I Herbig Ae disk HD 97048 (Walsh et al. 2016; van der Plas et al. 2017). However, the emission is not wholly symmetric about the disk minor axis, with the red-shifted emission from the north-west quadrant appearing both fainter, and with a positional offset, relative to blue-shifted emission at the same velocity. In Fig. 2 the channel maps from ± 0.45 to ± 1.5 km s-1 are shown, now rotated counter-clockwise by 34° (180° −PA) to align the disk major axis in the vertical direction, and mirrored across the disk minor axis. Exhibiting the data in this velocity range and in this manner highlights the described asymmetry in brightness across the disk minor axis, the flatness of the emission, and the positional offset of the red-shifted north-west lobe relative to its blue-shifted counterpart. The brightest lobe to the north east, an apparent CO “hot spot”, is consistent in position angle with the proposed (proto)planetry companion seen in direct imaging (Quanz et al. 2013; Currie et al. 2015; Quanz et al. 2015; Rameau et al. 2017). Further, we have also recently detected emission from SO from HD 100546 which has multiple velocity components. A clear blue-shifted component (−5 km s-1 with respect to the source velocity) is coincident in position angle with both the CO “hot spot” and the proposed protoplanet which we attribute to a potential disk wind (see Booth et al. 2017, for full details).
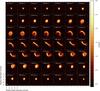 |
Fig. 1 Channel maps of the CO J = 3−2 line emission imaged at a velocity resolution of 0.15 km s-1. Note that this is slightly over-sampled with respect to the native spectral resolution of the data (0.21 km s-1). The dashed lines represent the disk major and minor axes determined from analysis of the continuum (Walsh et al. 2014). |
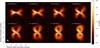 |
Fig. 2 Channel maps of the CO J = 3−2 line emission rotated in the counter-clockwise direction by 34° to align the disk major axis in the vertical direction, and mirrored across the disk minor axis to highlight the asymmetry in emission across the disk minor axis (now orientated in the horizontal direction). |
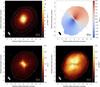 |
Fig. 3 Moment maps for CO J = 3−2 line emission from HD 100546. Clockwise from top left: zeroth moment map (integrated intensity, Jy beam-1 km s-1), first moment map (intensity-weighted velocity, km s-1), eighth moment map (peak intensity, Jy beam-1), and second moment map (intensity-weighted velocity dispersion, km s-1). The dashed contour in the second and eighth moment maps corresponds to the 3σ contour of the integrated intensity. |
Figure 3 presents the moment maps (zeroth, first, second, and eighth). The zeroth moment map (integrated intensity) was produced using a 3σ rms noise clip. The first (intensity-weighted velocity), second (intensity-weighted velocity dispersion), and eighth (peak flux density) moment maps were produced using a more conservative clip of 6σ. The integrated intensity appears relatively symmetric about the disk minor axis; however, the 12CO integrated emission extends further to the south-west than it does to the north-east. The asymmetry across the disk major axis is also evident in the eighth-moment map with the north-east side of the disk appearing brighter than the south-west side with a dark lane in the east-west direction. This dark lane coincides in position angle with a dark “wedge” seen in scattered light images with VLT/SPHERE (Garufi et al. 2016). Both maps hint at emission from a flared disk which would lead to an asymmetry in integrated emission across the disk major axis (i.e., the axis of inclination). The ALMA data provide additional evidence that the far side of the disk lies towards the north east (Garufi et al. 2016). A flared disk possesses a geometrical thickness which increases with radius and leads to an extension in emission along the direction towards the near side of the disk and arising from emission from the disk outer “edge”. The first and second moment maps also hint at asymmetric emission, in particular, the emission at the source velocity through the inner disk is twisted relative to the disk minor axis determined from the continuum emission. The velocity dispersion in the inner disk is also not wholly symmetric across the disk minor axis. A “by-eye” inspection of the first- and eighth-moment maps, in particular, suggest the possible presence of a warp in the inner disk.
3. Modelling the kinematics
Modelling of the kinematics as traced by the 12CO emission is conducted using analytical models which describe the line-of-sight projected velocity. The model moment maps are convolved with the synthesised beam of the observations. The residuals (data−model) are in units of a single spectral resolution element (δv = 0.21 km s-1). This discretisation is necessary because features smaller than the native spectral resolution of the data cannot be fit. Note that this analysis will not address the asymmetry in CO brightness across the disk seen in the channel maps and zeroth and eighth moment maps. We leave such an analysis to future work when data for multiple CO transitions and isotopologues allow a robust extraction of the gas surface density and gas temperature.
We explore several metrics of “best fit”: (i) the total number of pixels for which the analytical and smoothed projected velocity reproduces the data within one spectral resolution element, (ii) the sum of the square of the residuals scaled by the total number of unmasked pixels, and (iii) the magnitude of the peak residual. The total number of unmasked pixels in the observed first moment map is 2562. The synthesised beam of the observed images corresponds to 38 pixels in area; hence, distinguishment between models is possible for features larger than ≈0.5 × the beam area or 0.75% of the total number of pixels. Given the relatively small number of parameters for each model considered, the modelling approach is grid based, i.e. all possible grid combinations are explored.
 |
Fig. 4 Distribution of model best-fit values using metric (i) as a function of inclination and position angle for the best-fit flat disk, flared disk (lower cone), and flared disk (upper cone), respectively. The best-fit opening angles, α, of the flared disks (with respect to the disk midplane) are 13° and 9° for the lower and upper cones, respectively. The percentage scale corresponds to the full range of pixel values (from 0 to 2652). |
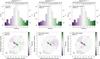 |
Fig. 5 Residual histograms (top) and maps (bottom) using metric (i) as the measure of best fit for a geometrically flat disk (left), and the lower cone (middle) and upper cone (right) of a flared disk. The histograms are displayed on a log scale to emphasise the largest residuals. |
Best-fit parameters for the flat and flared kinematic models.
3.1. A flat emitting surface
The simplest prescription for describing the first moment map of spectrally-resolved line emission from a disk is axisymmetric emission arising from a geometrically flat surface inclined to the line of sight. Assuming that the position angle of the disk is aligned with the y axis, the projected velocity on the sky relative to the observer is described by  (1)where G is the gravitational constant, M⋆ is the mass of the central star,
  is the radius, i is the inclination, and θ = arctan(y/x) (e.g., Rosenfeld et al. 2013). In this projection and for this particular orientation, x = x′/ cosi, y = y′, and z = 0. Model first moment maps for a flat disk with the same PA as HD 100546 and inclinations of 30°, 45°, and 60°, are shown in Fig. A.1.
The wide range of disk inclinations ([ 20°,60° ]) and disk position angles ([ 120°,170° ]) explored are motivated by previous analyses of the continuum data which suggested a PA of 146° ± 4° and an inclination of 44° ± 3° (see Paper I and Pineda et al. 2014). Using the same CO dataset as here, Pineda et al. (2014) suggest that the inner disk may be better described with an inclination of ≈30°; hence, we extend our explored range accordingly to ensure good coverage over the parameter space. First, a coarse grid with a resolution of 5° is run over the full parameter space, followed by a zoomed in region with a resolution of 1°.
The top-left panel of Fig. 4 presents a 3D plot showing the total number of pixels which fit the data velocity field within one spectral resolution element, δv, as a function of disk inclination and position angle. The distribution is strongly peaked: the best-fit flat disk model using this metric has an inclination of 36° and a PA of 145° with 62.1% of model pixels lying within one spectral resolution element of the data. These data are also listed in Table 1. The PA is in excellent agreement with that derived from the continuum observations. The inclination, on the other hand, is lower and closer to the suggested inclination from Pineda et al. (2014).
The left hand plots of Fig. 5 show the distribution of residuals summed over the entire disk (top panel) and the residual first moment map (bottom panel). The histogram of residuals shows small dispersion about 0 with 96.0% of pixels matching the data within ± 0.315 km s-1. The residual map shows that a flat disk well reproduces the large-scale velocity field: the largest deviations from this model occur in the innermost disk where the model velocity field over-predicts (by up to ≈7δv) the magnitude of the projected line-of-sight velocity along the minor axis of the disk. This leads to negative residuals in the north-east and positive residuals in the south-west. The morphology of the residuals suggests that the inner disk has an additional inclination along the minor axis of the outer disk, i.e., close to orthogonal to that of the outer disk.
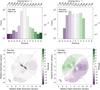 |
Fig. 6 Residual histograms (top) and maps (bottom) for a geometrically flat, rotating disk, using metrics (ii) and (iii) as the measure of best fit. The histograms are displayed on a log scale to emphasise the largest residuals. |
3.2. A flared emitting surface
Although a geometrically flat disk well reproduces much of the velocity field, particularly for the outer disk, we test next whether emission from a flared surface can improve upon the flat disk fit. This is important to check because HD 100546 is classified as a Group I (i.e., flared) Herbig Ae star (Meeus et al. 2001), so one might expect the 12CO emission to arise from a layer higher up in the disk atmosphere. Indeed, thermo-chemical modelling of the disk around HD 100546 by Bruderer et al. (2012) suggests that the 12CO line emission arises from a layer z/ρ ≈ 0.2.
Rosenfeld et al. (2013) modelled the emission from the disk around the Herbig Ae star HD 163296 by assuming that the emission arises from an inclined and flared surface with some opening angle, α, relative to the (x,y) plane (the disk midplane), i.e., a “double-cone” morphology. In this way, the front and back sides of the disk with the same projected line-of-sight velocity are spatially offset (see also de Gregorio Monsalvo et al. 2013). Here, a similar toy model is used; however, to determine the line-of-sight velocity, the radius is defined using spherical coordinates ( ) rather than cylindrical coordinates (; Rosenfeld et al. 2013). For small opening angles the two methods give similar results: the radii differ by no more than 10% for α ≤ 25°. A flared disk with this emission morphology has two possible orientations with either the lower or the upper face of the cone visible to the observer (see e.g., Fig. 3 in Rosenfeld et al. 2013). Model first moment maps for a flared disk with the same PA and inclination as HD 100546, but with different opening angles (20°, 45°, and 60°) are shown in Fig. A.2.
The range of surface opening angles ([ 0°,20° ]) is motivated by previous thermo-chemical modelling of CO emission from HD 100546 which suggest an opening angle α ≈ 11° (Bruderer et al. 2012). The symmetry in the channel maps (Fig. 3) also suggests that the emitting layer lies relatively close to the midplane. As before, a coarse grid with a resolution of 5° is initially run over the full parameter space, followed by a zoomed in grid with a resolution of 1°.
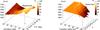 |
Fig. 7 Distribution of model best-fit values using metric (i) for the best-fit warped disk (left) and radial flow model (right). The best-fit transition radius for the warped disk and using this metric is 90 au. The pixel count for the warped disk is given as a function of inclination and position angle whereas that for the radial flow model is given as a function of transition radius and radial velocity scaling factor, χ. In these plots, the percentage scale corresponds to the z-axis range. |
Best-fit parameters for the warped kinematic models.
Figures 4 and 5 present the statistics and residuals for the best-fit lower cone and upper cone of a flared disk. Using metric (i), the best-fit upper cone model fits the data marginally better (reproducing 65.0% of the velocity field) than both the flat disk and the best-fit lower cone model (62.1% and 62.6%, respectively, see Table 1). The best-fit inclination, PA, and opening angle are 36°, 145°, and 9°, respectively (see Table 1). The opening angle of the 12CO-emitting surface agrees well with that suggested by thermo-chemical models of HD 100546 (Bruderer et al. 2012).
The best-fit lower cone model has an inclination of 38°, a PA of 142°, and an opening angle of 13°. The inclination of this model lies closest to that derived from the continuum observations (44° ± 3°). Despite resulting in a marginally worse fit to the data than the upper cone model (see Table 1), a “by-eye” examination of the residual map (bottom left panel of Fig. 5) shows that this morphology best reproduces the velocity field in all quadrants of the outer disk excepting the north-west quadrant for which the magnitude of the velocity field is over-estimated. Comparing this residual map to both the channel map (Fig. 1) and the eighth moment map (bottom right panel of Fig. 3) shows that emission from this quadrant appears less bright and exhibits a positional offset relative to that mirrored across the minor axis of the disk. However, that the upper cone model fits the data best using this metric is in agreement with the moment maps presented in Fig. 3 and recent VLT/SHERE images that confirm that the the far side of the flared disk surface lies towards the north east (Garufi et al. 2016). The global best-fit across all three model as determined by metric (ii), i.e., sum of the squares of the residuals scaled by the total number of pixels, is a flat disk with an inclination of 37° and a PA of 142°. The best-fit model selected by the smallest peak residual, i.e., metric (iii), is also shared by all three models and is a flat disk with an inclination of 39° (again in good agreement with the other two metrics); however, the disk PA which gives the smallest peak residual is 126°. The residual histograms and maps for both of these models are shown in Fig. 6. That the inner disk velocity structure is better fit with a shallower PA than the outer disk, highlights the presence of a twisted warp: this is investigated in the subsequent section.
3.3. A warped disk
The residual maps displayed in Figs. 5 and 6 reveal two features: (i) a rotating disk within ≈1.̋0 of the source position with an inclination angle approximately orthogonal to the line of sight, and (ii) a shallower position angle on small scales (≲1.̋0) than on larger scales. Both results point towards a twisted warp in the inner disk (see, e.g, Juhász & Facchini 2017; and Facchini et al. 2017, and references therein).
Because the residuals are of the order of the size of the synthesised beam, a simple toy prescription for the warp is used. The inner disk is modelled as a planar disk within a fixed radius which possesses its own inclination and PA, i.e., the inner disk is misaligned relative to the outer disk. This is similar to the approach used by Rosenfeld et al. (2014) to model the kinematics of HD 142527. Figure A.3 presents model first moment maps for a warped disk for a range of inclinations and position angles; the transition radius is fixed at 100 au, and the outer disk parameters are given values appropriate for the HD 100546 disk.
The outer disk velocity structure is fixed to that of the best-fit upper cone model. As mentioned in the previous section, recent VLT/SPHERE images of scattered light from HD 100546 suggest that the far side of the (flared) disk lies towards the north-east (Garufi et al. 2016) in agreement with the moment maps in Fig. 3. This results in three additional fitting parameters only: the inner disk inclination ([40°, 90°]), the inner disk PA ([40°, 100°]), and a transition radius marking the boundary between the inner and outer disks ([40, 120] au). Note that, for simplicity, we assume that the inner disk velocity structure is described using the flat disk prescription (i.e., Eq. (1)). A coarse grid with a resolution of 10° and 10 au is first run to identify the parameter space containing the global best-fit, followed by a finer grid over this zoomed-in region (with a resolution of 2° and 2 au).
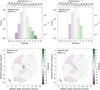 |
Fig. 8 Residual histograms (top) and maps (bottom) for a protoplanetary disk with a warped inner disk using metrics (i) and (ii) as the metric of best fit. The histograms are displayed on a log scale to emphasise the largest residuals. Note that metrics (ii) and (iii) select the same warped inner disk parameters (see Table 2). |
Figures 7 and 8 present the statistics and residuals for the best-fit warped disk, respectively. Metric (i) favours a model with an inner disk that is almost “edge-on” (i = 80°) to the line of sight, almost orthogonal to the outer disk major axis (PA = 60°), and with a transition radius of 90 au (see Fig. 7 and Table 2). These values are consistent with the morphology of the residuals of both the flat and flared models (see Figs. 5 and 6). The magnitude of the peak residual of this model is significantly smaller than the previous models selected using metric (i), 4δv versus 7δv. Metrics (ii) and (iii) select the same model (see Table 2) with parameters similar to those using metric (i); an inclination of 84°, a PA of 64°, and a transition radius of 100 au. Comparing the residual histograms and maps for these two models (shown in Fig. 8), highlights how a small change in inclination and/or position angle can significantly reduce the magnitude of the peak residual. This latter model results in a peak residual of only 2.4δv and has the smallest dispersion of residuals: 98% of pixels match the data within ± 0.315 km s-1 and 100% of pixels match within ± 0.525 km s-1.
Figure 9 shows an idealised model of the HD 100546 protoplanetary disk as proposed by the best-fit warp model. The morphology of the intermediate region between the inner and outer disks is not yet known and so is intentionally left blank in the cartoon. However, such “broken disks” are predicted by SPH models of disks around binary systems (see, e.g., Facchini et al. 2017).
 |
Fig. 9 Cartoon of the HD 100546 protoplanetary disk. The colour scale indicates the z coordinate of the inner and outer disks relative to the sky plane (z = 0). Note that the morphology of the intermediate region between the inner and outer disks is not yet known and so it is intentionally left blank. |
3.4. A radial flow
The modelling presented in the previous section demonstrated how a misaligned and Keplerian gas disk within 100 au can reproduce the velocity structure in this region; however, scattered light images taken with VLT/SPHERE and MagAO/GPI with a spatial resolution of 0.̋02 and 0.̋01, respectively, reveal no evidence of a severely misaligned dust disk beyond ≈10 au (Garufi et al. 2016; Follette et al. 2017). However, both datasets do suggest the presence of spirals in the inner disk within 50 au, and resolve the inner edge of the outer dust disk traced in small grains (11−15 au, depending on wavelength). Spiral arm features are also seen in larger-scale scattered light images (≳100 au; Grady et al. 2001; Ardila et al. 2007; Boccaletti et al. 2013). Further, modelling of recent VLTI/PIONIER interferometric observations of HD 100546 reported in the survey by Lazareff et al. (2017), and which have a spatial resolution of order ~1 au, suggests that the very innermost dust disk has a similar position angle (152°) and inclination (46°) as the outer disk traced in sub-mm emission (146° and 44°, respectively; Walsh et al. 2014). Hence, if the velocity structure of the CO gas is indeed caused by an extremely misaligned Keplerian disk inwards of ~100 au, in light of these new observations it appears that the small dust grains may have a different morphology than the gas in the inner disk. However, there is no known physical mechanism that would decouple the small dust grains and molecular gas to such a severe extent. It should be noted that the disk parameters derived from the VLTI/PIONIER interferometric data are dependent upon the model used to reproduce the data and other morphologies may be possible.
Despite the warp model providing a good fit to the velocity structure, we now consider an alternative explanation for deviations from global Keplerian motion: radial flows (Casassus et al. 2013, 2015; Rosenfeld et al. 2014; Loomis et al. 2017). As already highlighted by Rosenfeld et al. (2014), warps and radial flows can be difficult to distinguish using the first moment map alone. Examination of the morphology of the residuals in Figs. 5 and 6 support a potential radial component to the gas motion. For an inclined and rotating disk, the line-of-sight projected velocity of the radial component will be zero along the major axis of the disk, and will reach its maximum value along the minor axis of the disk. Further, this radial component will be blue-shifted in velocity for material falling inwards from the far side of the disk (from the north east) and red-shifted in velocity for material falling inwards from the near side of the disk (from the south west).
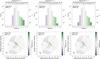 |
Fig. 10 Residual histograms (top) and maps (bottom) for a protoplanetary disk with a radial velocity component for each metric of best fit. The histograms are displayed on a log scale to emphasise the largest residuals. |
Best-fit parameters for the radial flow model.
We now investigate whether a radial velocity component to the gas can reproduce the velocity structure of the CO emission from HD 100546. We adopt the same approach as the toy models presented in Rosenfeld et al. (2014) and assume that the radial velocity component is a fixed fraction of the local Keplerian velocity, vr = χvK where  . The line-of-sight projected velocity is thus given by,
  (2)where θ is defined as in Sect. 3.1 and χ is a scaling factor we assume can vary between 0 (no radial flow) and
  (i.e., radial infall at the local free-fall velocity, see e.g., Murillo et al. 2013). The disk velocity structure is fixed to that of the best-fit upper cone model for the outer disk, and we define the transition radius as the radius within which the radial component for the velocity field is non-zero for χ> 0. Given the symmetry in the residuals, we assume that inwards of the transition radius, the disk is flat (i.e., α = 0°, see Sect. 3.2). Hence, there are only two fitting parameters, the transition radius ([10, 120] au) and the scaling factor χ ([0:]). As before, we first run a coarse grid at a resolution of 10 au and 0.1, followed by a finer grid with a resolution of 1 au and 0.01 over a zoomed in region covering the region of global best fit. Figure A.4 presents model first moment maps for a disk with a radial component to the gas velocity for a range of values of χ and a transition radius fixed at 100 au. The outer disk parameters are values appropriate for the HD 100546 protoplanetary disk.
Figures 7 and 10 and Table 3 present the statistics and residuals for the best-fit radial flow model. Metric (i) favours a radial component to the flow within a radius of 54 au and a velocity scaling factor of χ = 1.23 which is close to the free-fall velocity. Metric (ii) selects a model with very similar parameters (52 au and χ = 1.40) whereas metric (iii) favours a larger transition radius (84 au) and a slower flow (χ = 0.63). Inspection of the residuals in Fig. 10 shows that all three metrics have a very similar distribution of residuals. However, the radial flow model does not reproduce the velocity structure as well as the warped disk: using metric (iii) the peak residual for the former model is 3.7δv versus 2.4δv for the latter.
4. Discussion
4.1. Is the inner disk warped?
The analysis of the kinematics of CO emission from the HD 100546 protoplanetary disk presented here has suggested the presence of a misaligned molecular gas disk within 100 au of the central star. The best-fit warp model suggests that the inner gas disk has a position angle that is almost orthogonal to that of the outer disk, and an inclination almost edge-on to the line-of-sight (see Fig. 9). As discussed in Sect. 3.4, scattered light images with a spatial resolution down to 1−2 au suggest no misalignment between the inner and outer dust disks (Garufi et al. 2016; Follette et al. 2017; Lazareff et al. 2017). Thus, if scattered light observations are to be reconciled with the predicted warp, the small dust grains must be severely decoupled from the gas. At this time, we are not aware of any mechanism that could produce such a phenomenon.
However, the presence of a warp in the inner disk does help to explain several observations: asymmetries in intensity of the CO emission in both the single-dish data (Panić et al. 2010) and the ALMA data presented here (see Figs. 3 and 11), and the “dark wedge” seen in the scattered light images (Garufi et al. 2016) is predicted by scattered light models including a misaligned inner disk (Marino et al. 2015; Facchini et al. 2017). This “dark wedge” aligns well with the “dark lane” in the CO eighth-moment map in Fig. 3.
The presence of a disk warp in HD 100546 was originally proposed by Panić et al. (2010) and based on asymmetries seen in the red and blue peaks of single-dish spectra observed with APEX. The ALMA data presented here show no such asymmetries in the peaks of the line profile (see Fig. 11); however, the mirrored line profile does highlight that the red and blue lobes of emission have different shapes when integrated over the disk. The bottom panel in Fig. 11 shows the residuals following subtraction of the average of the original and mirrored line profiles from the original. This is consistent with the morphology seen in the channel maps and described in Sect. 2.
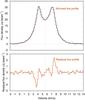 |
Fig. 11 CO J = 3−2 line profile extracted from within the 3σ contour of the integrated intensity (see Fig. 3). The bottom panel shows the residual line profile highlighting the asymmetry in the red and blue peaks. |
A warp in the inner disk could shadow the outer disk and lead to an asymmetric temperature structure, because one side of the disk is more illuminated by the central star than the opposite side (see Fig. 3 in Panić et al. 2010). Because the 12CO emission is optically thick, it traces the gas temperature, and thus any perturbations, in the emitting layer, usually the disk atmosphere. The APEX 12CO J = 3−2 line profile from Panić et al. (2010) shows a stronger blue peak. The dates of the observations taken with APEX and ALMA are November 2008 (Panić et al. 2010) and November 2012 (Walsh et al. 2014), respectively. There also exist multiple APEX observations of the 12CO J = 6−5 transition. The line profile presented in Panić et al. (2010) shows an even higher-contrast asymmetry in the blue and red peaks than in the J = 3−2 line. More recent observations taken between April and July 2014 and presented in Kama et al. (2016) show a similar asymmetry; however, the ratio between the peaks is within the flux density uncertainties of the observations (M. Kama, priv. comm.). Thus, it is currently difficult to draw concrete conclusions on any periodicity in the shapes of the line profiles. Conservatively assuming that the warp has rotated ≈90° between acquirement of the original APEX data (with the stronger blue peak) and the ALMA data (with no asymmetry in the line profile) suggests a warp precession period of the order of 16 yr.
The presence of a warp indicates the presence of a perturbing companion. A massive (≈20 MJ) planetary companion has been proposed to reside at ≈10 au in HD 100546. This is thought to be responsible for clearing the inner cavity in both the dust and gas (Mulders et al. 2013; Panić et al. 2014; Walsh et al. 2014; Pinilla et al. 2015; Wright et a. 2015; Garufi et al. 2016), as well as inducing dynamical perturbations in [OI], OH, and CO line emission from the inner region (Acke & van den Ancker 2006; van der Plas et al. 2009; Brittain et al. 2014). In addition, a second companion, which may still be in the act of formation, has been proposed to reside at ≈50 au with a mass estimate of ≈15 MJ (Quanz et al. 2013; Walsh et al. 2014; Quanz et al. 2015; Currie et al. 2015; Pinilla et al. 2015). However, as mentioned in the introduction, the identification of this point source as a (proto)planet has been disputed in a recent analysis of MagAO/GPI observations showing close-to-zero proper motion of the point source on a 4.6 yr timescale at the 2σ level (Rameau et al. 2017). Given that the presence of the outer ring of (sub)mm dust emission is difficult to explain in the absence of an outer companion (Walsh et al. 2014; Pinilla et al. 2015), we proceed for the remainder of the discussion with the assumption that this disk “feature” indeed arises due to a (proto)planet. It should be noted that the planet masses derived from previous analysese have all assumed that the planet orbital path and disk are co-planar.
The precession period of a warp induced by a perturbing companion can be estimated using Eq. (2) in Debes et al. (2017), used for the case of TW Hya, and which was originally derived by Lai (2014),  (3)where μc is the mass ratio of the companion to the central star, ic is the angle between the star-planet orbital plane and disk plane (here 80°), rdisk is the radius of the outer edge of the inner disk, and ac is the orbital radius of the planet. Assuming that the protoplanet at 50 au is the perturbing body and setting μc = 0.006, rdisk = 40 au, and ac = 50 au results in a precession period of 1940 yr. Hence, it is unlikely that the outer companion has perturbed the inner disk creating a warp that explains the change in shape in line profile seen in the single-dish data and these ALMA data on a 4-year baseline. Assuming instead that the inner companion is triggering the warp, and that the inner disk cavity is not completely devoid of gas (μc = 0.008, rdisk =10 au, ic = 80°, and ac = 10 au), leads to a precession period of 111 yr.
Keeping all other parameters constant, a companion mass of ≈140 MJ (≈0.1 M⊙) is required for a warp precession period of ≈16 yr. There is no evidence that HD 100546 is in a binary system with an M-dwarf star. Alternatively, a closer-in companion of only ≈4.5 MJ at 1 au and assuming an inner disk radius of 1 au, leads to a similar precession period. However, these ALMA data suggest that the non-Keplerian gas motion lies significantly beyond 1 au since the highest velocity gas detected only probes down to a radius of 8−16 au depending upon the assumed disk inclination. Longer baseline (in time) observations are required to determine if any clear periodicity in the line profile shape exists, and to then relate this more concretely to the precession period of an inner disk warp.
Similar analyses have revealed warps in disks around other stars. Rosenfeld et al. (2012) showed that the kinematic structure of TW Hya could be reproduced using a parametric model of a disk warp with a moderate inclination (≈8°) at a radius of 5 au. Facchini et al. (2014) demonstrated the observed warp amplitude could be induced by a misaligned close-in companion as massive as ≈14 MJ orbiting within 4 au of the central star. New scattered light data from HST/STIS, coupled with archival data over a 17-year baseline, reveal an orbiting azimuthal brightness asymmetry, with a period of ≈16 yr (Debes et al. 2017). The authors argue that this is consistent with partial shadowing of the outer disk by a misaligned inner disk interior to 1 au and that is precessing due to the presence of a roughly Jupiter-mass planetary companion.
4.2. Is a radial flow contributing to the CO kinematics?
The presence of a severely misaligned gas disk in the inner ~100 au of HD 100546 is contradicted by multiple scattered light observations at a resolution of ~1–2 au. On the other hand, a radial flow does not require any misalignment between the gas and dust disks.
Recent observations of Brγ emission with VLTI/AMBER have revealed that the accretion rate of HD 100546 is of order 10-7M⊙ yr-1 (Mendigutía et al. 2015) which suggests that inner disk material (≲1 au) is replenished from the outer disk despite the presence of a CO gas cavity within 11 au (van der Plas et al. 2009). Further, very recent observations of HD 100546 with SPHERE/ZIMPOL have revealed an intriguing bar-like structure within the 10 au dust cavity and at a similar position angle as our residuals (Mendigutía et al. 2017). The authors have speculated that this feature arises due to small dust grains being dragged along by a channelled gas flow through the cavity. However, the ALMA data presented here are not sensitive to these spatial scales. Modelling of the ALMA data including a radial velocity component suggests that if such a component is present, it arises from as far out as ≈50 au. Taken together, the ALMA data and SPHERE/ZIMPOL data suggest an intriguing connection between the gas kinematics on larger (≫10 au) scales and the dust and gas morphology within the cavity.
Despite this intriguing connection, the model including only a radial component does not fit the data as well as the warp model. One reason for this is that the radial flow model enforces that the maximum line-of-sight velocity due to the flow aligns with the disk minor axis as defined by the position angle of the outer disk. On the other hand, the warp model suggests that the maximum line-of-sight velocity lies at a position angle of 64°: this is 9° rotated from the disk minor axis. It remains possible that the inner ≲100 au of the HD 100546 protoplanetary disk is host to a both a warp and a radial flow. In that case, the warp parameters (i.e., the inclination and twist angles) may not be as extreme as suggested here. However, fitting a more complex and multiple-component velocity structure requires guidance from higher spatial resolution data.
Thanks to ALMA, evidence is mounting that radial flows may be a common feature of transition disks. HD 142527 is another protoplanetary disk in which gas motion traced by HCO+ (J = 4−3) and 12CO (J = 6−5) emission has been observed to deviate from purely Keplerian rotation (Casassus et al. 2013; Rosenfeld et al. 2014; Casassus et al. 2015). HD 142527 is a transition disk which possesses the largest known dust cavity in sub(mm) emission (≈140 au; Casassus et al. 2013; Fukagawa et al. 2013). The observed gas motions were postulated to arise from fast (near free-fall) radial flows across the cavity and accretion onto the central star via a severely misaligned inner disk (Casassus et al. 2013, 2015; Marino et al. 2015). Marino et al. (2015) propose that the inner and outer disk are misaligned by 70°. Also, “hot-off-the-press” ALMA observations of HCO+ (J = 3−2) line emission from AA Tau at an angular resolution of 0.̋2 (≈30 au), also show deviations from global Keplerian rotation due to either a warp or fast radial inflow in the inner regions (Loomis et al. 2017). Similar to here, this was revealed by a clear twist in the first moment map of the molecular line emission.
5. Conclusion
The data and analyses shown here demonstrate that the kinematic structure of the gas disk around HD 100546 cannot be described by a purely Keplerian velocity profile with a universal inclination and position angle. Given the current evidence for the presence of (at least) one massive planetary companion orbiting within 10 au of the central star, the presence of a disk warp, albeit with extreme parameters, has been our favoured explanation. However, recent near-IR interferometric observations suggest that the very inner dust disk is not misaligned relative to the outer dust disk traced in (sub)mm emission and scattered light images. This suggests that the gas and dust disks may have different morphologies on radial scales of ~1 to 10’s of au; however, there currently exists no known physical mechanism that would lead to such extreme decoupling between the gas and small dust grains. To determine whether the alternative explanation of fast radial flows could be responsible for the observed kinematic structure of HD 100546, higher spatial and spectral resolution data are required to resolve gas emission across the inner dust (≲25 au) and gas (≲10 au) cavities and explore any spatial association with the proposed planetary candidate(s).
Acknowledgments
We thank the referee, Dr Ruobing Dong, whose comments helped improve the discussion in the paper. We also thank Dr Ignacio Mendigutía and Professor Rene Oudmaijer for sharing the results of their SPHERE/ZIMPOL observations of HD 100546 in advance of publication. This paper makes use of the following ALMA data: ADS/JAO.ALMA#2011.0.00863.S. ALMA is a partnership of ESO (representing its member states), NSF (USA) and NINS (Japan), together with NRC (Canada), NSC and ASIAA (Taiwan), and KASI (Republic of Korea), in cooperation with the Republic of Chile. The Joint ALMA Observatory is operated by ESO, AUI/NRAO and NAOJ. This work was supported by the Netherlands Organisation for Scientific Research (NWO: program number 639.041.335). C.W. also thanks the University of Leeds for financial support. S.F. is supported by the CHEMPLAN project, grant agreement 291141 funded by the European Research Council under ERC-2011-ADG. A.J. is supported by the DISCSIM project, grant agreement 341137 funded by the European Research Council under ERC-2013-ADG.
References
- Acke, B., & van den Ancker, M. E. 2006, A&A, 449, 267 [NASA ADS] [CrossRef] [EDP Sciences] [Google Scholar]
- Andrews, S. M. 2015, PASP, 127, 961 [NASA ADS] [CrossRef] [Google Scholar]
- Ardila, D. R., Golimowski, D. A., Krist, J. E., et al. 2007, ApJ, 665, 512 [NASA ADS] [CrossRef] [Google Scholar]
- Boccaletti, A., Pantin, E., Lagrange, A.-M., et al. 2013, A&A, 560, A20 [NASA ADS] [CrossRef] [EDP Sciences] [Google Scholar]
- Booth, A., Walsh, C., Kama, M., et al. 2017, A&A, submitted [Google Scholar]
- Brittain, S. D., Najita, J. R., & Carr, J. S. 2009, ApJ, 702, 85 [NASA ADS] [CrossRef] [Google Scholar]
- Brittain, S. D., Carr, J. S., Najita, J. R., Quanz, S. P., & Meyer, M. R. 2014, ApJ, 791, 136 [NASA ADS] [CrossRef] [Google Scholar]
- Bruderer, S. 2013, A&A, 559, A46 [NASA ADS] [CrossRef] [EDP Sciences] [Google Scholar]
- Bruderer, S., van Dishoeck, E. F., Doty, S. D., & Herczeg, G. J. 2012, A&A, 541, A91 [NASA ADS] [CrossRef] [EDP Sciences] [Google Scholar]
- Casassus, S., van der Plas, G., Pérez, S. M., et al. 2013, Nature, 493, 191 [NASA ADS] [CrossRef] [Google Scholar]
- Casassus, S., Marino, S., Pérez, S., et al. 2015, ApJ, 811, 92 [NASA ADS] [CrossRef] [Google Scholar]
- Christiaens, V., Casassus, S., Perez, S., van der Plas, G., & Ménard, F. 2014, ApJ, 785, L12 [Google Scholar]
- Currie, T., Cloutier, R., Brittain, S., et al. 2015, ApJ, 814, L27 [NASA ADS] [CrossRef] [Google Scholar]
- Debes, J. H., Poteet, C. A., Jang-Condell, H., et al. 2017, ApJ, 835, 205 [NASA ADS] [CrossRef] [Google Scholar]
- de Gregorio Monsalvo, I., Ménard, F., Dent, W., et al. 2013, A&A, 557, A133 [NASA ADS] [CrossRef] [EDP Sciences] [Google Scholar]
- Dutrey, A., Semenov, D., Chapillon, E., et al. 2014a, in Protostars and Planets VI, eds. H. Beuther et al. (Tucson, AZ: Univ. Arizona Press), 317 [Google Scholar]
- Dutrey, A., di Folco, E., Guilloteau, S., et al. 2014b, Nature, 514, 600 [NASA ADS] [CrossRef] [Google Scholar]
- Eistrup, C., Walsh, C., & van Dishoeck, E. F. 2016, A&A, 595, A83 [NASA ADS] [CrossRef] [EDP Sciences] [Google Scholar]
- Espaillat, C., Muzerolle, J., Najita, J., et al. 2014, in Protostars and Planets VI, ed. H. Beuther et al. (Tucson, AZ: Univ. Arizona Press), 497 [Google Scholar]
- Facchini, S., Ricci, L., & Lodato, G. 2014, MNRAS, 442, 3700 [NASA ADS] [CrossRef] [Google Scholar]
- Facchini, S., Juhász, A., & Lodato, G. 2017, MNRAS, in press [arXiv:1709.08369] [Google Scholar]
- Follette, K. B., Rameau, J., Dong, R., et al. 2017, AJ, 153, 264 [NASA ADS] [CrossRef] [Google Scholar]
- Fukagawa, M., Tsukagoshi, T., Momose, M., et al. 2013, PASJ, 65, L14 [NASA ADS] [CrossRef] [Google Scholar]
- Furuya, K., & Aikawa, Y. 2014, ApJ, 790, 97 [NASA ADS] [CrossRef] [Google Scholar]
- Gaia Collaboration (Prusti, T., et al.) 2016a, A&A, 595, A1 [NASA ADS] [CrossRef] [EDP Sciences] [Google Scholar]
- Gaia Collaboration (Brown, A. G. A., et al.) 2016b, A&A, 595, A2 [NASA ADS] [CrossRef] [EDP Sciences] [Google Scholar]
- Garufi, A., Quanz, S. P., Schmid, H. M., et al. 2016, A&A, 588, A8 [NASA ADS] [CrossRef] [EDP Sciences] [Google Scholar]
- Grady, C. A., Polomski, E. F., Henning, Th., et al. 2001, AJ, 122, 3396 [NASA ADS] [CrossRef] [Google Scholar]
- Grady, C., Fukagawa, M., Maruta, Y., et al. 2015, Ap&SS, 355, 253 [NASA ADS] [CrossRef] [Google Scholar]
- Helling, C., Woitke, P., Kamp, I., et al. 2014, Life, 4, 142 [NASA ADS] [CrossRef] [Google Scholar]
- Juhász, A., & Facchini, S. 2017, MNRAS, 466, 4053 [NASA ADS] [Google Scholar]
- Kama, M., Bruderer, S., van Dishoeck, E. F., et al. 2016, A&A, 592, A83 [NASA ADS] [CrossRef] [EDP Sciences] [Google Scholar]
- Lai, D. 2014, MNRAS, 440, 3532 [NASA ADS] [CrossRef] [Google Scholar]
- Lazareff, B., Berger, J.-P., Kluska, J., et al. 2017, A&A, 599, A85 [NASA ADS] [CrossRef] [EDP Sciences] [Google Scholar]
- Loomis, R. A., Öberg, K. I., Andrews, S. M., & MacGregor, M. A. 2017, ApJ, 840, 23 [NASA ADS] [CrossRef] [Google Scholar]
- Marino, S., Pérez, S., & Casassus, S. 2015, ApJ, 798, L44 [NASA ADS] [CrossRef] [Google Scholar]
- Meeus, G., Waters, L. B. F. M., Bouwman, J., et al. 2001, A&A, 365, 476 [NASA ADS] [CrossRef] [EDP Sciences] [Google Scholar]
- Mendigutía, I., de Wit, W. J., Oudmaijer, R., et al. 2015, MNRAS, 453, 2126 [NASA ADS] [CrossRef] [Google Scholar]
- Mendigutía, I., Oudmaijer, R., Garufi, A., et al. 2017, A&A, in press DOI: 10.1051/0004-6361/201731131 [Google Scholar]
- Miotello, A., Bruderer, S., & van Dishoeck, E. F. 2014, A&A, 572, A96 [NASA ADS] [CrossRef] [EDP Sciences] [Google Scholar]
- Miotello, A., van Dishoeck, E. F., Kama, M., & Bruderer, S. 2016, A&A, 594, A85 [NASA ADS] [CrossRef] [EDP Sciences] [Google Scholar]
- Mulders, G. D., Paardekooper, S.-J., Panić, O., et al. 2013, A&A, 557, A68 [NASA ADS] [CrossRef] [EDP Sciences] [Google Scholar]
- Murillo, N. M., Lai, S.-P., Bruderer, S., Harsono, D., & van Dishoeck, E. F. 2013, A&A, 560, A103 [NASA ADS] [CrossRef] [EDP Sciences] [Google Scholar]
- Nomura, H., Tsukagoshi, T., Kawabe, R., et al. 2016, ApJ, 819, L7 [NASA ADS] [CrossRef] [Google Scholar]
- Panić, O., van Dishoeck, E. F., Hogerheijde, M. R., et al. 2010, A&A, 519, A110 [NASA ADS] [CrossRef] [EDP Sciences] [Google Scholar]
- Panić, O., Ratzka, Th., Mulders, G. D., et al. 2014, A&A, 562, A101 [NASA ADS] [CrossRef] [EDP Sciences] [Google Scholar]
- Perez, S., Dunhill, A., Casassus, S., et al. 2015, ApJ, 811, L5 [NASA ADS] [CrossRef] [Google Scholar]
- Pineda, J. E., Quanz, S. P., Meru, F., et al. 2014, ApJ, 788, L34 [NASA ADS] [CrossRef] [Google Scholar]
- Pinilla, P., Birnstiel, T., & Walsh, C. 2015, A&A, 580, A105 [NASA ADS] [CrossRef] [EDP Sciences] [Google Scholar]
- Quanz, S. P., Amara, A., Meyer, M. R., et al. 2013, ApJ, 766, L1 [NASA ADS] [CrossRef] [Google Scholar]
- Quanz, S. P., Amara, A., Meyer, M. R., et al. 2015, ApJ, 807, 64 [NASA ADS] [CrossRef] [Google Scholar]
- Rameau, J., Follette, K. B., Pueyo, L., et al. 2017, AJ, 153, 244 [NASA ADS] [CrossRef] [Google Scholar]
- Reboussin, L., Wakelam, V., Guilloteau, S., Hersant, F., & Dutrey, A. 2015, A&A, 579, A82 [NASA ADS] [CrossRef] [EDP Sciences] [Google Scholar]
- Rosenfeld, K. A., Qi, C., Andrews, S. M., et al. 2012, ApJ, 774, 16 [Google Scholar]
- Rosenfeld, K. A., Andrews, S. M., Hughes, A. M., Wilner, D. J., & Qi, C. 2013, ApJ, 774, 16 [NASA ADS] [CrossRef] [Google Scholar]
- Rosenfeld, K. A., Chiang, E., & Andrews, S. M. 2014, ApJ, 782, 62 [NASA ADS] [CrossRef] [Google Scholar]
- Schwarz, K. R., Bergin, E. A., Cleeves, L. I., et al. 2016, ApJ, 823, 91 [NASA ADS] [CrossRef] [Google Scholar]
- Semenov, D., Pavlyuchenkov, Ya., Henning, Th., Wolf, S., & Launhardt, R. 2008, ApJ, 673, L195 [NASA ADS] [CrossRef] [Google Scholar]
- Sicilia-Aguilar, A., Banzatti, A., Carmona, A., et al. 2016, PASA, 33, 59 [Google Scholar]
- Simon, M., Dutrey, A., & Guilloteau, S. 2000, ApJ, 545, 1034 [NASA ADS] [CrossRef] [Google Scholar]
- Tang, Y.-W., Guilloteau, S., Piétu, V., et al. 2012, A&A, 547, A84 [NASA ADS] [CrossRef] [EDP Sciences] [Google Scholar]
- van den Ancker, M. E., de Winter, D., & Tijn A Djie, H. R. E. 1998, A&A, 330, 145 [NASA ADS] [Google Scholar]
- van der Plas, G., van den Ancker, M. E., Acke, B., et al. 2009, A&A, 500, 1137 [NASA ADS] [CrossRef] [EDP Sciences] [Google Scholar]
- van der Plas, G., Wright, C. M., Ménard, F., et al. 2017, A&A, 597, A32 [NASA ADS] [CrossRef] [EDP Sciences] [Google Scholar]
- Visser, R., van Dishoeck, E. F., & Black, J. H. 2009, A&A, 503, 323 [NASA ADS] [CrossRef] [EDP Sciences] [Google Scholar]
- Williams, J. P., & Cieza, L. A. 2011, ARA&A, 49, 67 [NASA ADS] [CrossRef] [Google Scholar]
- Walsh, C., Juhász, A., Pinilla, P., et al. 2014, ApJ, 791, L6 [NASA ADS] [CrossRef] [Google Scholar]
- Walsh, C., Nomura, H., & van Dishoeck, E. F. 2015, A&A, 582, A88 [NASA ADS] [CrossRef] [EDP Sciences] [Google Scholar]
- Walsh, C., Juhász, A., Meeus, G., et al. 2016, ApJ, 831, 200 [NASA ADS] [CrossRef] [Google Scholar]
- Wright, C. M., Maddison, S. T., Wilner, D. J., et al. 2015, MNRAS, 453, 414 [NASA ADS] [CrossRef] [Google Scholar]
- Yu, M., Willacy, K., Dodson-Robinson, S. E., Turner, N. J., & Evans II, N. J. 2016, ApJ, 822, 53 [NASA ADS] [CrossRef] [Google Scholar]
- Yu, M., Evans II, N. J., Dodson-Robinson, S. E., Willacy, K., & Turner, N. J. 2017, ApJ, 841, 39 [NASA ADS] [CrossRef] [Google Scholar]
- Zhang, K., Bergin, E. A., Blake, G. A., Cleeves, L. I., & Schwarz, K. R. 2017, Nature Astron., 1, 130 [Google Scholar]
Appendix A: Model first moment maps
Figure A.1 shows the first moment maps for a geometrically flat protoplanetary disk for a range of disk inclinations. Figure A.2 shows model first moment maps for a flared disk with a fixed inclination for a range opening angles, α, of the emitting surface. Figure A.3 shows model first moment maps for a warped inner disk with a fixed transition radius of 100 au, and a range of warp inclinations and position angles. The outer disk parameters are those from the best-fit upper cone model (i.e., an inclination of 36°, a PA of 145°, and an opening angle of 9°). Figure A.4 shows model first moment maps for a disk with a radial flow component to the velocity within a transition radius of 100 au, and for a range of velocity scaling factors, χ (vr = χvK). The outer disk parameters are fixed to those of the best-fit upper cone model.
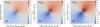 |
Fig. A.1 Model first moment maps for a geometrically flat disk with a PA of 145° (representative of the HD 100546 disk) at an inclination of 30° (left), 45° (middle), and 60° (right). The contours are in units of a single spectral resolution element (0.21 km s-1). |
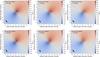 |
Fig. A.2 Model first moment maps for a flared disk (lower and upper cones) with a PA of 145° and an inclination of 40° (representative of the HD 100546 disk), with an opening angle of 20° (left), 35° (middle), and 50° (right). The contours are in units of a single spectral resolution element (0.21 km s-1). |
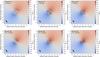 |
Fig. A.3 Model first moment maps for a warped disk with an outer disk PA of 145°, an inclination of 36°, and an opening angle of 9°. The top row of models have an inner warp with a fixed PA of 55° and an inclination of 25° (left), 50° (middle), and 75°. The bottom row of models have an inner warp with a fixed inclination of 80° (representative of that in the HD 100546 disk) and a position angle of 25° (left), 55° (middle), and 85° (right). The transition radius in all models is 100 au. The contours are in units of a single spectral resolution element (0.21 km s-1). |
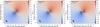 |
Fig. A.4 Model first moment maps for a disk with an outer disk PA of 145°, an inclination of 36°, and an opening angle of 9° and which has a radial flow component to the gas velocity with a scaling factor for the radial flow χ, of 0.2 (left), 0.5 (middle), and 0.8 (right). The transition radius in all models is 100 au. The contours are in units of a single spectral resolution element (0.21 km s-1). |
All Tables
All Figures
|
Fig. 1 Channel maps of the CO J = 3−2 line emission imaged at a velocity resolution of 0.15 km s-1. Note that this is slightly over-sampled with respect to the native spectral resolution of the data (0.21 km s-1). The dashed lines represent the disk major and minor axes determined from analysis of the continuum (Walsh et al. 2014). |
| In the text | |
|
Fig. 2 Channel maps of the CO J = 3−2 line emission rotated in the counter-clockwise direction by 34° to align the disk major axis in the vertical direction, and mirrored across the disk minor axis to highlight the asymmetry in emission across the disk minor axis (now orientated in the horizontal direction). |
| In the text | |
|
Fig. 3 Moment maps for CO J = 3−2 line emission from HD 100546. Clockwise from top left: zeroth moment map (integrated intensity, Jy beam-1 km s-1), first moment map (intensity-weighted velocity, km s-1), eighth moment map (peak intensity, Jy beam-1), and second moment map (intensity-weighted velocity dispersion, km s-1). The dashed contour in the second and eighth moment maps corresponds to the 3σ contour of the integrated intensity. |
| In the text | |
|
Fig. 4 Distribution of model best-fit values using metric (i) as a function of inclination and position angle for the best-fit flat disk, flared disk (lower cone), and flared disk (upper cone), respectively. The best-fit opening angles, α, of the flared disks (with respect to the disk midplane) are 13° and 9° for the lower and upper cones, respectively. The percentage scale corresponds to the full range of pixel values (from 0 to 2652). |
| In the text | |
|
Fig. 5 Residual histograms (top) and maps (bottom) using metric (i) as the measure of best fit for a geometrically flat disk (left), and the lower cone (middle) and upper cone (right) of a flared disk. The histograms are displayed on a log scale to emphasise the largest residuals. |
| In the text | |
|
Fig. 6 Residual histograms (top) and maps (bottom) for a geometrically flat, rotating disk, using metrics (ii) and (iii) as the measure of best fit. The histograms are displayed on a log scale to emphasise the largest residuals. |
| In the text | |
|
Fig. 7 Distribution of model best-fit values using metric (i) for the best-fit warped disk (left) and radial flow model (right). The best-fit transition radius for the warped disk and using this metric is 90 au. The pixel count for the warped disk is given as a function of inclination and position angle whereas that for the radial flow model is given as a function of transition radius and radial velocity scaling factor, χ. In these plots, the percentage scale corresponds to the z-axis range. |
| In the text | |
|
Fig. 8 Residual histograms (top) and maps (bottom) for a protoplanetary disk with a warped inner disk using metrics (i) and (ii) as the metric of best fit. The histograms are displayed on a log scale to emphasise the largest residuals. Note that metrics (ii) and (iii) select the same warped inner disk parameters (see Table 2). |
| In the text | |
|
Fig. 9 Cartoon of the HD 100546 protoplanetary disk. The colour scale indicates the z coordinate of the inner and outer disks relative to the sky plane (z = 0). Note that the morphology of the intermediate region between the inner and outer disks is not yet known and so it is intentionally left blank. |
| In the text | |
|
Fig. 10 Residual histograms (top) and maps (bottom) for a protoplanetary disk with a radial velocity component for each metric of best fit. The histograms are displayed on a log scale to emphasise the largest residuals. |
| In the text | |
|
Fig. 11 CO J = 3−2 line profile extracted from within the 3σ contour of the integrated intensity (see Fig. 3). The bottom panel shows the residual line profile highlighting the asymmetry in the red and blue peaks. |
| In the text | |
|
Fig. A.1 Model first moment maps for a geometrically flat disk with a PA of 145° (representative of the HD 100546 disk) at an inclination of 30° (left), 45° (middle), and 60° (right). The contours are in units of a single spectral resolution element (0.21 km s-1). |
| In the text | |
|
Fig. A.2 Model first moment maps for a flared disk (lower and upper cones) with a PA of 145° and an inclination of 40° (representative of the HD 100546 disk), with an opening angle of 20° (left), 35° (middle), and 50° (right). The contours are in units of a single spectral resolution element (0.21 km s-1). |
| In the text | |
|
Fig. A.3 Model first moment maps for a warped disk with an outer disk PA of 145°, an inclination of 36°, and an opening angle of 9°. The top row of models have an inner warp with a fixed PA of 55° and an inclination of 25° (left), 50° (middle), and 75°. The bottom row of models have an inner warp with a fixed inclination of 80° (representative of that in the HD 100546 disk) and a position angle of 25° (left), 55° (middle), and 85° (right). The transition radius in all models is 100 au. The contours are in units of a single spectral resolution element (0.21 km s-1). |
| In the text | |
|
Fig. A.4 Model first moment maps for a disk with an outer disk PA of 145°, an inclination of 36°, and an opening angle of 9° and which has a radial flow component to the gas velocity with a scaling factor for the radial flow χ, of 0.2 (left), 0.5 (middle), and 0.8 (right). The transition radius in all models is 100 au. The contours are in units of a single spectral resolution element (0.21 km s-1). |
| In the text | |
Current usage metrics show cumulative count of Article Views (full-text article views including HTML views, PDF and ePub downloads, according to the available data) and Abstracts Views on Vision4Press platform.
Data correspond to usage on the plateform after 2015. The current usage metrics is available 48-96 hours after online publication and is updated daily on week days.
Initial download of the metrics may take a while.