Free Access
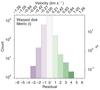
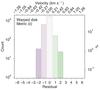
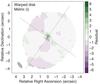
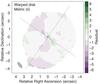
Fig. 8
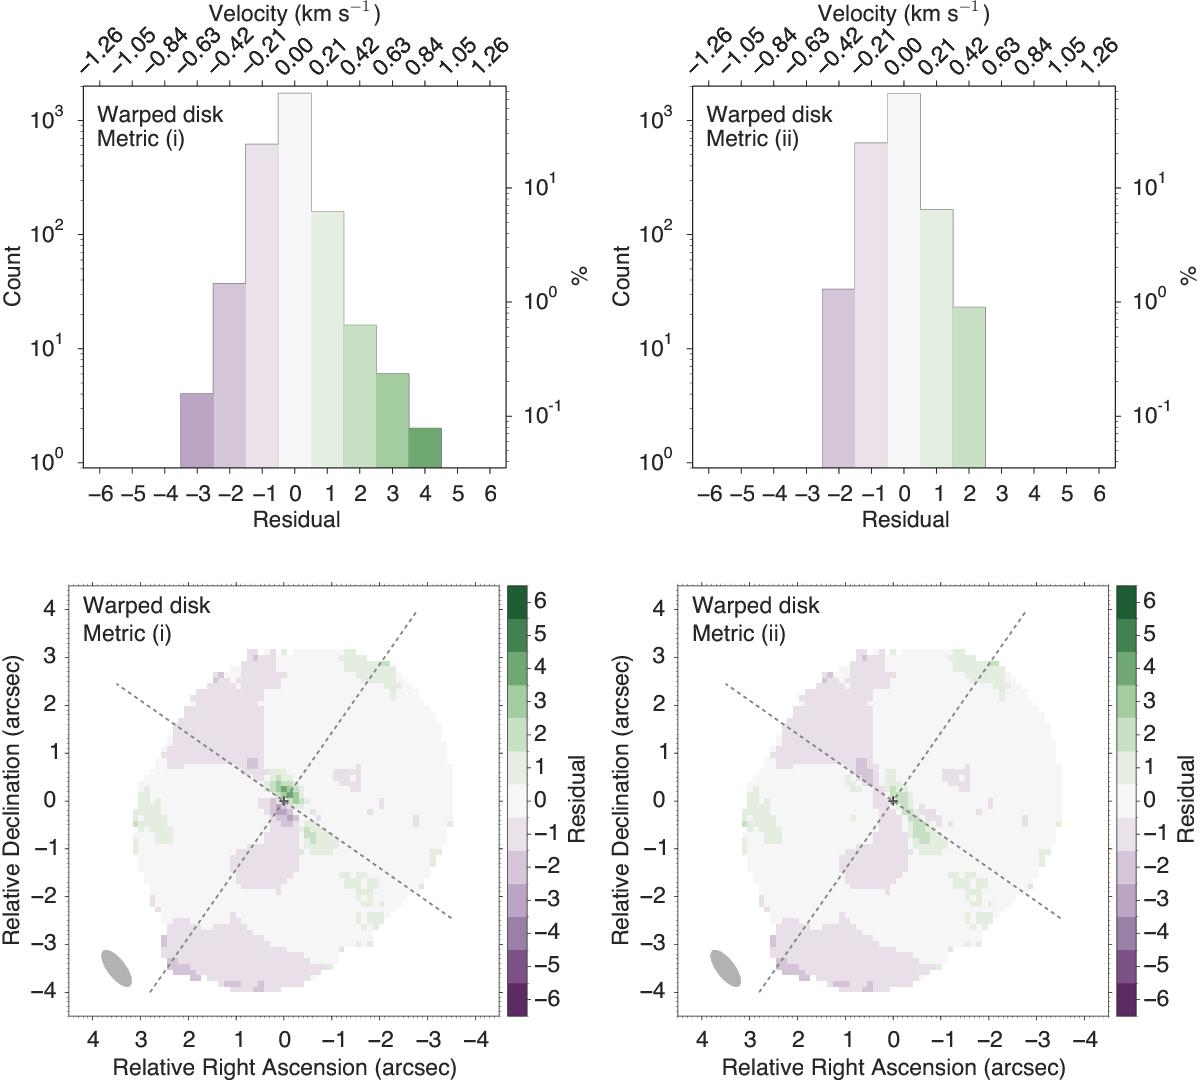
Residual histograms (top) and maps (bottom) for a protoplanetary disk with a warped inner disk using metrics (i) and (ii) as the metric of best fit. The histograms are displayed on a log scale to emphasise the largest residuals. Note that metrics (ii) and (iii) select the same warped inner disk parameters (see Table 2).
This figure is made of several images, please see below:
Current usage metrics show cumulative count of Article Views (full-text article views including HTML views, PDF and ePub downloads, according to the available data) and Abstracts Views on Vision4Press platform.
Data correspond to usage on the plateform after 2015. The current usage metrics is available 48-96 hours after online publication and is updated daily on week days.
Initial download of the metrics may take a while.