| Issue |
A&A
Volume 603, July 2017
|
|
|---|---|---|
| Article Number | A77 | |
| Number of page(s) | 10 | |
| Section | Stellar structure and evolution | |
| DOI | https://doi.org/10.1051/0004-6361/201730718 | |
| Published online | 10 July 2017 | |
Simultaneous 183 GHz H2O maser and SiO observations towards evolved stars using APEX SEPIA Band 5
1 European Southern Observatory (ESO), Karl-Schwarzschild-Str. 2, 85748 Garching bei Munchen, Germany
e-mail: ehumphre@eso.org
2 Jodrell Bank Centre for Astrophysics, School of Physics and Astronomy, University of Manchester, Manchester M13 9PL, UK
3 Department of Earth and Space Sciences, Chalmers University of Technology, Onsala Space Observatory, 439 92 Onsala, Sweden
4 Laboratoire d’astrophysique de Bordeaux, Univ. Bordeaux, CNRS, B18N, allée Geoffroy Saint-Hilaire, 33615 Pessac, France
5 Hamburger Sternwarte, Universität Hamburg, 21029 Hamburg, Germany
Received: 1 March 2017
Accepted: 6 April 2017
Aims. The aim is to investigate the use of 183 GHz H2O masers for characterization of the physical conditions and mass loss process in the circumstellar envelopes of evolved stars.
Methods. We used APEX SEPIA Band 5 (an ALMA Band 5 receiver on the APEX telescope) to observe the 183 GHz H2O line towards two red supergiant (RSG) and three asymptotic giant branch (AGB) stars. Simultaneously, we observed the J = 4−3 line for 28SiO v = 0, 1, 2 and 3, and for 29SiO v = 0 and 1. We compared the results with simulations and radiative transfer models for H2O and SiO, and examined data for the individual linear orthogonal polarizations.
Results. We detected the 183 GHz H2O line towards all the stars with peak flux densities >100 Jy, including a new detection from VY CMa. Towards all five targets, the water line had indications of being caused by maser emission and had higher peak flux densities than for the SiO lines. The SiO lines appear to originate from both thermal and maser processes. Comparison with simulations and models indicate that 183 GHz maser emission is likely to extend to greater radii in the circumstellar envelopes than SiO maser emission and to similar or greater radii than water masers at 22, 321 and 325 GHz. We speculate that a prominent blue-shifted feature in the W Hya 183 GHz spectrum is amplifying the stellar continuum, and is located at a similar distance from the star as mainline OH maser emission. We note that the coupling of an SiO maser model to a hydrodynamical pulsating model of an AGB star yields qualitatively similar simulated results to the observations. From a comparison of the individual polarizations, we find that the SiO maser linear polarization fraction of several features exceeds the maximum fraction allowed under standard maser assumptions and requires strong anisotropic pumping of the maser transition and strongly saturated maser emission. The low polarization fraction of the H2O maser however, fits with the expectation for a non-saturated maser.
Conclusions. 183 GHz H2O masers can provide strong probes of the mass loss process of evolved stars. Higher angular resolution observations of this line using ALMA Band 5 will enable detailed investigation of the emission location in circumstellar envelopes and can also provide information on magnetic field strength and structure.
Key words: stars: AGB and post-AGB / supergiants / masers
© ESO, 2017
1. Introduction
Understanding the mass loss mechanism of asymptotic giant branch (AGB) and red supergiant (RSG) stars is necessary to determine the formation processes of planetary nebulae and core-collapse supernovae (e.g., Herwig 2005; Smith 2014). In addition, the substantial mass loss of cool evolved stars makes significant contributions to dust and molecular return to the interstellar medium and, thereby, the chemical evolution of galaxies (e.g., Javadi et al. 2016).
One set of probes to help understand evolved star mass loss is provided by the circumstellar masers, which are commonly present. In oxygen-rich evolved stars, SiO masers typically form within several stellar radii (~2−5 R∗). They trace both infall and outflow, which are apparently associated with stellar pulsation, plus complex motions (e.g., Assaf et al. 2011; Gonidakis et al. 2013). 22 GHz H2O masers and 1665/7 MHz OH masers form at larger radii in the circumstellar envelope (CSE). They trace acceleration of the wind in the dust formation zone, at approximate distances 10−100 R∗ (e.g., Bains et al. 2003; Richards et al. 2012). Finally, 1612 MHz OH masers are observed at even larger radii, in the steadily outflowing wind at several hundred to 1000 R∗ (Etoka & Diamond 2004; Gray 2012). The masers can thus provide information on the physical conditions for a range of zones in the CSE, as well as tracing dynamics and magnetic field strength and morphology via the Zeeman effect (Vlemmings 2014). Masers from SiO and H2O transitions occur throughout the APEX and ALMA bands (e.g., Humphreys 2007; Gray 2012). Richards et al. (2014) map for the first time water maser emission at 321, 325, and 658 GHz towards an evolved star, VY CMa, using ALMA.
Line list.
During science verification of the SEPIA1 Band 5 receiver on APEX (an ALMA Band 5 receiver; Billade et al. 2012; Immer et al. 2016), we observed the 183 GHz H2O line toward a small sample of stars, simultaneously with a number of SiO J = 4−3 lines. Gonzalez-Alfonso et al. (1998, hereafter GA98) previously observed the 183 GHz line towards a sample of 23 stars using the IRAM 30-m. GA98 established that the 183 GHz line is not very variable in comparison with the 22 GHz H2O masers, and can be very strong with line peaks of up to 450 Jy. GA98 also found that the single-dish line profile of the 183 GHz maser differs as a function of stellar mass loss rate, as has also been observed for some 22 GHz H2O masers, going from a single-peak at the stellar velocity in stars of lower mass loss rate, to double-peaked lines that bracket the stellar velocity at high mass loss rate (indicative of going from predominantly tangential amplification near to the star to radial maser amplification further from the stars). In this paper, we present the APEX SEPIA observational results and compare them against simulations and models, and make predictions for ALMA Band 5 observations.
Stellar sample.
2. Observations
The observations were made during APEX SEPIA Band 5 Science Verification under programme codes ESO 095.F-9806(A) and Onsala 095.F-9400(A). U Her and W Hya were observed between 21 to 22 May 2015. VY CMa, VX Sgr, and R Aql were observed between July 13 to 16 2015. SEPIA Band 5 is a dual polarization sideband-separating (2SB) receiver (Belitsky et al., in prep.). It was tuned to 183.9 GHz at the centre of the upper sideband (USB) such that the frequency coverage of the observations was 181.9 to 185.9 GHz (USB) and 169.9 to 173.9 GHz in the lower sideband (LSB; Fig. 1). The frequency coverage of 4 GHz in each sideband is achieved by using two overlapping 2.5 GHz sub-bands. The observations were made in position-switching mode. The half-power beam width (HPBW) at 183.3 GHz is 31.8′′. The targets were observed for times ranging from 6 to 40 min. The precipitable water vapour during the observations varied between 0.25 and 0.64 mm.
Standard calibrations were made at the observatory. For the observations made in May, the majority of the data were taken with an internal cold load that leads to a higher receiver temperature by a factor of two than the observations made in July, which used an external, facility calibration unit. This affected steps in the subsequent calibration. For this reason the fluxscale of the observations made towards U Her and W Hya should not be trusted. However line ratios of the SiO lines can still be used. We estimate the fluxscale is uncertain by up to a factor of two for the July 2015 observations of VY CMa, VX Sgr, and R Aql.
The observatory delivered data with an online standard opacity correction. This uses one atmospheric opacity value across a 2.5 GHz sub-band and it works well when the opacity is reasonably flat. However, in the case of observations near to the 183.3 GHz water line it is better to perform an offline recalibration using opacity values obtained on the resolution of the atmospheric model used (ATM, Pardo et al. 2001). The APEX offline recalibration yields opacity values determined in chunks of 128 channels. Comparison between the spectra obtained using online and offline calibrated data indicates the online calibration underestimates the emission around 183 GHz significantly (Immer et al. 2016), e.g. for VY CMa by 48% (Fig. 2). In this paper, we use offline recalibrated data throughout.
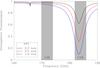 |
Fig. 1 Zenith atmospheric transmission for precipitable water vapour (pwv) values of 0.2, 0.5, and 1 mm at Llano de Chajnantor. Values are plotted from the Atmospheric Transmission at Microwaves (ATM) model (Pardo et al. 2001). Frequency coverage of the observations is shaded in grey for the sidebands. Each sideband consists of 4 GHz continuous frequency coverage. The rest frequency of the 313–220 H2O line is 183.310 GHz. |
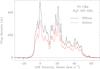 |
Fig. 2 Comparison of the spectra obtained using offline and online opacity calibration for the 183 GHz H2O line towards VY CMa, plotted at 0.5 km s-1 resolution. Use of the offline opacity correction increases peak flux density of the 183 GHz water line in VY CMa by 48%, where atmospheric transmission varies significantly across the sub-bands making up the USB. It makes little difference to the SiO lines that are in a region of flatter atmospheric transmission in the LSB, as expected. Throughout this paper values and figures from the offline calibration are used. |
Further analysis was performed in CLASS2 and included baseline subtraction of polynomial order 1 for individual scans and spectral smoothing. The native channel widths of the observations ranged from 0.06 km s-1 in the LSB to 0.13 km s-1 in the USB. The data were smoothed to velocity resolutions between 0.13 km s-1 to 1 km s-1. For the intensity scale a preliminary conversion factor of 34 Jy/K was used across all frequencies. The spectra were checked for ghosts (sideband leakage) from the other sideband (Sect. 2).
The line frequencies of H2O and SiO transitions in the frequency range of the observations are given in Table 1. The characteristics of the stellar sample, including both AGB and RSG stars, are in Table 2. The approximate optical stellar phases for the AGB stars at the time of observation are φ ~ 0.8 for R Aql and W Hya, and φ ~ 0.1 for U Her, determined using data from the American Association of Variable Star Observers (AAVSO).
With the tuning that we used, it became clear during data reduction that the water line at 183.310 GHz and the 28SiO v = 1J = 4−3 could contaminate each other owing to sideband leakage. Billade et al. (2012) measured the sideband rejection of the receiver to be >10 dB over 90% of the band, and >7 dB over 99%, with an 18.5 dB average. From our observations of R Aql, where the ghost appearing in the LSB from the H2O line (νobs = 183.281 GHz) in the USB is isolated in velocity, we can measure a 17.7 dB rejection or leakage at the 2% level, in good agreement with the receiver characterization. This value should not be assumed to hold over all the observations however. In Figs. 3 to 5, we have indicated the velocity ranges that could be affected by sideband leakage for each target in grey.
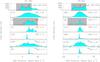 |
Fig. 3 VY CMa and VX Sgr observations using APEX SEPIA Band 5. All of the SiO lines originate from the J = 4−3 transition. The arrow in the upper panel marks the stellar systemic velocity. Boxes shaded grey indicate the velocity ranges that can be contaminated by sideband leakage (Sect. 2), with dashed vertical lines indicating the velocity to which peak(s) of emission from the other sideband would ghost, i.e., the dashed lines in the SiO v = 1 panels indicate the velocities at which peaks from the H2O spectrum could create ghosts. The dashed lines in the H2O panels indicate the velocities at which peaks from the SiO v = 1J = 4−3 spectrum could create ghosts. |
Observational results
3. H2O emission
The H2O and SiO spectra are displayed in Figs. 3 to 5, and the observational results are summarized in Table 3. Towards all stars, the 183 GHz H2O line is detected and displays narrow peaks, which suggest maser action. The velocity extent of the line is similar in each target to the SiO lines that appear to be dominated by thermal emission, i.e., the 28SiO and 29SiO v = 0 lines. The 183 GHz line in VY CMa is a new detection, whereas GA98 detected the 183 GHz line towards the other four targets in our sample at more than one epoch. Note that narrow features in the spectra can have FWHM < 1 km s-1, e.g., the blue-shifted peak of 183 GHz emission towards W Hya, underscoring the importance of observing evolved star masers at high spectral resolution. We find that the 183 GHz spectra have blue-shifted peaks and peaks near the stellar velocity, but no corresponding red-shifted peak of similar flux density except in the case of VX Sgr.
3.1. Comparison with previous evolved star observations at 183 GHz
GA98 made a study of 23 stars using the IRAM 30-m. They found that, for some objects, the lineshapes at 183 GHz are dominated by a single peak near to the stellar velocity. This is indicative of tangential maser amplification close to the star (Group I in GA98). Group I object 183 GHz lines were considerably narrower than corresponding CO (2-1) lines and are associated with objects having mass loss rates <10-6 M⊙ yr-1. R Aql was found to be part of Group I3. Group II of GA98 consisted of objects similar in mass loss rate to Group I, but where the bulk of the emission was blue-shifted relative to the stellar velocity. However the blue-shifted emission was not close to the terminal velocity of the envelope and no corresponding red-shifted peak of similar flux density was observed. W Hya and U Her were found to be in Group II. Finally, Group III of GA98 consisted of objects where the peak emission is shifted to velocities close to the terminal velocity for the envelope, and there are both red and blue-shifted peaks almost symmetric about the stellar velocity. Usually these stars have mass-loss rates higher than 10-6 M⊙ yr-1. VX Sgr was found to be in Group III. The observations here are in agreement with these findings, which suggest that 183 GHz maser emission occurs further from the star as the mass loss rate increases. However VY CMa, with the largest mass loss rate, would not fit the criteria for a Group III object since it does not display a distinct red-shifted peak. The blue-shifted peak does occur close to the terminal velocity for this object, however, which is at about 35 km s-1 (Decin et al. 2016). We speculate that the terminal velocity for VY CMa is therefore reached relatively close to the star. Although, in principle, it would also possible to draw some conclusions on the variability of the 183 GHz line detected towards VX Sgr, W Hya, U Her, and R Aql, by comparing with the observations of GA98, in practice this is difficult owing to the uncertainty in the fluxscales.
3.2. Location of 183 GHz H2O emission in the CSE and physical conditions
We do not have simultaneous observation of other water maser transitions towards the targets, which are needed to make a detailed line profile comparison between frequencies and constrain line ratios for radiative transfer modelling. However, it is possible that the line width of 183 GHz circumstellar water masers is fairly invariant over time. Comparison of line widths between observations with different sensitivities is difficult to perform. However, taking into account the higher sensitivity of GA98, we find that the 183 GHz linewidths for VX Sgr, W Hya, U Her, and R Aql are different by 13%, 6%, 8%, and 37%, respectively from those found in this paper. With this caveat in mind, we go on to compare the line widths at 183 GHz, which are observed here with those from observations of 22, 321, and 325 GHz water masers by Yates et al. (1995).
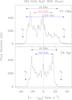 |
Fig. 6 183 GHz H2O observations for the RSG stars. Horizontal arrows indicate the velocity extent of 22 GHz (black), 321 GHz (red), and 325 GHz (blue) emission measured by Yates et al. (1995). Note that the 1σ rms sensitivity of the observations by Yates et al. (1995) could be up to 14.2 Jy (in 0.33 km s-1), so that this should be taken into account when comparing the linewidths. Vertical black arrows indicate the terminal velocity, vt, estimated for the envelope using low-J CO. For VY CMa, vt ~ 35 km s-1 (Decin et al. 2016) and for VX Sgr vt = 30 km s-1 (GA98). |
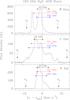 |
Fig. 7 183 GHz H2O observations for the AGB stars. Arrows are as for Fig. 6. For W Hya vt = 8.2 km s-1, for U Her vt = 13.1 km s-1 and for R Aql vt = 8.7 km s-1 (GA98). |
Figures 6 and 7 display the 183 GHz water maser emission we observed towards RSG and AGB stars, with the line widths for 22, 321, and 325 GHz water masers found by Yates et al. (1995) also indicated. Using linewidth as a proxy for spatial extent in the CSE, which is valid for emission dominated by regions extending further than about 5 R∗ (inside this region shock fronts could lead to high velocity emission that is actually close to the star e.g., Herpin et al. 1998), it appears that the 183 GHz water maser is at least as extended spatially as these other water masers, and can be more extended.
The discussion of the 183 GHz spectra above supports the predictions of Humphreys et al. (2001), who used a hydrodynamical pulsating circumstellar envelope model, coupled to an LVG maser radiative transfer model, to calculate synthetic spectra and maps of 22, 321, 325, and 183 GHz masers for a 1 M⊙ AGB star. The 183 GHz spectra of AGB stars in this paper are in reasonable agreement with the velocity extent of the synthetic spectrum, which originated from significant 183 GHz maser emission that occurred relatively far out in the model CSE (20 R∗). In addition, Gray et al. (2016) have performed ALI calculations for water maser emission for a grid of parameter space that is appropriate for evolved stars and also finds that 183 GHz masers are pumped over a broad range of conditions (Fig. 8), such that the masers can trace the inner CSE and the dust formation zone and beyond. Follow-up spatially-resolved observations using ALMA Band 5 are needed to test these predictions.
The greater difference in velocity extents between 183 GHz and 22 GHz masers for AGB stars versus RGB stars is consistent with the high densities required to pump strong 22 GHz water masers (say 108 to 1011 cm-3), which are likely to be confined to a relatively smaller radius in the CSEs of AGB stars than they are in RSG stars. This would be expected considering that AGB mass loss rates are lower. On the other hand, 183 GHz masers towards both AGB and RSG could be pumped out to relatively far in the CSE since they can operate in significantly lower density and temperature conditions. So the velocity extents at 183 GHz towards both types of objects can be relatively broad. We also note that the 22 GHz masers in AGB stars are very variable and the observations were not made at the same time as the 183 GHz observations.
3.3. Relation to OH masers and amplification of the stellar continuum
In Fig. 4, W Hya displays a peak near the stellar velocity and a more blue-shifted, narrow feature at 35.5 ± 0.1 km s-1. The full-width half-maximum (FWHM) of the blue-shifted feature is <1 km s-1, consistent with it arising from a single maser cloud. Its velocity is in good agreement with the velocity of the narrow peak in the OH 1667 MHz maser spectrum towards this target at 35.6 km s-1 (Etoka et al. 2001; Vlemmings et al. 2003).
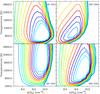 |
Fig. 8 Physical conditions giving rise to circumstellar 183 GHz H2O maser emission from Gray et al. (2016). Numbers on the contours mark the calculated maser negative optical depth. Strongest 183 GHz H2O maser emission occurs at a lower density by an order of magnitude than strongest 22 H2O GHz emission. |
This suggests that the blue-shifted feature in the 183 GHz H2O maser spectrum could arise from gas at the same distance in the CSE as that leading to the corresponding OH 1667 MHz emission peak. The emission from water and OH would not need to arise from the same volumes of gas, if the CSE is clumpy on appropriate spatial scales. Indeed this is the explanation for how water masers at 22 GHz and mainline OH masers can exist at similar radii despite requiring different collision partner densities by, say, a factor of 10 or more (Richards et al. 1999, 2012).
However, we note that the situation may be different for the 183 GHz water maser emission. The physical conditions that lead to strong OH maser 1667 MHz emission in Miras are Tk ~ 100 K, dust temperature Td ~ 350–450 K and n(H2) = 105 cm-3 (Nguyen-Q-Rieu et al. 1979; Bujarrabal et al. 1980). This parameter space for pumping water maser emission at 183 GHz is explored by González-Alfonso & Cernicharo (1999), at least in terms of gas kinetic temperature and density. González-Alfonso & Cernicharo (1999) indicated that water maser emission at 183 GHz can result from similar temperatures and densities as those needed to produce 1667 MHz OH masers. While 183 GHz water maser emission can also originate from the higher density conditions needed to produce 22 GHz emission (Fig. 8, González-Alfonso & Cernicharo 1999; Humphreys et al. 2001; Gray et al. 2016). Therefore it may be possible for 183 GHz emission to be arising both from the high- and low-density gas, as long as sufficient H2O abundance remains in the low density gas and has not been photodissociated by the interstellar radiation field.
VLBA observations by Vlemmings et al. (2003) suggest that the 35.6 km s-1 feature in the 1667 MHz maser spectrum is located along the line of sight to the stellar disc and could be amplifying the stellar continuum. We speculate that this is also the case for the 183 GHz water maser feature at the same velocity. If so, we would expect it to vary following the stellar pulsation cycle as the star brightens and dims. Single-dish monitoring could investigate if this is the case.
4. SiO emission
The J = 4−3 SiO lines are similar in velocity extent and complexity to those previously observed at multiple frequencies (e.g., Humphreys et al. 1997; Pardo et al. 1998; Gray et al. 1999). The 28SiO v = 0 line appears to be dominated by thermal emission for each target, whereas the 29SiO v = 0 looks to be a mixture of both thermal and maser action. Towards VY CMa, the highest mass-loss rate object, this results in a narrow maser feature superposed on a broad emission plateau. For emission from the v = 1, 2, 3 28SiO and the v = 129SiO then lineshapes are characteristic of maser emission, and the total velocity extent of the lines is narrower than those from the v = 0 states. The only non-detections are for the 28SiO and 29SiO v = 1J = 4−3 lines towards R Aql. All the SiO lines are weaker than the 183 GHz water emission observed towards the same object.
Gray et al. (2009) coupled a large velocity gradient (LVG) 28SiO maser radiative transfer code to hydrodynamical models of the CSE by Ireland et al. (2004a,b), to predict SiO maser spectra and maps at different epochs of the stellar pulsation cycle. In an update to this work, Gray et al. (in prep.) have replaced the LVG code with accelerated lambda iteration (ALI) SiO radiative transfer. The ALI code performs calculations for 28SiO, 29SiO, and 30SiO isotopologues, and includes line overlap between these species. It can handle both thermal and maser emission. The stellar models used with the ALI code are the cool opacity-sampling dynamic extended (CODEX) atmosphere (up to ~5 R∗) models of Ireland et al. (2008, 2011), specifically the “o54” series. These are intended to describe a star like o Ceti with a period of 330 days.
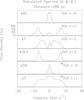 |
Fig. 9 Simulated SiO J = 4−3 spectra from an AGB star at φ = 0.1 and a distance of 266 pc for comparison with the U Her observations. |
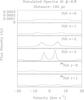 |
Fig. 10 Simulated SiO J = 4−3 spectra from an AGB star at φ = 0.8 and a distance of 104 pc for comparison with the W Hya observations. R Aql, at a distance of 422 pc, was also observed at around φ = 0.8. |
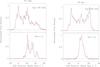 |
Fig. 11 VY CMa and VX Sgr individual polarizations (solid black and red dotted lines) for the 183 GHz water line and the v = 2J = 4−3 SiO line. For the purposes of this illustration, each polarization has been normalised to its peak flux density. |
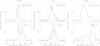 |
Fig. 12 W Hya, U Her and R Aql individual polarizations (solid black and red dotted lines) for the 183 GHz water line and the v = 2J = 4−3 SiO line. |
Although the models cannot be used to make a detailed comparison with these observations, since we did not observe o Ceti, Fig. 9 shows the results of the simulations at φ = 0.1 shifted to a distance of 266 pc, i.e., suitable for comparison with the U Her results. Figure 10 shows the simulated spectra for φ = 0.8 to compare with W Hya and R Aql. The synthetic spectra broadly reproduce the complexity and linewidths of the maser lines, although we note that the v = 3J = 4−3 is emission is significantly weaker than observed at φ = 0.1 and the higher peak intensity of the v = 2J = 4−3 emission than that of the v = 1 is also not found in the simulations. At φ = 0.8 the simulated SiO spectra are extremely weak. This does not compare well with the observations of W Hya but, for R Aql, the observed SiO spectra are indeed relatively weak, with non-detections of both 28SiO and 29SiO v = 1J = 4−3 emission. We speculate that this indicates R Aql bears more similarity to o Ceti than W Hya.
The simulated thermal lines (v = 0) in Figs. 9 and 10 are not similar to the observed ones. This is probably due to the fact the model for the inner CSE we use only goes out to 5 R∗. Although the gas phase SiO likely depletes around this radius, owing to dust formation, a significant amount of SiO will be present in the gas phase further out. For example Lucas et al. (1992) imaged SiO v = 0J = 2–1 emission towards a number of AGB stars using the Plateau de Bure Interferometer. The diameter of the thermal SiO emission towards W Hya was 0.9 ± 0.1 arcseconds, or about 95 AU. Since the stellar radius is W Hya is about 2 AU (Ohnaka et al. 2016), there is significant gas phase SiO out to about 45 R∗. For M- and S-type stars, González Delgado et al. (2003) and Ramstedt et al. (2009) find e-folding radii for the SiO of 100–1000 AU.
Overall the pulsating models of Ireland et al. (2011) appear to be good descriptors of the inner CSE, and the conditions leading to SiO emission are in good agreement with those determined by Herpin & Baudry (2000). Monitoring of the lines and again follow-up observations using ALMA will provide further constraints to this work.
5. Line polarization
The SEPIA Band 5 receiver records dual linear orthogonal polarizations. This enables the study of linear polarization of strong lines. Many masers are strongly linearly polarized (e.g., Pérez-Sánchez & Vlemmings 2013), making them good probes of magnetic fields. Polarization observations of, for example, (sub)millimetre SiO masers have been used to determine the magnetic field morphology around evolved stars (e.g., Vlemmings et al. 2011; Shinnaga et al. 2004), and polarization fractions of several tens of percent are regularly measured. Although the observations presented here were not aimed at detecting the polarization, an inspection of the two orthogonal polarizations independently can already provide a lower limit estimate of the polarization fraction. The difference in flux density between the two polarizations depends on the intrinsic source polarization, the maser polarization angle (potentially different for different velocity channels) and the amount of signal leakage of one polarization into the other. Additionally, as the telescope feed rotates across the sky, with the feed parallactic angle changing with respect to the source polarization direction, the signal in the two polarization channels will change as a function of parallactic angle. Our observations were restricted to a very narrow range of parallactic angle. Consequently, we cannot determine the intrinsic polarization angle, nor the feed leakage, and we thus limit ourselves to presenting the potential of the SEPIA receiver for maser polarization studies.
In Figs. 11 and 12, we show the different polarizations (normalized) for the SiO, v = 2 and H2O lines for our sources observed in July 2015. The H2O maser polarization at 183 GHz is significantly lower than that of the SiO, v = 2 maser. Based on an inspection of the spectra, the SiO maser polarization can reach up to ~30% and is typically in the range of 5−10%, while the H2O polarization is not more than a few percent. The low polarization observed for the H2O masers and the thermal SiO lines shows that the differential leakage between the two SEPIA polarization channels is small (Billade et al. 2012). Although the average SiO maser polarization can be produced under regular, non-saturated, maser assumptions, the observed maximum linear polarization fraction of some of the individual features exceeds the maximum fraction allowed under those assumptions (Pérez-Sánchez & Vlemmings 2013).
This has previously been noted (e.g., Vlemmings et al. 2011) and requires strong anisotropic pumping of the maser transition (Nedoluha & Watson 1994). The low polarization fraction of the H2O maser however, fits with the expectation for a non-saturated maser (Pérez-Sánchez & Vlemmings 2013). Dedicated observations over a large range of parallactic angles will enable us to determine both velocity resolved polarization fraction and linear polarization direction, providing constraints on both the circumstellar magnetic field, as well as the anisotropic radiation field.
6. Summary
We used APEX SEPIA Band 5 science verification data to make a simultaneous study of 183 GHz water and multiple SiO lines towards five evolved stars. Towards each star, we detected 183 GHz water emission with a peak flux density of >100 Jy. Narrow features in the spectra suggest a maser origin for the lines. A comparison with velocity widths of water lines at 22, 321, and 325 GHz suggests that the 183 GHz emission is at least as spatially extended in circumstellar envelopes as these other water maser lines, and may well extend further. This scenario is supported by radiative transfer models that indicate the 183 GHz maser lines can be pumped out to zones of relatively low density and kinetic temperature. Towards W Hya, we detect a narrow, blue-shifted feature at the same velocity as a prominent feature in the 1667 MHz OH maser spectrum that is amplifying the stellar continuum. We speculate that the blue-shifted 183 GHz water maser feature also amplifies the W Hya stellar continuum. For SiO, the lines appear to originate from both thermal and maser action, and sometimes a mixture (e.g., VY CMa 29SiO v = 0J = 4−3). The lines are always weaker than the 183 GHz water maser towards the same object. Typically the v = 1, 2 SiO J = 4−3 lines have the highest peak flux densities, however towards W Hya the v = 3 SiO line is stronger. From a comparison of the individual polarizations, we find that the SiO maser linear polarization fraction of several features exceeds the maximum fraction allowed under standard maser assumptions and requires strong anisotropic pumping of the maser transition and strongly saturated maser emission. The low polarization fraction of the H2O maser, however, fits with the expectation for a non-saturated maser. Understanding the locations of the masers in CSE and detailed polarization studies will require high angular resolution observations using ALMA.
Acknowledgments
We thank APEX staff for carrying out these observations. We acknowledge with thanks the variable star observations from the AAVSO International Database contributed by observers worldwide and used in this research. We thank staff at ESO and at Onsala Space Observatory, Chalmers University for assistance with the data. WV acknowledges support from ERC consolidator grant 614264.
References
- Assaf, K. A., Diamond, P. J., Richards, A. M. S., & Gray, M. D. 2011, MNRAS, 415, 1083 [NASA ADS] [CrossRef] [Google Scholar]
- Bains, I., Cohen, R. J., Louridas, A., et al. 2003, MNRAS, 342, 8 [NASA ADS] [CrossRef] [Google Scholar]
- Billade, B., Nyström, O., Meledin, D., et al. 2012, IEEE Trans. Terahertz Sci. Technol., 2, 208 [NASA ADS] [CrossRef] [Google Scholar]
- Bujarrabal, V., Guibert, J., Nguyen-Q-Rieu, & Omont, A. 1980, A&A, 84, 311 [NASA ADS] [Google Scholar]
- Chen, X., Shen, Z.-Q., & Xu, Y. 2007, Chinese J. Astron. Astrophys., 7, 531 [Google Scholar]
- Choi, Y. K., Hirota, T., Honma, M., et al. 2008, PASJ, 60, 1007 [NASA ADS] [Google Scholar]
- De Beck, E., Decin, L., de Koter, A., et al. 2010, A&A, 523, A18 [NASA ADS] [CrossRef] [EDP Sciences] [Google Scholar]
- Decin, L., Richards, A. M. S., Millar, T. J., et al. 2016, A&A, 592, A76 [NASA ADS] [CrossRef] [EDP Sciences] [Google Scholar]
- Etoka, S., Błaszkiewicz, L., Szymczak, M., & Le Squeren, A. M. 2001, A&A, 378, 522 [NASA ADS] [CrossRef] [EDP Sciences] [Google Scholar]
- Etoka, S., & Diamond, P. 2004, MNRAS, 348, 34 [NASA ADS] [CrossRef] [Google Scholar]
- Gonidakis, I., Diamond, P. J., & Kemball, A. J. 2013, MNRAS, 433, 3133 [NASA ADS] [CrossRef] [Google Scholar]
- González-Alfonso, E., & Cernicharo, J. 1999, ApJ, 525, 845 [NASA ADS] [CrossRef] [Google Scholar]
- Gonzalez-Alfonso, E., Cernicharo, J., Alcolea, J., & Orlandi, M. A. 1998, A&A, 334, 1016 [NASA ADS] [Google Scholar]
- González Delgado, D., Olofsson, H., Kerschbaum, F., et al. 2003, A&A, 411, 123 [NASA ADS] [CrossRef] [EDP Sciences] [Google Scholar]
- Gray, M. 2012, Maser Sources in Astrophysics (Cambridge, UK: Cambridge University Press) [Google Scholar]
- Gray, M. D., Humphreys, E. M. L., & Yates, J. A. 1999, MNRAS, 304, 906 [NASA ADS] [CrossRef] [Google Scholar]
- Gray, M. D., Wittkowski, M., Scholz, M., et al. 2009, MNRAS, 394, 51 [NASA ADS] [CrossRef] [Google Scholar]
- Gray, M. D., Baudry, A., Richards, A. M. S., et al. 2016, MNRAS, 456, 374 [NASA ADS] [CrossRef] [Google Scholar]
- Herpin, F., & Baudry, A. 2000, A&A, 359, 1117 [NASA ADS] [Google Scholar]
- Herpin, F., Baudry, A., Alcolea, J., & Cernicharo, J. 1998, A&A, 334, 1037 [NASA ADS] [Google Scholar]
- Herwig, F. 2005, ARA&A, 43, 435 [NASA ADS] [CrossRef] [Google Scholar]
- Humphreys, E. M. L. 2007, in Astrophysical Masers and their Environments, eds. J. M. Chapman, & W. A. Baan, IAU Symp., 242, 471 [Google Scholar]
- Humphreys, E. M. L., Gray, M. D., Yates, J. A., & Field, D. 1997, MNRAS, 287, 663 [NASA ADS] [Google Scholar]
- Humphreys, E. M. L., Yates, J. A., Gray, M. D., Field, D., & Bowen, G. H. 2001, A&A, 379, 501 [NASA ADS] [CrossRef] [EDP Sciences] [Google Scholar]
- Immer, K., Belitsky, V., Olberg, M., et al. 2016, The Messenger, 165, 13 [NASA ADS] [Google Scholar]
- Ireland, M. J., Scholz, M., Tuthill, P. G., & Wood, P. R. 2004a, MNRAS, 355, 444 [NASA ADS] [CrossRef] [Google Scholar]
- Ireland, M. J., Scholz, M., & Wood, P. R. 2004b, MNRAS, 352, 318 [NASA ADS] [CrossRef] [Google Scholar]
- Ireland, M. J., Scholz, M., & Wood, P. R. 2008, MNRAS, 391, 1994 [NASA ADS] [CrossRef] [Google Scholar]
- Ireland, M. J., Scholz, M., & Wood, P. R. 2011, MNRAS, 418, 114 [NASA ADS] [CrossRef] [Google Scholar]
- Javadi, A., van Loon, J. T., & Khosroshahi, H. 2016, Mem. Soc. Astron. It., 87, 278 [NASA ADS] [Google Scholar]
- Kiss, L. L., Szabó, G. M., & Bedding, T. R. 2006, MNRAS, 372, 1721 [Google Scholar]
- Lucas, R., Bujarrabal, V., Guilloteau, S., et al. 1992, A&A, 262, 491 [NASA ADS] [Google Scholar]
- Nedoluha, G. E., & Watson, W. D. 1994, ApJ, 423, 394 [NASA ADS] [CrossRef] [Google Scholar]
- Nguyen-Q-Rieu, Laury-Micoulaut, C., Winnberg, A., & Schultz, G. V. 1979, A&A, 75, 351 [NASA ADS] [Google Scholar]
- Ohnaka, K., Weigelt, G., & Hofmann, K.-H. 2016, A&A, 589, A91 [NASA ADS] [CrossRef] [EDP Sciences] [Google Scholar]
- Pardo, J. R., Cernicharo, J., Gonzalez-Alfonso, E., & Bujarrabal, V. 1998, A&A, 329, 219 [NASA ADS] [Google Scholar]
- Pardo, J. R., Cernicharo, J., & Serabyn, E. 2001, IEEE Trans. Antennas Propag., 49, 1683 [Google Scholar]
- Pérez-Sánchez, A. F., & Vlemmings, W. H. T. 2013, A&A, 551, A15 [NASA ADS] [CrossRef] [EDP Sciences] [Google Scholar]
- Ramstedt, S., Schöier, F. L., & Olofsson, H. 2009, A&A, 499, 515 [NASA ADS] [CrossRef] [EDP Sciences] [Google Scholar]
- Richards, A. M. S., Yates, J. A., & Cohen, R. J. 1999, MNRAS, 306, 954 [NASA ADS] [CrossRef] [MathSciNet] [Google Scholar]
- Richards, A. M. S., Etoka, S., Gray, M. D., et al. 2012, A&A, 546, A16 [NASA ADS] [CrossRef] [EDP Sciences] [Google Scholar]
- Richards, A. M. S., Impellizzeri, C. M. V., Humphreys, E. M., et al. 2014, A&A, 572, L9 [Google Scholar]
- Shinnaga, H., Moran, J. M., Young, K. H., & Ho, P. T. P. 2004, ApJ, 616, L47 [NASA ADS] [CrossRef] [Google Scholar]
- Smith, N. 2014, ARA&A, 52, 487 [NASA ADS] [CrossRef] [MathSciNet] [Google Scholar]
- van Leeuwen, F. 2007, A&A, 474, 653 [NASA ADS] [CrossRef] [EDP Sciences] [Google Scholar]
- Vlemmings, W. H. T. 2014, in Magnetic Fields throughout Stellar Evolution, eds. P. Petit, M. Jardine, & H. C. Spruit, IAU Symp., 302, 389 [Google Scholar]
- Vlemmings, W. H. T., & van Langevelde, H. J. 2007, A&A, 472, 547 [NASA ADS] [CrossRef] [EDP Sciences] [Google Scholar]
- Vlemmings, W. H. T., van Langevelde, H. J., Diamond, P. J., Habing, H. J., & Schilizzi, R. T. 2003, A&A, 407, 213 [NASA ADS] [CrossRef] [EDP Sciences] [Google Scholar]
- Vlemmings, W. H. T., Humphreys, E. M. L., & Franco-Hernández, R. 2011, ApJ, 728, 149 [NASA ADS] [CrossRef] [Google Scholar]
- Yates, J. A., Cohen, R. J., & Hills, R. E. 1995, MNRAS, 273, 529 [NASA ADS] [CrossRef] [Google Scholar]
- Zhang, B., Reid, M. J., Menten, K. M., & Zheng, X. W. 2012, ApJ, 744, 23 [NASA ADS] [CrossRef] [Google Scholar]
- Zhao-Geisler, R., Quirrenbach, A., Köhler, R., & Lopez, B. 2012, A&A, 545, A56 [NASA ADS] [CrossRef] [EDP Sciences] [Google Scholar]
All Tables
All Figures
|
Fig. 1 Zenith atmospheric transmission for precipitable water vapour (pwv) values of 0.2, 0.5, and 1 mm at Llano de Chajnantor. Values are plotted from the Atmospheric Transmission at Microwaves (ATM) model (Pardo et al. 2001). Frequency coverage of the observations is shaded in grey for the sidebands. Each sideband consists of 4 GHz continuous frequency coverage. The rest frequency of the 313–220 H2O line is 183.310 GHz. |
| In the text | |
|
Fig. 2 Comparison of the spectra obtained using offline and online opacity calibration for the 183 GHz H2O line towards VY CMa, plotted at 0.5 km s-1 resolution. Use of the offline opacity correction increases peak flux density of the 183 GHz water line in VY CMa by 48%, where atmospheric transmission varies significantly across the sub-bands making up the USB. It makes little difference to the SiO lines that are in a region of flatter atmospheric transmission in the LSB, as expected. Throughout this paper values and figures from the offline calibration are used. |
| In the text | |
|
Fig. 3 VY CMa and VX Sgr observations using APEX SEPIA Band 5. All of the SiO lines originate from the J = 4−3 transition. The arrow in the upper panel marks the stellar systemic velocity. Boxes shaded grey indicate the velocity ranges that can be contaminated by sideband leakage (Sect. 2), with dashed vertical lines indicating the velocity to which peak(s) of emission from the other sideband would ghost, i.e., the dashed lines in the SiO v = 1 panels indicate the velocities at which peaks from the H2O spectrum could create ghosts. The dashed lines in the H2O panels indicate the velocities at which peaks from the SiO v = 1J = 4−3 spectrum could create ghosts. |
| In the text | |
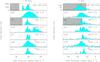 |
Fig. 4 W Hya and U Her observations using APEX SEPIA Band 5. See caption of Fig. 3 for more details. |
| In the text | |
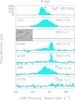 |
Fig. 5 Observations towards R Aql using APEX SEPIA Band 5. See caption of Fig. 3 for more details. |
| In the text | |
|
Fig. 6 183 GHz H2O observations for the RSG stars. Horizontal arrows indicate the velocity extent of 22 GHz (black), 321 GHz (red), and 325 GHz (blue) emission measured by Yates et al. (1995). Note that the 1σ rms sensitivity of the observations by Yates et al. (1995) could be up to 14.2 Jy (in 0.33 km s-1), so that this should be taken into account when comparing the linewidths. Vertical black arrows indicate the terminal velocity, vt, estimated for the envelope using low-J CO. For VY CMa, vt ~ 35 km s-1 (Decin et al. 2016) and for VX Sgr vt = 30 km s-1 (GA98). |
| In the text | |
|
Fig. 7 183 GHz H2O observations for the AGB stars. Arrows are as for Fig. 6. For W Hya vt = 8.2 km s-1, for U Her vt = 13.1 km s-1 and for R Aql vt = 8.7 km s-1 (GA98). |
| In the text | |
|
Fig. 8 Physical conditions giving rise to circumstellar 183 GHz H2O maser emission from Gray et al. (2016). Numbers on the contours mark the calculated maser negative optical depth. Strongest 183 GHz H2O maser emission occurs at a lower density by an order of magnitude than strongest 22 H2O GHz emission. |
| In the text | |
|
Fig. 9 Simulated SiO J = 4−3 spectra from an AGB star at φ = 0.1 and a distance of 266 pc for comparison with the U Her observations. |
| In the text | |
|
Fig. 10 Simulated SiO J = 4−3 spectra from an AGB star at φ = 0.8 and a distance of 104 pc for comparison with the W Hya observations. R Aql, at a distance of 422 pc, was also observed at around φ = 0.8. |
| In the text | |
|
Fig. 11 VY CMa and VX Sgr individual polarizations (solid black and red dotted lines) for the 183 GHz water line and the v = 2J = 4−3 SiO line. For the purposes of this illustration, each polarization has been normalised to its peak flux density. |
| In the text | |
|
Fig. 12 W Hya, U Her and R Aql individual polarizations (solid black and red dotted lines) for the 183 GHz water line and the v = 2J = 4−3 SiO line. |
| In the text | |
Current usage metrics show cumulative count of Article Views (full-text article views including HTML views, PDF and ePub downloads, according to the available data) and Abstracts Views on Vision4Press platform.
Data correspond to usage on the plateform after 2015. The current usage metrics is available 48-96 hours after online publication and is updated daily on week days.
Initial download of the metrics may take a while.