Fig. 3
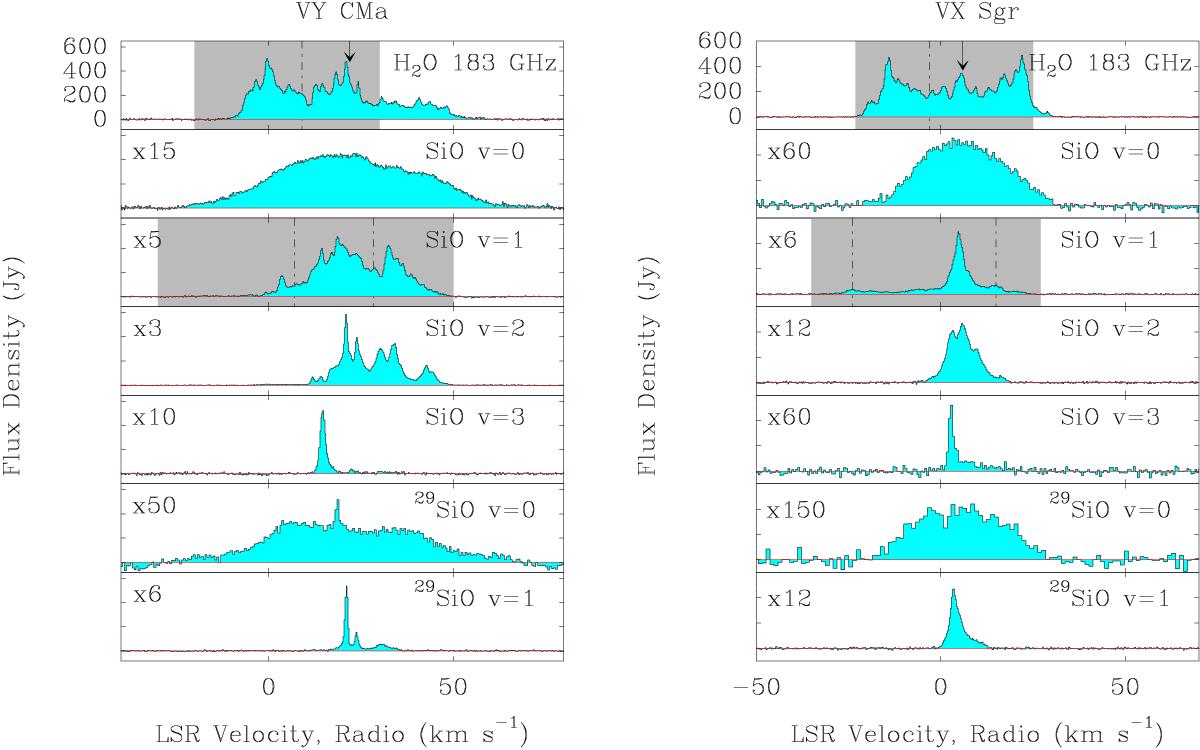
VY CMa and VX Sgr observations using APEX SEPIA Band 5. All of the SiO lines originate from the J = 4−3 transition. The arrow in the upper panel marks the stellar systemic velocity. Boxes shaded grey indicate the velocity ranges that can be contaminated by sideband leakage (Sect. 2), with dashed vertical lines indicating the velocity to which peak(s) of emission from the other sideband would ghost, i.e., the dashed lines in the SiO v = 1 panels indicate the velocities at which peaks from the H2O spectrum could create ghosts. The dashed lines in the H2O panels indicate the velocities at which peaks from the SiO v = 1J = 4−3 spectrum could create ghosts.
Current usage metrics show cumulative count of Article Views (full-text article views including HTML views, PDF and ePub downloads, according to the available data) and Abstracts Views on Vision4Press platform.
Data correspond to usage on the plateform after 2015. The current usage metrics is available 48-96 hours after online publication and is updated daily on week days.
Initial download of the metrics may take a while.