Free Access
Fig. 11
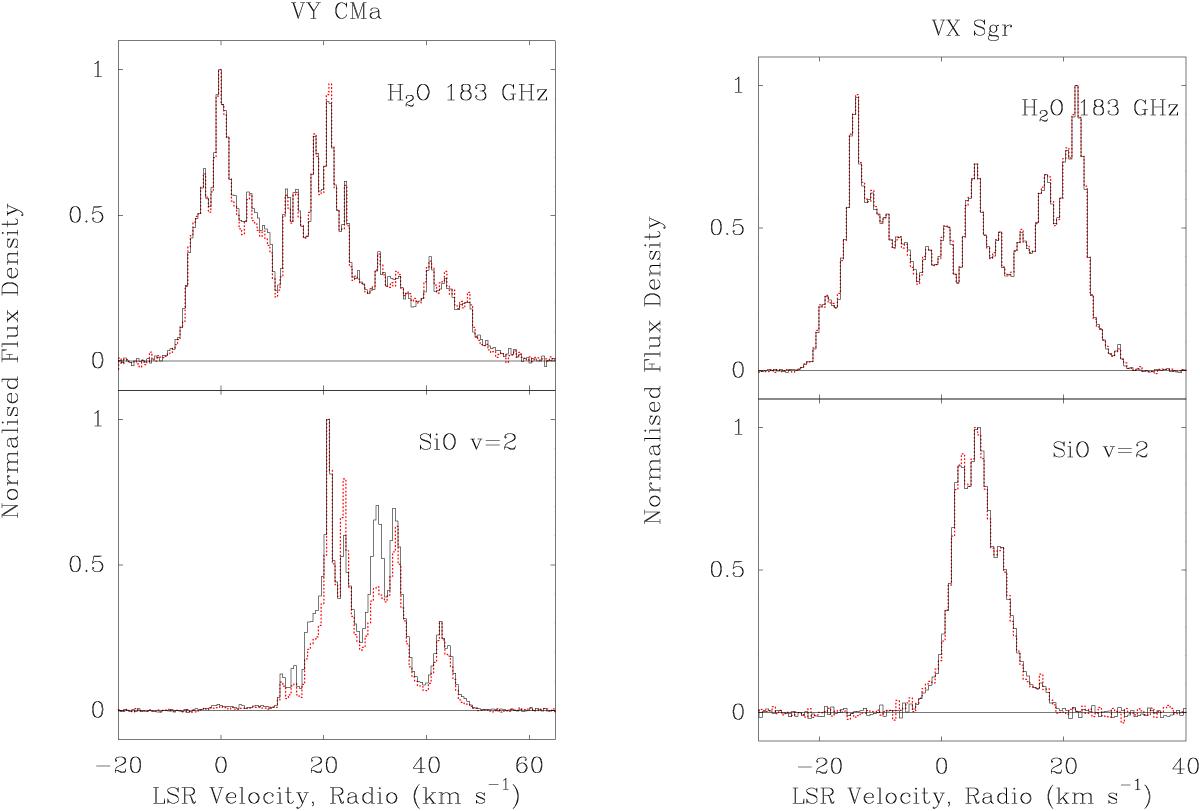
VY CMa and VX Sgr individual polarizations (solid black and red dotted lines) for the 183 GHz water line and the v = 2J = 4−3 SiO line. For the purposes of this illustration, each polarization has been normalised to its peak flux density.
This figure is made of several images, please see below:
Current usage metrics show cumulative count of Article Views (full-text article views including HTML views, PDF and ePub downloads, according to the available data) and Abstracts Views on Vision4Press platform.
Data correspond to usage on the plateform after 2015. The current usage metrics is available 48-96 hours after online publication and is updated daily on week days.
Initial download of the metrics may take a while.