Fig. 3
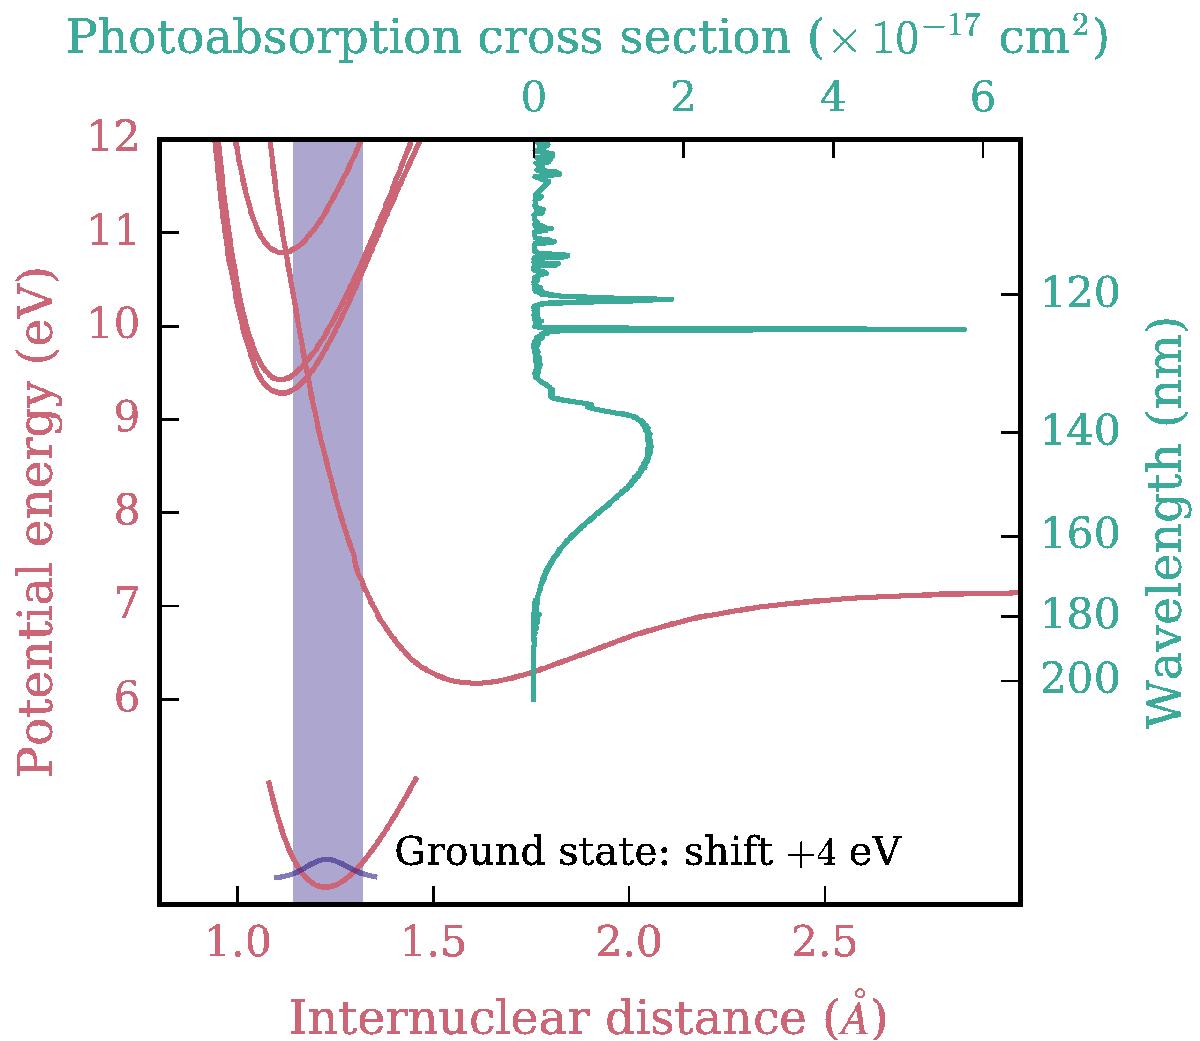
Potential energy curves for the ground and excited state of O2 (red curves) (Guberman 1977; Lewis et al. 1998, 2001), and the O2 photoabsorption section from Sect. 4.3.35 (blue curve). Shown on equivalent energy and wavelength scales. The energy scale is relative to the minimum of the ground-state electronic potential curve, shown here shifted upwards by 4 eV. The shaded area shows the vertical excitation region.
Current usage metrics show cumulative count of Article Views (full-text article views including HTML views, PDF and ePub downloads, according to the available data) and Abstracts Views on Vision4Press platform.
Data correspond to usage on the plateform after 2015. The current usage metrics is available 48-96 hours after online publication and is updated daily on week days.
Initial download of the metrics may take a while.