| Issue |
A&A
Volume 599, March 2017
|
|
|---|---|---|
| Article Number | A37 | |
| Number of page(s) | 16 | |
| Section | Galactic structure, stellar clusters and populations | |
| DOI | https://doi.org/10.1051/0004-6361/201628962 | |
| Published online | 24 February 2017 | |
Globules and pillars in Cygnus X
II. Massive star formation in the globule IRAS 20319+3958 ⋆,⋆⋆
1 Nordic Optical Telescope, Rambla José Ana Fernández Pérez 7, 38711 Breña Baja, Spain
e-mail: This email address is being protected from spambots. You need JavaScript enabled to view it.
2 European Southern Observatory, 3107 Alonso de Córdova, Vitacura, Santiago, Chile
3 KOSMA, I. Physik. Institut, Zülpicher Str. 77, Universität Köln, 50937 Köln, Germany
Received: 17 May 2016
Accepted: 9 November 2016
Abstract
Globules and pillars, impressively revealed by the Spitzer and Herschel satellites, for example, are pervasive features found in regions of massive star formation. Studying their embedded stellar populations can provide an excellent laboratory to test theories of triggered star formation and the features that it may imprint on the stellar aggregates resulting from it. We studied the globule IRAS 20319+3958 in Cygnus X by means of visible and near-infrared imaging and spectroscopy, complemented with mid-infrared Spitzer/IRAC imaging, in order to obtain a census of its stellar content and the nature of its embedded sources. Our observations show that the globule contains an embedded aggregate of about 30 very young (≲1 Myr) stellar objects, for which we estimate a total mass of ~90 M⊙. The most massive members are three systems containing early B-type stars. Two of them most likely produced very compact H II regions, one of them being still highly embedded and coinciding with a peak seen in emission lines characterising the photon dominated region (PDR). Two of these three systems are resolved binaries, and one of those contains a visible Herbig Be star. An approximate derivation of the mass function of the members of the aggregate gives hints of a slope at high masses shallower than the classical Salpeter slope, and a peak of the mass distribution at a mass higher than that at which the widely adopted log-normal initial mass function peaks. The emission distribution of H2 and Brγ, tracing the PDR and the ionised gas phase, respectively, suggests that molecular gas is distributed as a shell around the embedded aggregate, filled with centrally-condensed ionised gas. Both, the morphology and the low excitation of the H II region, indicate that the sources of ionisation are the B stars of the embedded aggregate, rather than the external UV field caused by the O stars of Cygnus OB2. The youth of the embedded cluster, combined with the isolation of the globule, suggests that star formation in the globule was triggered by the passage of the ionisation front.
Key words: ISM: clouds / stars: formation / ISM: individual objects: IRAS 20319+3958 / ISM: individual objects: Cygnus X
Based on observations from the Centro Astronómico Hispano Alemán (CAHA) at Calar Alto, the Nordic Optical Telescope, La Palma, and the IAC80 telescope, Tenerife.
Full Table 3 is only available at the CDS via anonymous ftp to cdsarc.u-strasbg.fr (130.79.128.5) or via http://cdsarc.u-strasbg.fr/viz-bin/qcat?J/A+A/599/A37
© ESO, 2017
1. Introduction
Pillars and globules are probes of the dramatic physical and structural changes produced as a result of the erosion of the neutral gas at the interface between H II-regions and molecular clouds by the ionising radiation from OB-stars. Expanding ionisation fronts encounter pre-existing dense condensations in the molecular medium and overrun them, leaving them either isolated inside the H II region (globules) or connected to the outside by a bridge of molecular gas (pillars). Recent simulations by Tremblin et al. (2012) show that the curvature of the cloud surface plays a decisive role in this process (destruction or formation of a pillar/globule).
Observations of some of these globules and pillars have shown them to be active star-forming sites with bright embedded sources (Comerón & Torra 1999; Sugitani et al. 2002). Recent Spitzer images of the Cygnus X region (cf. Fig. 1), a vast molecular complex with intense star-forming activity (see Reipurth & Schneider 2008, for an overview), display abundant examples of globules and pillars formed as the molecular cloud is progressively destroyed by the O stars of the nearby Cygnus OB2 association (e.g. Knödlseder 2000; Comerón et al. 2002; Comerón & Pasquali 2012; Wright et al. 2014). Detailed observations of far-infrared lines of [C II], [O I] and CO J = 11 → 10 observed with SOFIA1 (Schneider et al. 2012) and Herschel (Schneider et al. 2016), have revealed the peculiar nature of one globule in Cygnus X, IRAS 20319+3958 (hereafter referred to as “the globule”). The SOFIA study indicates that the globule is highly dynamic, with velocity features corresponding to rotation and outflowing gas. With the Herschel data, the physical properties of the globule were determined, giving a mass of ~240 M⊙ and a temperature of ~20 K. Most interestingly, however, is the finding that the observed UV-flux is of the order of 550 G◦ (with G◦ in units of the Habing field 2.7 × 10⁻³ erg cm-2 s-1), much higher than that found for all other globules in the Cygnus X region.
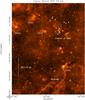 |
Fig. 1 Spitzer2 IRAC 3.6 μm image of the central Cygnus X region including the globule (indicated by a dashed circle and located at α2000 = 20h33m49.3s and δ2000 = 40°08′52′′). The most massive stars of the Cyg OB2 association are indicated with grey stars and the approximate center (e.g. Wright et al. 2015) with a white cross. The H II regions DR15, 18, 20, and 22 are indicated. |
The globule hosts a small, moderately embedded cluster. Kronberger et al. (2006) and Kumar et al. (2006) reported nine cluster members within a projected radius of 0.53 pc, with an estimated stellar mass of 17 M⊙. Here we adopt a distance of 1.4 kpc for the globule, which is the one determined for structures associated with the Cygnus X complex (Rygl et al. 2012) from parallax observations. A previous study by Cohen et al. (1989), motivated by mid-infrared emission features ascribed to PAHs, led to the identification of two visible stars as the source of excitation, for which those authors estimated mid-B spectral types.
A question not answered with the observations presented in Schneider et al. (2012) is whether the current physical conditions of the gas in the globule are mainly determined by its external illumination by the Cyg OB2 cluster, or whether the brightest stars of the IRAS 20319+3958 cluster produce their own photon dominated region (PDR) and H II region. One of the objectives of this paper is to answer this question and to reveal the stellar content of the globule. Previous studies (Schneider et al. 2012, 2016) have proposed that the globule is one of the rare examples of massive/intermediate-mass star formation in globules found in Cygnus X. Our finding is that the globule hosts a group of more than 30 very young stars, of which at least two are early B-type stars and likely the origin of the ionised gas found in the centre of the stellar aggregate.
For that, we obtained and present here deep near-infrared imaging of the globule complemented with visible imaging, and with spectroscopy in the visible and infrared of selected cluster members. The combination of near-infrared and existing Spitzer observations allows us to obtain a much more complete census of cluster members than previously available and to study in detail the evolutionary state of the cluster and some of its most outstanding members. At the same time, the detailed views of the respective distributions of the PDR and the ionised gas, together with the diagnostics provided by selected emission lines, yield further insight into the interaction of the cluster members with the various phases of the interstellar gas in the globule.
This paper (the second one of a series) is part of a larger study on understanding pillar and globule formation, and the conditions under which stars can form within them (PI: N. Schneider). The project draws together far-infrared imaging and spectroscopy from Herschel, Spitzer, and SOFIA, and ground-based millimeter molecular-line mapping3.
2. Observations and data reduction
2.1. Near-IR imaging
2.1.1. Omega2000 observations
The J, H, KS, Brγ and H2 imaging was obtained in service mode with the Omega2000 infrared camera on the 3.5 m telescope in Calar Alto on 29th and 30th of June, 2012. The Hawaii-2 array (2048 × 2048 × 18 μm) with a pixel resolution of 0 449 gives a total field-of-view (FoV) of 15.4′ × 15.4′. The imaging was done with a dither pattern consisting of 15 positions, using an integration time of approximately 1 min on each position. The total integration time was 15 min for the broad-band filters J, H and KS and 1 h for the Brγ and H2 narrowband filters. Details are given in Table 1.
The images have been reduced using the IRAF package and a set of own scripts. Bad pixels were treated in all images by interpolation, using a bad pixel mask provided by the observatory. Flat field correction was made using differential (lamp ON-OFF) dome flats for each filter. For each filter, 15 dithered images, obtained within approximately 20 min, were scaled and median filtered to make a sky image for subtraction, after re-scaling. The images were shifted and combined. The plate solution for each final image was found using the 2MASS catalogue (Skrutskie et al. 2006) as a reference, and all images were placed on the same scale.
Omega2000 observations.
Due to the chosen dither pattern, the region of interest for our study has an uneven coverage. The deepest part is a combination of 15 images while the southernmost area is made from only 3 images, and therefore the noise varies spatially across the image. Point source detection was done subregion by subregion using daofind in the IRAF digiphot package and with a threshold of 5σ and a conservative limit on σsky in each subregion. For this reason our estimate of completeness is uncertain. PSF photometry was made on all sources in each filter, using a penny1 model of the PSF that varies quadratically over the FoV. A total of 12 921 stars were measured in the H-band which results in the deepest image. Using the plate solution based on 2MASS positions, RA/Dec coordinates were calculated for all sources and the table was cross-correlated with 2MASS, finding a total of 2215 stars in common. The derived positions of the Omega2000 sources are estimated to be accurate to approximately 01. For the photometric calibration, we use 2MASS stars with quality flag “AAA” (837 stars). The offsets between Omega2000 and 2MASS magnitudes were examined for trends in colours, as well as spatial trends over the detector. There is a clear dependence on Y position for the J-band, and we used an empirical correction as a function of Y-pixel by a linear fit to the data (Jc = J−4.9 × 10⁻⁵ × Y-pixel). In H and KS no clear spatial dependence was found. Colour trends were then checked by plotting magnitude and colour differences versus the (J−H)2MASS colour index over a range from 0 to 3.3 mag, giving the following results:  where Δ indicates the difference (Omega2000 – 2MASS) for the index in question. We found these sufficiently small to safely neglect any colour corrections, since neither the foreground nor the internal extinction cause strong enough reddening on the sources of interest. The median offsets between 2MASS and Omega2000 magnitudes were then used to calibrate our JHKS magnitudes. The scatter in the offsets are large, however, as expected due to different spatial resolution. In order to estimate the accuracy of the calibration we select sources with KS< 12 mag that have no IR excess and are not blended with other sources, limiting the number to approximately 140 stars. On this sample we use a 2-σ clipping and find standard deviations around the mean offset of 0.043, 0.024 and 0.037 mag in J, H and KS, respectively. We take this as an estimate of our calibration error and add it up in quadrature to the output error from the PSF photometry.
In the source table, we have excluded Omega2000 magnitudes for sources brighter than approximately 10.4, 10.0 and 8.8 mag at J, H and KS, respectively, since these bright stars enter the non-linear range of the Omega2000 array (25 000 ADU) for our choices of individual exposure times. This means that in our further analysis, we use the 2MASS magnitudes and, where available, NOTCam magnitudes for these sources. In the deepest part of the field, the 5σ magnitude limit, defined as S/N = 5 in the final photometry, is reached at J = 20.5, H = 19.7, and KS = 18.5 mag. We make an approximate and conservative estimate of the completeness to be 18.5, 17.5 and 16.5 mag in J, H and KS, respectively, based on the detection histograms, but note that the observations have a different depth across the field, making such an estimate uncertain.
2.1.2. NOTCam observations
At the Nordic Optical Telescope (NOT), La Palma, the NOT’s near-IR camera and spectrograph NOTCam (Abbott et al. 2000; Djupvik & Andersen 2010) was used in its high-resolution mode, with a pixel scale of 0078/pix and a FoV of 80″× 80″, on 6th September, 2012, to image the central part of the globule in photometric and good seeing conditions. To avoid saturation, we used 3.6 s individual integration time and dithered the telescope in a 3 × 3 grid. Discarding a few individual images in the reductions, we obtained total integration times of 21.6, 25.2 and 28.8 s in J, H and KS, respectively.
All raw images were first corrected for non-linearity using the pixel-by-pixel correction coefficients available from the NOTCam web pages4. After this the images were bad-pixel corrected, flat-field corrected using differential skyflats, and sky-subtracted using the frames themselves to estimate the sky. The shifted images were combined, resulting in a FWHM of the PSF in the combined images of approximately 04.
PSF fitting photometry was made on the point sources detected, and magnitudes were found for 177 stars in H and K and 64 stars in J. Selecting stars with quality flag “AAA” from the 2MASS catalogue, excluding multiples resolved by NOTCam, results in nine stars that are useful to calibrate magnitudes and positions. The positional accuracy with respect to 2MASS positions is 01, and the standard deviation of the difference magnitudes mNOT−m2MASS is 0.08, 0.06 and 0.06 mag in J, H and KS, respectively. This calibration error is added in quadrature to the individual errors in the PSF magnitudes. The completeness limit is estimated to be 18, 18 and 17 mag for J, H and KS, respectively.
2.2. Visible imaging
Images centered on IRAS 20319+3958 were obtained through the VRCIC filters using the CAMELOT camera at the IAC80 telescope at the Teide Observatory on the night of 20th June, 2012. The camera covers a FoV of 10 1 × 101 on the sky. The exposure times were 600 s, 300 s and 120 s through the V, RC and IC filters, respectively. Flux calibration was achieved through observations of the nearby cluster NGC 6910 in all three filters with exposure times of 60 s (V), 30 s (RC) and 10 s (IC) when the cluster was near meridian transit, followed by observations with the same exposure times centered on the globule. The deeper images were obtained immediately before those of NGC 6910, thus ensuring that all observations were taken at virtually the same air mass. Standard image data reduction was carried out using IRAF, and PSF instrumental photometry on the resulting images was carried out with dedicated IRAF scripts using the layered DAOPHOT package (Stetson 1987). Astrometry was carried out using stars in common with the UCAC4 catalogue (Zacharias et al. 2013) and used to cross-match the sources detected in the CAMELOT images with those detected in the infrared observations.
Since no dedicated VRCIC photometry of NGC 6910 seems to exist in the literature, the CCD Vr′i′ photometry of stars in the field of NGC 6910 included in the UCAC4 catalogue was used to determine photometric zero-points in each filter using the transformation equations between the Vr′i′ and the VRCIC photometric systems given by Fukugita et al. (1996):  We then transferred the zero-points obtained on the NGC 6910 field to the shallow exposures of the globule field. We preferred this two-step approach rather than the direct calibration using the UCAC4 Vr′i′ photometry of stars in the globule field because the former field is more crowded, thus allowing us to obtain a more robust determination of the photometric zero-points. The estimated 5σ detection limits of the deep exposures of the globule are V ≃ 20.0, RC ≃ 19.5, and IC ≃ 18.0. Saturation in the deep images was reached at V ≃ 15.0, RC ≃ 14.0, and IC ≃ 14.0. The photometry of the stars brighter than these limits was taken from the shallow images of the field used for photometric calibration.
2.3. Optical spectroscopy
A set of optical spectra of the two brightest stars (referred to as star A and star B in Sect. 3) that appear projected on the globule’s head at visible wavelengths was obtained on the night of 25th August, 2012, using the TWIN spectrograph at the Calar Alto 3.6 m telescope. A dichroic mirror was used allowing us the simultaneous use of the blue and red arms of TWIN, resulting in a continuous spectral coverage in the range 4000 Å to 7500 Å. The gratings used yielded a resolving power of R = 2400 in both the blue and red arms, using a common entrance slit of 12 width. The slit was oriented at a fixed position angle so as to include both stars in a single setting. The slit length, of 6′, greatly exceeds the 30′′ of separation between those stars. Slit losses due to differential refraction are minimal due to the fact that the observations were obtained when the target region was near meridian transit, a few degrees from the zenith, at a maximum air mass never exceeding 1.12. Eight sets of spectra with an exposure time of 1800 s each were obtained in each arm. The individual science frames were bias-subtracted and divided by a flat field obtained with the telescope dome illuminated by a continuum lamp the morning after the observations. Wavelength calibration frames using a thorium-argon lamp were obtained immediately before and after the set of observations.
One-dimensional spectra of each of the two bright stars were extracted from each frame using a fixed-width aperture centered on the spectral trace of each of them. In addition, a spectrum of the brightest portion of the H II region, located approximately 9′′ East of the bright star near the center of the globule’s head, was also extracted. Background subtraction from the stellar spectra was carried out by averaging the spectrum extracted from two apertures adjacent to each star, and the same was done for the spectrum of the nebula. In this way, the spectrum of the all-pervading, structureless H II nebulosity present all along the slit is subtracted from the extracted spectra of both stars and of the nebula.
2.4. K-band spectroscopy
K-band spectra were obtained with NOTCam for the three brightest young stellar object (YSO) candidates in the globule. Two different spectral resolutions were used, both applying grism #1 and the K-band filter #208. In low-resolution mode the wide-field camera and the 128 μm slit (a long slit of width 0.6′′ or 2.6 pixels) covers the range from 1.95 to 2.37 μm with a dispersion of 4.1 Å/pix, giving a resolving power R = λ/ Δλ of approximately 2100. In medium-resolution mode the high-resolution camera lens together with the 44 μm slit (0.2′′ or 2.6 pixels wide) covers the range from 2.07 to 2.20 μm with a dispersion of 1.4 Å/pix and a resolving power R ~ 5500. The spectra were obtained by dithering along the slit in an A-B-B-A pattern, reading out the array non-destructively while sampling up the ramp. Argon and halogen lamps were obtained while pointing to target in order to minimise effects due to instrument flexure and to improve fringe correction. To correct the spectra for atmospheric features we used HD199373 (F5 V) and HIP 99346 (F0 V) as telluric standards.
NOTCam K-band spectra.
The 05 separation double star A was first observed in good seeing in low-resolution mode with the slit aligned to include both components, but it was difficult to separately extract the two spectra. The medium-resolution spectrum, however, which has three-times higher spatial resolution, resolved both components AN and AS well. The 14 separation double star C (see Sect. 3) was easily spatially resolved in the low-resolution mode, and star B is apparently single. Slit positions are overlaid on a high-resolution NOTCam K-band image in Fig. 10.
2.5. Spitzer IRAC data
Mid-IR photometry was obtained from the archive Spitzer post-BCD images in the four IRAC bands at 3.6, 4.5, 5.8 and 8.0 μm in the 15′ × 15′ field mapped in JHKS with Omega2000. The point source photometry was done through the PSF fitting procedure as described in Comerón (2011). The flux-to-magnitude conversion was made using the fluxes for a zeroth magnitude star as given in the IRAC and MIPS web pages. The catalogue of IRAC photometry was cross-correlated with the Omega2000 table using a tolerance of 13 in the matching of RA and Dec coordinates. We find a median offset of 022 in RA and 004 in Dec, and a total of 3476 sources are correlated (compared to 2119 correlated with 2MASS). The minimum magnitudes for point sources before entering saturation (for a frame-time of 12 s) was found to be 9.8, 9.3, 6.7 and 6.8 mag for the bands 3.6, 4.5, 5.8 and 8.0 μm, respectively. Sources brighter than this are flagged as upper magnitude limits. The 5σ point source detection limits are found at 15.3 mag, 14.8 mag, 12.7 mag and 11.7 mag for the bands 3.6, 4.5, 5.8 and 8.0 μm, respectively.
3. Results and analysis
3.1. YSO classification
We analyse the Omega2000 JHKs photometry and the Spitzer/IRAC photometry in a 15′ × 15′ field centred on the globule at α2000 = 20h33m49.3s and δ2000 = 40°08′52′′ and shown in Fig. 2. The IRAC photometry allows us to use well-established criteria to select Young Stellar Objects (YSOs) and classify them on the basis of their spectral energy distribution (SED) in the 3.6 μm to 8 μm region. Additional near-IR JHKS photometry extends the SEDs towards shorter wavelengths and helps characterising fainter YSOs that are not detected in all IRAC bands because of lower spatial resolution and sensitivity. The near to mid-IR photometric analysis is based on detecting IR excesses owing to circumstellar dust that absorbs and re-emits in the infrared. The slope of the SED from near to mid-IR, the α index, defined as the slope of log (λFλ) vs. log (λ), originally defined between 2 and 20 μm, has been used to define observed YSO classes and link them to the early stellar evolutionary stages (Lada & Wilking 1984; Adams et al. 1987; Andre et al. 1993; Greene et al. 1994), see Evans et al. (2009) for a review. Class IIIs have α< −1.6, Class IIs occupy a region of −1.6 <α< −0.3, flat-spectrum sources have −0.3 <α< 0.3, and Class Is have α> 0.3. Class 0s are often not directly detected at mid-IR wavelengths and are classified by their large submillimeter luminosity. Class I sources are embedded protostars with infalling dust envelopes, flat-spectrum are thought to have cleared out a cavity in their dust envelope, and Class IIs are pre-main sequence (PMS) stars with dust disks. Class IIIs have no detectable IR excesses and can not, therefore, be distinguished from field stars with near- and mid-IR photometry alone. An alternative to the SED slope is to use appropriately defined loci in colour–colour (CC) diagrams to distinguish between the YSO classes and separate IR-excess sources from reddened field stars. For IRAC photometry in particular, a number of slightly different colour criteria have been used by different authors (Megeath et al. 2004; Allen et al. 2004; Gutermuth et al. 2008, 2009).
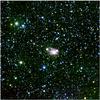 |
Fig. 2 JHKS RGB combined image of a 15 ′ × 15′ field centred on the globule at α2000 = 20h33m49.3s and δ2000 = 40°08′52′′ obtained with Omega2000. North up and east left. |
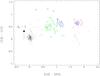 |
Fig. 3 IRAC [3.6] − [4.5] / [5.8] − [8.0] diagram for the sample of 316 sources with photometric errors <0.2 mag in all bands (black dots) and the selected Class I (red squares) and Class II (green circles) candidates using the criteria given in the text. The location of the three sources A, B and C are marked with blue star symbols. The direction and size of the reddening vector for AK = 3 mag is according to empirical relations for the IRAC bands by Indebetouw et al. (2005). |
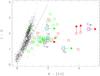 |
Fig. 4 J−H/K− [4.5] diagram for the sample of 2116 sources with photometric errors <0.2 mag in these bands (black dots). The already classified YSO candidates are shown with red squares (Class I) and green circles (Class II). The location of the bright sources A, B and C, of which A and C are resolved doubles in the near-IR, are marked with blue stars. Some sources have upper limits only in the J band. Some have lower limits due to saturation in the 4.5 μm band. The slope of the reddening band is indicated as a dashed line. |
Our strategy to define the YSO sample is summarised as follows: (1) find Class I and Class II candidates from the IRAC colour–colour (CC) diagram in Fig. 3; (2) use the CC diagram J−H/KS− [4.5] in Fig. 4 to check validity of the candidates found above as well as extract IR-excess sources not detected in step 1; and (3) use the CC diagram J−H/H−KS in Fig. 5 to search for any additional IR-excess sources not found in any of the above two steps.
From the complete source table with Omega2000 J, H and KS magnitudes and IRAC [3.6], [4.5], [5.8] and [8.0] magnitudes, we first consider the sample of 302 sources with photometric errors <0.2 mag in all IRAC bands, and use the IRAC [3.6] − [4.5] / [5.8] − [8.0] diagram shown in Fig. 3 to select Class I and Class II candidates. The extinction vector is based on the average IRAC extinction relations found by Indebetouw et al. (2005) for the diffuse ISM. In line with the Class I and Class II criteria of Megeath et al. (2004) and Allen et al. (2004) we define Class I candidates as those that have: ([5.8] − [8.0] −σ[5.8] − [8.0]> 1.2) and ([3.6] − [4.5] −σ[3.6] − [4.5]> 0.4) or ([3.6] − [4.5] −σ[3.6] − [4.5]> 0.8). This reveals 11 Class I candidates, of which 8 are located in the globule head within a radius of 0.4 pc (~1′ at d = 1.4 kpc) from the central bright star A, see Fig. 6. The three remaining sources are faint (13.4 < [3.6] < 14.2 mag) and separated from the globule by more than 6′. These could be scattered Class Is anywhere along the line of sight, or they could be extragalactic sources, such as AGNs or galaxies with strong PAH features contaminating the sample. We did not perform the rigorous “weeding out” of extragalactic contaminants described in Gutermuth et al. (2008), since our main target of this study is a small globule over whose area such a contamination must be negligible. Some of the Class I candidates in the globule are very bright in the IRAC bands and enter the saturation limits. For these, the IRAC colour indices are uncertain, but as shown below, their lower limit on the K− [4.5] index strongly supports a Class I designation.
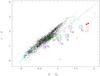 |
Fig. 5 Omega2000 J−H/H−KS diagram for 3435 sources with errors <0.06 mag in all bands (black dots). The empirical reddening vector (dashed line) has a slope of 1.97. We have overlaid the positions of known Class Is (red squares), Class IIs (green circles), and the stars A, B and C (blue stars). The nine new YSO candidates (magenta triangles) are sources with K-band excess not already extracted using the previous two CC diagrams. |
From the remaining sources we define Class II candidates as those that satisfy both [5.8] − [8.0] −σ[3.6] − [4.5]> 0.4 and [3.6] − [4.5] −σ[3.6] − [4.5]> 0. This results in 35 Class II sources of which only two are located in the globule head, namely the bright stars A and B. Both of these are saturated in all IRAC bands, thus the Class II designation is uncertain, but the clear near-IR excesses confirm their YSO status. The remaining 33 Class IIs have a more extended spatial distribution, as shown in Fig. 6.
To check that the above Class I and Class II candidates are not subject to PAH contamination that would masquerade as excess emission at 5.8 and 8.0 μm, or source confusion in the centre of the globule, we require that the candidates have point source counterparts in at least two of the near-IR bands, and we use the J−H/K− [4.5] diagram shown in Fig. 4 to verify IR-excess in the K− [4.5] index. Practically all YSO candidates, except three Class IIs, are well separated from the reddening band with clear IR-excesses, and in addition, Class Is have, in general, larger IR-excesses than Class IIs. We note that for two Class Is we only have lower-limit estimates on the J-band magnitudes. For some of the brightest sources, the IRAC magnitudes are upper limits due to saturation/non-linearity. The double sources Stars A and C are not spatially resolved by IRAC, and we simply divided their IRAC fluxes in two, thus, their location in this diagram is only an indication.
The J−H/K− [4.5] diagram is also used to find fainter IR-excess sources. It shows a total sample of 2116 point sources with photometric errors <0.2 mag in all the bands J, H, K, and [4.5]. The vast majority is located along a reddening band with no excess in the K− [4.5] index. The upper part of the reddening band becoming bluer is believed to be due to giants with strong CO absorption in the [4.5] band (Megeath et al. 2004). The reddening vector is based on A4.5 = 0.43AK (Indebetouw et al. 2005) together with our near-IR extinction (see below) to have a slope of 1.95 which is in good agreement with the value 1.97 used by Rivera-Gálvez et al. (2015) as the division line for sources without IR excesses in a similar study in Cygnus. We assign as IR-excess sources those that are located to the right and below this slope by more than 2σ in the respective colour indices. This gives 130 YSO candidates, of which 88 are new, while 42 of the 44 already suggested YSO candidates also obey this criterion. The 88 new YSOs have clear IR-excess in their K− [4.5] colour, and the majority occupy the same locus as previously defined Class II sources. We interpret these sources as fainter Class II sources that could not be classified with IRAC photometry alone. As many as 27 of the 88 new YSO candidates are located within a projected radius of ~1′ in the globule head.
Next we explore the sample of 3435 sources with photometric errors <0.06 mag in J, H, and KS to check if there are fainter YSOs with excess emission in the KS band not already classified above. The J−H/H−KS diagram is shown in Fig. 5. The reddening slope was found, by a linear fit to all sources that show no IR excesses, to be 1.97 ± 0.01, and it is drawn (dashed line) from the position of the reddest M dwarfs, that is, shifted by 0.08 mag to the right. This slope corresponds to β = 1.83 for the near-IR extinction law in the form Aλ ∝ λ− β. The positions of known Class I and Class II sources are indicated with red squares and green circles, as well as the locations of the stars AN, AS, B, CNE and CSW (blue stars). We identify sources with K-band excess as those lying more than 2σ of the uncertainty in the colour indices to the right of and below the reddening vector. A total of 26 such sources were found, of which 16 also have 4.5 μm excess and one is a previously found Class II. Thus, only nine are new YSOs not already classified.
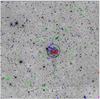 |
Fig. 6 Spatial distribution of the YSO candidates overlaid on the Omega2000 15′ × 15′ H2v = 1–0 S(1) image. Class Is (red squares), Class IIs (green circles), additional YSOs with 4.5 μm excess (blue plus signs) and K-band excesses (magenta diamonds) not otherwise classified. The black circle has a radius of 1′ (0.4 pc) and shows the approximate extent of the cluster in the globule head. |
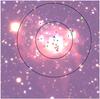 |
Fig. 7 Close-up view of the globule in RGB-coded colours where red is the H2 image, green is H and blue is J from Omega2000, N up E left. YSOs are marked as in Fig. 6 and the three bright stars A, B and C are labeled above (north of) the stars. The two circles indicate radii of 0.2 and 0.4 pc from star A. |
In the 15′× 15′ field we thus found 11 Class I candidates, 36 Class IIs, 88 YSO candidates with excess emission at 4.5 μm and not already in the previous two groups, and further 9 sources with K-band excess not previously designated with a YSO status, making a total of 144 YSO candidates over the whole field. As shown in Fig. 6 the spatial density of these is clearly enhanced at the location of the globule, where we find 40 YSOs within a projected radius of 1 arc minute (0.4 pc). Figure 7 shows a close-up view of the globule with the YSOs overlaid and including the three bright stars A, B and C. Thus, the globule clearly hosts a small embedded cluster, supporting the scenario proposed by Schneider et al. (2012).
3.1.1. The YSO sample
We note that the above Class I criteria make no distinction between flat-spectrum, Class I or Class 0 sources. Those in the Class I group that are located in the globule, have a relatively large [5.8] − [8.0] index, combined with a relatively small [3.6] − [4.5] index, a region in the CC diagram typically occupied by flat-spectrum sources, as shown in Allen et al. (2007) and Evans et al. (2009). A few Class Is have K− [4.5] indices typical of Class II sources.
The sample of 88 + 9 IR-excess sources that can not be given a definite Class I or Class II designation are most likely pre-main sequence (PMS) stars with disks. One of these sources is 2MASS J20333684+4009387, located approximately 2.5′ away from the globule to the WNW, a previously spectroscopically identified TTauri star (Vink et al. 2008). In the J−H/KS− [4.5] diagram, the majority of the IR-excess sources are located in the region dominated by Class IIs, while only a few have significantly larger excesses. Thus, we include these in the Class II group for statistical considerations. Because our selection of YSO candidates is based on IR-excess only, a number of sources without IR-excess could, in principle, be young PMS members of Class III-type. The number of sources within 0.4 pc of star A that have detections in all near-IR bands is 140, while 40 of these are IR-excess YSOs. For two reference fields of equal size outside the globule, we find 86 and 122 sources with detections in all near-IR bands. Thus, on average, there is no over-density of stars at the location of the globule, apart from the IR-excess YSOs; an indication that the contribution of Class III sources is insignificant. Keeping in mind the above loose definitions of the Class I and Class II groups, we find a number ratio of Class I/Class II in the total area of 11/133, while within a projected radius of 0.4 pc of the globule head this ratio is 8/32. If we consider the inner part of the globule within a radius of 0.2 pc, this number ratio is 7/10. The lifetime of the Class I stage is estimated to be 0.54 Myr (Evans et al. 2009) so that sucha high number of Class Is suggests that there has been a recent burst of star formation in the central part of the globule.
The Class I sources are all located in the southern part of the inner cluster, while the more evolved sources are mainly in the northern part. Counting up the total number of YSOs and the Class I fraction, we find that in the northern half of the area inside a radius of 0.4 pc, Class Is constitute only 8% (2/25) of the YSO population, while in the southern half they comprise 53% (9/17). The projected spatial distribution of the Class Is is highly clustered and clearly to the south of the cluster centre. The remaining YSOs, on the other hand, have a projected distribution that is more dispersed overall, but 23 of the 31 sources are in the northern part. Despite the fact that the velocity dispersion of the newly formed stars will tend to, with time, smear out any initial spatial pattern of star formation (up to 1 pc, or 2′5 on the plane of the sky at the distance of Cygnus OB2 over 1 Myr for a velocity of 1 km s-1), the subsisting predominance of Class II sources ahead (North) of the globule could thus be an indication of star formation progressing from the North towards the south inside the globule, that is, propagating away from the center of Cygnus OB2.
In Table 3 we list the 40 YSOs within a projected radius of 0.4 pc centred on star A with positions and multi-band photometry. The near-IR photometry is from Omega2000 except for the brightest sources that enter the non-linear regime of the detector, where we instead use the NOTCam magnitudes when available and elsewhere the 2MASS magnitudes. For sources unresolved by Omega2000, we use the NOTCam photometry where available.
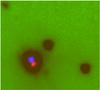 |
Fig. 8 NOTCam JHKS 9′′ zoom-in on star A, resolved in two components with separation 0 |
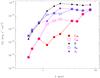 |
Fig. 9 Observed SEDs of the stars A, B and C. The double sources A (0 |
The 40 YSO candidates within a radius of 0.4 pc from star A.
3.2. The brightest members of the globule population
The three brightest stars projected on the globule at near- and mid-infrared wavelengths are respectively labeled as stars A, B and C in Fig. 7. The spectroscopic study of these three stars yields additional information useful to assess their nature as well as the evolutionary status of the globule and the stellar population associated with it.
With the high spatial resolution of our NOTCam images, Star A is resolved into two close components separated by 052, see Fig. 8. This is too close to be resolved by Spitzer, and the combined luminosity of the pair results in the characteristics of a Class II source. The resolution of the pair in the NOTCam images at J, H and KS shows that only the Southern component, which is also redder, displays K-band excess (see Fig. 5).
Star B also has a Class II SED, and appears unresolved in all the images. The extended emission of the globule hints at a peak coincident with its position. The brightest Class I source in the mid-IR is star C, approximately 15″ to the South of star A. Star C is a resolved binary with a separation of 142 both in the Omega2000 and NOTCam datasets. Both components have near-IR excess. The NE component is the brightest and the SW component is the reddest. Figure 9 shows the observed SEDs of these stars from the V band to the 8 μm IRAC band.
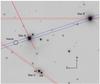 |
Fig. 10 Slit positions and widths overlaid on NOTCam high-resolution K-band image zoomed in to 50″× 40″. Three near-IR slit positions (red) across the double sources stars A and C, and the single source B, and the optical slit (blue) across stars A and B and the Nebula. |
3.2.1. Stars A and B
The spectra of both stars A and B (see Fig. 10 for the slit positions and Figs. 11 and 12 for the spectra) display very reddened continua consistent with the high extinction derived in their direction. Besides the telluric absorption bands in the red, both spectra display abundant diffuse interstellar bands (Sarre 2006). However, the He I 5875 Å and 6678 Å lines are clearly seen in absorption in both spectra, thus unambiguously classifying both stars as B-type or earlier.
The emission-line spectra of both stars show remarkable differences, though. Superimposed onto star B is the spectrum of a low-excitation H II region with an electron density ne ≃ 800 cm-3 derived from the ratio of the [S II] lines at 6717 Å and 6731 Å, representing a very local enhancement of the H II nebula. The expected photospheric Hα absorption in the spectrum of star B is completely filled by the nebular emission at the same wavelength, preventing the determination of its spectral type through the ratio of the He I to the Balmer lines. However, the ability of star B to excite a local H II region and the low excitation suggests an early B spectral type. The possible appearance of weak Si III absorption at 5740 Å, which is only tentatively detected in our spectrum, would constrain it to the B0.5–B1.5 interval (Walborn 1980).
While the continuum and absorption line spectrum of star A is similar to that of star B, including the presence of He I in absorption, the emission-line spectrum at its position is markedly different and clearly indicates a circumstellar origin. The very intense Hα emission displays an obvious P-Cygni profile, with an extended red wing. The same P Cygni profile is clearly seen in the Hβ line as well. No other prominent emission lines appear in the red, but the blue spectrum displays strong Fe II lines of multiplets 42 and 49.
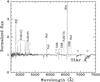 |
Fig. 11 Optical spectrum of star A. Note the absorption lines of helium at 5875 Å and 6678 Å. |
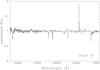 |
Fig. 12 Optical spectrum of star B. Note the absorption lines of helium at 5875 Å and 6678 Å. |
The concurrent appearance of Hα with P Cygni profile (Beskrovnaya et al. 1999; Kraus et al. 2008) and the Fe II multiplets in emission (Rossi et al. 1999; Hernández et al. 2004) together with a photospheric spectrum displaying He I in absorption classify Star A as a Herbig Be star. However, the optical spectrum needs to be interpreted with caution in view of its binarity. The orientation of the slit, coupled with its width, the 1.̋5 seeing under which the spectra were taken, and the close separation between both components implies that the spectrum is the blend of the individual spectra of components North and South. The photometry presented in Table 3 suggests that the Northern component, being the bluest, dominates the continuum in the region covered by our spectra, but the characteristics of component South, being a source with strong near-infrared excess, make it a candidate contributor to the emission-line spectrum.
K-band spectroscopy of star A under excellent image quality conditions, allowing us to partly resolve the spectra of both components, is presented in Fig. 13. Both spectra have essentially featureless continua, consistent with them being produced by early-type photospheres with some degree of continuum veiling. The spectra also show that Brγ is largely produced by the Southern component, with an equivalent width of 8 Å. The much stronger Brγ emission of the southern component hints that the Hα emission in the blended spectrum, and possibly the entire emission-line spectrum of the system, is actually dominated by the redder Southern component.
3.2.2. Star C
Star C is one of the brightest stars in the globule at near- and mid-IR wavelengths, with colours corresponding to a Class I young stellar object based on Spitzer photometry, which does not resolve the two 14 separation sources. Both components CNE and CSW have near-IR excesses (cf. Fig. 5) with CSW being the fainter and the redder of the two. The K-band spectra of the two components of Star C are shown in Fig. 14.
The brighter northeastern component has a strong Brγ emission line with an equivalent width as large as 70 Å, typically seen only for the most luminous Class I type YSOs (Ishii et al. 2001), together with He I at 2.0583 μm in emission and a tentative detection of Fe II in emission at 2.0893 μm. The lack of photospheric features hampers its classification, but the simultaneous presence of IR excess and He I and Fe II in emission suggests a massive YSO. The fainter and redder southwestern component has a faint Brγ emission line (EW ~ 3 Å) on an otherwise featureless spectrum. Both stars show faint and slightly extended H2 emission at 2.1218 μm. We measure the line ratio of He I (2.058 μm) to Brγ to be ~0.1. According to models by Lumsden et al. (2003) in their study of He and H line ratios of compact H II regions, a line ratio of 0.1 suggests that CNE has a temperature Teff ≪ 36 000 K, and probably <30 000 K. Thus, CNE could be a late O or early B star, probably more massive than Star A, where we do not detect He I emission. For further comparison, we obtained a K-band spectrum of Star B and also found a He I to Brγ ratio of approximately 0.1 for this star, but with the difference that the Brγ equivalent width of star B is almost a factor of ten smaller (see Fig. 14). Interestingly, the He I emission is seen superimposed on the spectrum of CNE alone and is not seen towards CSW located only 14 (<0.01 pc projected distance) away.
3.3. Intrinsic properties of the YSO population
The combination of near-infrared photometry and the visible photometry available for many of the sources in the globule allows us to probe the photosphere-dominated region of their spectral energy distributions and compare it to evolutionary tracks to infer their intrinsic properties. The number of YSOs identified in the concentration toward the head of the globule also provides some insight into their collective properties, most notably their mass function.
We have used the PMS evolutionary tracks of Palla & Stahler (1999) for masses below 4 M⊙, with colours from Testi et al. (1998), complemented for higher masses with the evolutionary tracks of Lejeune & Schaerer (2001) for non-rotating stars of solar metallicity, which include a synthetic computation of the intrinsic colours. The fluxes at J and shorter wavelength bands were fitted to the synthetic fluxes leaving the V-band extinction AV as an adjustable parameter, scaling it to the other bands by means of the Cardelli et al. (1989) extinction law for a total-to-selective extinction ratio RV = 3.1. We did not include infrared bands longward from J in the fit due to the possible existence of circumstellar emission substantially contributing to the flux at long wavelengths. We used the 1 Myr isochrone as being approximately representative of young Class II objects (e.g. Evans et al. 2009), where the initial circumstellar envelope has been largely dissipated and the central object has become accessible to visible and near-infrared observations. Isochrone fitting, as a way to determine the age of the aggregate, is not applicable to our data due to the degeneracy of isochrones at high and intermediate masses in colour–magnitude diagrams, and to the fact that we do not have optical photometry for the lowest-mass stars, for which such degeneracy breaks, which would allow us to independently fit the spectral energy distribution and the amount of foreground extinction as described below.
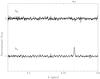 |
Fig. 13 Medium-resolution (R = 5500) normalised K-band spectra of the two 0 |
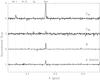 |
Fig. 14 Low-resolution (R = 2100) K-band spectra of the three brightest stars. Star A shows both components unresolved, star B is apparently single, and star C is well resolved into the NE and SW components. The spectra are offset by unity on the y-axis. |
A least-square fit to the V,RC,IC,J magnitudes was performed for those stars having measurements in at least two of those bands to derive their mass and the extinction in their direction. This is the case for 13 of the 40 YSO candidates listed in Table 3. Those stars show AV values mostly within the range 7.0 <AV< 11.9, with the exception of two sources without strong infrared excess for which we derive a much smaller value of AV, and which are likely foreground stars. The small size and low density of the head of the globule suggest a low level of internal extinction: assuming a maximum extension along the line of sight of 0.8 pc, a typical density n(H)~ 200 cm-3 (see Sect. 3.4.1) and a proportionality between visible extinction AV and hydrogen column density NH of the form AV = 5.6 × 10⁻²² cm (Liszt 2014), we estimate that the internal extinction does not exceed AV ≃ 0.3 mag. Most of the extinction is thus produced in the foreground, possibly associated with the Cygnus Rift. This feature is an extended area of gas and dust at a distance of approximately 600 pc, not related to the Cygnus X region (Schneider et al. 2007, for example), which produces a sudden increase in visual extinction (Staude et al. 1982). For stars with no photometric measurements in bands bluer than J we have adopted AV = 9.6, the average value obtained for those stars for which individual AV can be obtained, and have estimated their mass from the corresponding absolute magnitude MJ given by the isochrones. The adopted value has an estimated uncertainty of ~±3 mag, translating to an uncertainty MJ ~ ± 0.8 mag.
Estimated properties of the YSOs, assuming 1 Myr age.
The derived mass M and absolute J magnitude MJ, and the derived or adopted extinction AV, are given in Table 4. The YSO population of the globule covers over two orders of magnitude in mass, from Stars AN and B, which are the most massive at M ≃ 13M⊙ and M ≃ 23M⊙, respectively, (in consistency with their early B spectral types) to below 0.1 M⊙, as we derive for stars #3 and #94. These latter two objects, which display clear infrared excesses at the longer Spitzer bands, may be massive brown dwarf YSOs of the aggregate in the globule.
We note that the mass that we derive for star CNE of 8.1 M⊙ makes it significantly less massive than stars AN and B, in consistency with its lower brightness in the visible and near-infrared. However, such relatively moderate mass for a young stellar object seems to be in contradiction with the appearance of He I in emission in the K-band spectrum, which we used in Sect. 3.2.2 to argue for a spectral type possibly earlier than those of stars AN and B. The apparent contradiction might be accounted for by the possibility that the He I emission is not produced in a compact H II region around star C but in the hot spots caused by accretion onto its surface instead, thus being unrelated to the temperature of the central object. On the other hand it is also possible that the main contribution to the flux received at short wavelengths does not actually come directly from the central object, but rather from the scattering of its light by the dusty circumstellar envelope that is also responsible for the strong infrared excess of star C at long wavelengths. The available observations do not allow us to discern between those two possibilities, and we must consider that the actual mass of star C remains particularly uncertain.
The determination of the mass function of the aggregate is complicated by several factors that include the uncertainties in PMS evolutionary tracks, the unknown age of the members, the approximate correction by extinction effects, incompleteness at the lowest masses, and incompleteness due to the existence of members still in early evolutionary phases and not yet accessible to direct observation in the visible and near-infrared. Nevertheless, the histogram of masses shown in Fig. 15 that we obtain from the estimated physical properties gives some interesting insights into the collective properties of the aggregate.
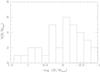 |
Fig. 15 Histogram of the distribution of stellar masses in the globule aggregate, according to the derived values listed in Table 4. An age of 1 Myr has been assumed. |
Assuming a power-law slope of the initial mass function of the form N(M) ∝ M(Γ + 1)Δlog M, the histogram for masses above solar indicates a slope Γ = −1.6 ± 0.2, shallower than the Salpeter exponent (Γ = −2.35) characterising the functional forms of the initial mass function above one solar mass. The peak of the mass histogram is, in principle, reminiscent of that observed in the initial mass function in the field and in clusters, reproduced by the log-normal part of the analytical representation of the initial mass function (Chabrier 2005) where such a peak appears at 0.1–0.2 M⊙. We find it at a significantly higher mass, ~1 M⊙, but the mass of the peak is very sensitive to the adopted age and drops to ~0.3 M⊙ in the extreme case of adopting the 0.1 Myr PMS isochrone of Palla & Stahler (1999). The offset may also be a simple artifact of incompleteness of our sample, but we note that stars near the peak have relatively bright absolute magnitudes, MJ ≃ 2.5), well above our completeness limit even at the distance modulus of Cygnus OB2 when obscured by AV = 10 (AJ = 2.9), therefore suggesting that the peak is real. If our sample is nearly complete down to where the initial mass function declines with decreasing mass, the sum of the estimated stellar masses given in Table 4 yields a total mass of the stellar aggregate of ~90 M⊙.
An overestimate of the actual age of the aggregate members would also have the effect of making the high-mass slope of the mass function shallower: using the 0.1 Myr isochrone yields Γ = −1.4 ± 0.2. All this hints to a departure from the canonical initial mass function for the aggregate, in the sense that the mass function of the population embedded in IRAS 20319+3958 would be top-heavy and have its peak at a higher mass. However, given the many uncertainties involved, deeper imaging and complementary observations allowing a more robust determination of the mass distribution would be required to make firm conclusions on this point.
3.4. The extended emission
Deep narrow-band imaging at 2.122 μm, covering the ro-vibrational 1-0 S(1) line of H2, and at 2.166 μm, covering Brγ, shows extended emission in both of these lines at the location of the globule (see Fig. 16). We have made approximate continuum subtraction by scaling the KS band image intensity down by a factor 0.075 and 0.055 for H2 and Brγ, respectively, based on the transmission curves of the filters. By comparison with Fig. 7 where the positions of YSOs are overlaid, we see that the Brγ emission peaks approximately 5″ to the south of Star A. There is also a rim of Brγ emission along the northern edge of the globule, which we interpret as being due to the external UV field from the Cygnus OB2 cluster, located to the North of the globule (see Fig. 1). This emission is much fainter than the centrally peaked emission, however, which we argue is due to the internal feedback from the stars inside the globule. The highest intensity is found around the binary Class I star C and coincides with the brightest peak of [O I] emission (see Schneider et al. 2012, Fig. 3), thus highlighting the extreme youth of this part of the globule.
The comparison between the high-angular-resolution images tracing the PDR and the ionised gas emission highlights the striking differences between their respective distribution, already hinted in Schneider et al. (2012). In the H2 images, the PDRs appear mainly as bright fingers of emission highlighting rims where the molecular gas is being photodissociated. Figure 16 strongly suggests that the molecular gas traced by the PDR emission is approximately distributed in a shell that delineates the outer contour of the globule. The globule and its tail is initially shaped by external feedback from the UV field with the globule head pointing towards the OB2 cluster with the tail away from it. The brightness pattern of the emission rims, however, suggests that they are illuminated from the inside, reinforcing the interpretation of Schneider et al. (2012) in favour of an internal origin for the PDR emission caused by the embedded cluster, rather than an external origin due to the UV field. On the other hand, the clear central condensation of the Brγ emission, together with the spectroscopic evidence that we present in Sect. 3.4.1, clearly show that the ionised gas is also caused by the embedded cluster stars.
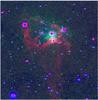 |
Fig. 16 Globule colour–coded with H2 emission (red), Brγ (green), and J-band (blue). |
3.4.1. Spectroscopy of the nebula
The extracted optical spectrum of the nebula approximately 9′′ East of the position of star A clearly indicates a low-excitation H II region. No hints of [O III] emission are seen near 5000 Å, and there is only a marginal detection of He I at 6678 Å, with He I at 5875 Å being undetectable (Fig. 17). This is what one would expect from a small H II region ionised by the soft radiation of early B-type stars in the globule, rather than by the harder radiation field dominated by the O stars of nearby Cygnus OB2. This leads us to conclude that the radiation field inside the globule is dominated by its embedded B stars, rather than by harder radiation leaking in from the outside. The electron density inferred from the [S II] lines is ne ≃ 200 cm-3.
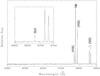 |
Fig. 17 Visible-red spectrum of the H II region. The intensity ratio of [S II] lines at 6717 and 6731 indicates an electron density ne ≃ 200 cm-3. The marginal detection of He I at 6678 Å (see inset) and the non-detection of He I at 5875 Å indicate a soft ionising radiation like that expected from the early B stars embedded in the globule. |
4. Discussion
Our observations reveal a cluster of very young stellar objects associated with the globule IRAS 20319+3958. Youth is clearly highlighted by the ratio of Class I to Class II sources, implying that star formation there has been proceeding for a period comparable to the typical span of the Class I stage. Signposts of this youth are also found among the brightest young stellar objects of the globule: one of them (star A) is a binary in which at least one of the components is a Herbig Be star, and the other two, star B and the binary Class I star C, have very compact, low-excitation H II regions around them. An obvious upper limit to the number of diskless (Class III) young stellar objects is given by the number of stars that appear projected on the area of the globule and that do not display infrared excess, as compared to the number of those same sources in a typical off-cloud area. We find no significant enhancement of non-excess sources at the position of the globule as compared to the background population, indicating that the number of Class III sources is small and probably negligible in comparison to that of Class I and II sources.
Some extreme Class I or even Class 0 objects surrounded by thick envelopes may be missed by the near-infrared observations, but the lack of sources detected by Spitzer and without a near-infrared counterpart in our JHKS images argues against this being a numerically significant population. We thus conclude that, although having taken place very recently, the star-formation process in IRAS 20319+3958 is essentially finished now. The high Class I-to-Class II ratio together with the absence of a significant Class III population suggests that the age of the cluster is much shorter than typical disk dispersal timescales. The latter are suspected to depend on the central object’s mass, the stellar density of the environment (Luhman et al. 2010) and binarity (Daemgen et al. 2016), but disk lifetimes of 1–3 Myr appear to be typical, both on a theoretical and an observational basis (e.g., Li & Xiao 2016). The duration of the Class I phase has been traditionally estimated by comparing the relative number of Class I to Class II YSOs in star-forming regions under the assumption of a constant star-formation rate (Evans et al. 2009), but recent work based on detailed observations and modelling of the accretion on the central object have challenged an evolutionary picture in which the circumstellar envelope steadily disperses until the Class I/II transition takes place, suggesting instead that Class I objects may reach ages comparable to those of T Tauri stars, up to 1 Myr and older (White et al. 2007, and references therein). We can thus take 1 Myr as a reasonable estimate of the age of the globule population, as already anticipated in Sect. 3.3. However, if the more traditional interpretation of Class I objects as a population distinctly less evolved and shorter lived than the Class II population is adopted, then the Class I/Class II ratio argues for an even younger age of the aggregate.
The youth of the cluster leads us to wonder if its formation could have been triggered by the passage of the ionisation front that left it as an isolated feature. Evidence for triggered star formation near rim nebulae and clumps exposed to eroding ultraviolet radiation, although elusive, has been reported in a number of cases (e.g. Sicilia-Aguilar et al. 2014; Getman et al. 2007; Niwa et al. 2009; Hayashi et al. 2012; Comerón et al. 2005; Comerón & Schneider 2007) under conditions that closely resemble those found in IRAS 20319+3958. Spitzer and molecular line images of the region (see Fig. 1 and Schneider et al. 2016) show the abrupt interface between the Cygnus X molecular complex and the interstellar medium cleared by the ionisation and winds from the stars in Cygnus OB2. In the region where the globule lies, such interface, which marks the current location of the ionisation front, is located approximately 24′ South of the globule, corresponding to a projected distance of 10.5 pc (see Fig. 1). If the globule had started forming stars spontaneously before being run over by the ionisation front, a cluster age of 1 Myr would require an averaged propagation speed of the ionisation front of approximately 10 km s-1 or more. The possibility that star formation started before the arrival of the ionisation front remains plausible in view of our results, unless our choice of 1 Myr as the age of the aggregate grossly overestimates its actual age, which is unlikely in view of its sizeable Class II population. Our results, therefore, do not unambiguously argue for the passage of the ionisation front as the factor that triggered star formation in the globule. However, the approximate coincidence of the onset of star formation in the globule with the estimated passage of the ionisation front, if the latter propagated at 10 km s-1 (see Schneider et al. 2016), is circumstantial evidence for a causal connection between both events. We note in support of this connection that the distribution of Class II sources in the periphery of the globule, preferentially projected on the side facing the densest regions of the Cygnus OB2 as noted in Sect. 3.1.1, also suggests that the changes in the environment of the globule caused by its rapid exposure to the ionising radiation (Bertoldi 1989; Gritschneder et al. 2009; Tremblin et al. 2012) played a determinant role in the star-formation history of the globule.
The hints of an atypical mass function described in Sect. 3.3, if real, might also be related to the particularities of star formation in a globule exposed to intense external ultraviolet radiation. Our results resemble those obtained on another star-forming region suspected to be externally irradiated, IRAS 16362-4845 in RCW108, where we also found indications of a top-heavy mass function (Comerón & Schneider 2007). However, possible departures from a universal form of the initial mass function are far from established. Examining the excess of young stellar objects around bubbles as proof of triggered star formation, Thompson et al. (2012) find no evidence for an initial mass function different from that in the field. Similarly, in their detailed study of the stellar population in the Trumpler 37 cluster and its adjacent globule IC 1396A, Getman et al. (2012) obtain a good fit to their results with the widely used initial mass function of Kroupa (2001), for the populations of both the central cluster and the globule, although the latter does not contain stars more massive than 2 M⊙. On the theoretical side, the problems in relating the effects of temperature, turbulence, and magnetic fields with the peak of the mass function and its slope at different masses have been outlined by Offner et al. (2014), but no clear connection between peculiarities in the initial mass function and the star-formation conditions expected as the result of the triggering mechanism has been demonstrated.
5. Summary and conclusions
We studied the content of the cluster embedded in the IRAS 20319+3958 globule and the distribution of its excited molecular hydrogen and ionised gas by means of visible and near-infrared imaging and spectroscopy, complemented with mid-infrared Spitzer/IRAC imaging. The study complements that of Schneider et al. (2012) on the physical and kinematical conditions of the molecular and photodissociating gas, thus providing a comprehensive picture of the globule and its content. Our conclusions can be summarised as follows:
-
The IRAS 20319+3958 globule contains an embedded aggregate of approximately 30 very young stellar objects, most of them characterised by the strong near and/or mid-infrared excesses expected from a very early evolutionary stage. We estimate the age of the embedded aggregate to be ~1 Myr, based on the high observed ratio of Class I to Class II objects. We also estimate a stellar mass of the aggregate of ~90 M⊙.
-
The most massive members of the aggregate are three systems containing early B-type stars. Two of them are able to produce very compact H II regions, one of them being still highly embedded and coinciding with a peak in PDR emission. Two of these three systems are resolved binaries, and one of them contains a visible Herbig Be star.
-
The mass function of the aggregate, based on an approximate derivation of the individual stellar masses, suggests a high-mass tail characterised by a slope shallower than that found in most clusters, and a peak of the mass function possibly lying at higher masses. This might be due to the influence of the strong ionising radiation field under which the aggregate was formed. However, large uncertainties affecting our derivation of the individual masses of the members of the aggregate, most notably the age adopted for its faintest members, make this conclusion tentative at best.
-
The compared morphologies of the H2 emission that traces the photon-dominated regions and the Brγ emission that traces the ionised gas suggest that molecular gas is roughly distributed as a shell around the embedded aggregate, filled with centrally-condensed ionised gas. Both the morphology and the low excitation of the H II region indicate that the sources of ionisation are the B stars of the embedded aggregate, rather than the external UV field caused by the O-stars of Cygnus OB2.
-
Considering the estimated age of the embedded aggregate and the isolation of the globule, we find it likely that the formation of the embedded aggregate started when the globule was overtaken by the large-scale ionisation fronts that the O stars of Cygnus OB2 drive into the Cygnus X region.
The Spitzer images of the Cygnus OB2/Cygnus X region offer a dramatic view of pillars and globules resulting from erosion by the massive association of its parental molecular gas, and, simultaneously, of the recent star formation revealed by the strong infrared excesses caused by hot circumstellar dust. Those images strongly suggest that the globule IRAS 20319+3958 is a typical feature in the region rather than a rarity, and the same is apparent from the images of other massive star-forming regions. The study of globules and pillars and their embedded populations can thus provide excellent samples for the study of triggered star formation and the features that it may imprint on the stellar aggregates resulting from it.
Stratospheric Observatory for Far Infrared Astronomy, https://www.sofia.usra.edu/
Data taken within the Cygnus-X legacy survey, see https://www.cfa.harvard.edu/cygnusX/
For details on the calibration of NOTCam see http://www.not.iac.es/instruments/notcam/
Acknowledgments
Based on observations made with Omega2000 at the 3.5 m telescope of the Centro Astronómico Hispano Alemán (CAHA) at Calar Alto, operated jointly by the Max-Planck Institut für Astronomie and the Instituto de Astrofísica de Andalucía (CSIC). Partly based on observations made with the Nordic Optical Telescope, operated by the Nordic Optical Telescope Scientific Association at the Observatorio del Roque de los Muchachos, La Palma, Spain, of the Instituto de Astrofísica de Canarias, as well as observations with the IAC80 telescope, operated on Tenerife by the Instituto de Astrofísica de Canarias in the Spanish Observatorio del Teide. N.S. acknowledges support by the ANR-11-BS56-010 project STARFICH and support from the Deutsche Forschungsgemeinschaft, DFG, through project number Os 177/2-1 and 177/2-2, central funds of the DFG-priority program 1573 (ISM-SPP), and the SFB 956. We thank the Calar Alto staff for the execution of our observations in Service Mode. We thank Stefan Geier, Jussi Harmanen, and Joonas Sario for some of the observations during their studentships at the NOT.
References
- Abbott, T. M., Aspin, C., Sorensen, A. N., et al. 2000, in Optical and IR Telescope Instrumentation and Detectors, eds. M. Iye, & A. F. Moorwood, Proc. SPIE, 4008, 714 [Google Scholar]
- Adams, F. C., Lada, C. J., & Shu, F. H. 1987, ApJ, 312, 788 [NASA ADS] [CrossRef] [Google Scholar]
- Allen, L. E., Calvet, N., D’Alessio, P., et al. 2004, ApJS, 154, 363 [NASA ADS] [CrossRef] [Google Scholar]
- Allen, L., Megeath, S. T., Gutermuth, R., et al. 2007, in Protostars and Planets V, eds. V. B. Reipurth, D. Jewitt, & K. Keil (Tucson: University of Arizona Press), 361 [Google Scholar]
- Andre, P., Ward-Thompson, D., & Barsony, M. 1993, ApJ, 406, 122 [NASA ADS] [CrossRef] [Google Scholar]
- Bertoldi, F. 1989, ApJ, 346, 735 [NASA ADS] [CrossRef] [Google Scholar]
- Beskrovnaya, N. G., Pogodin, M. A., Miroshnichenko, A. S., et al. 1999, A&A, 343, 163 [NASA ADS] [Google Scholar]
- Chabrier, G. 2005, in The Initial Mass Function 50 Years Later, eds. E. Corbelli, F. Palla, & H. Zinnecker, Astrophys. Space Sci. Lib., 327, 41 [Google Scholar]
- Cohen, M., Jones, B. F., & Walker, H. J. 1989, ApJ, 341, 908 [NASA ADS] [CrossRef] [Google Scholar]
- Comerón, F. 2011, A&A, 531, A33 [NASA ADS] [CrossRef] [EDP Sciences] [Google Scholar]
- Comerón, F., & Pasquali, A. 2012, A&A, 543, A101 [NASA ADS] [CrossRef] [EDP Sciences] [Google Scholar]
- Comerón, F., & Schneider, N. 2007, A&A, 473, 149 [NASA ADS] [CrossRef] [EDP Sciences] [Google Scholar]
- Comerón, F., & Torra, J. 1999, A&A, 349, 605 [NASA ADS] [Google Scholar]
- Comerón, F., Pasquali, A., Rodighiero, G., et al. 2002, A&A, 389, 874 [NASA ADS] [CrossRef] [EDP Sciences] [Google Scholar]
- Comerón, F., Schneider, N., & Russeil, D. 2005, A&A, 433, 955 [NASA ADS] [CrossRef] [EDP Sciences] [Google Scholar]
- Daemgen, S., Elliot Meyer, R., Jayawardhana, R., & Petr-Gotzens, M. G. 2016, A&A, 586, A12 [NASA ADS] [CrossRef] [EDP Sciences] [Google Scholar]
- Djupvik, A. A., & Andersen, J. 2010, in Highlights of Spanish Astrophysics V, Astrophys. Space Sci. Proc., 14, 211 [NASA ADS] [CrossRef] [Google Scholar]
- Evans, II, N. J., Dunham, M. M., Jørgensen, J. K., et al. 2009, ApJS, 181, 321 [NASA ADS] [CrossRef] [Google Scholar]
- Fukugita, M., Ichikawa, T., Gunn, J. E., et al. 1996, AJ, 111, 1748 [NASA ADS] [CrossRef] [Google Scholar]
- Getman, K. V., Feigelson, E. D., Garmire, G., Broos, P., & Wang, J. 2007, ApJ, 654, 316 [NASA ADS] [CrossRef] [Google Scholar]
- Getman, K. V., Feigelson, E. D., Sicilia-Aguilar, A., et al. 2012, MNRAS, 426, 2917 [NASA ADS] [CrossRef] [Google Scholar]
- Greene, T. P., Wilking, B. A., Andre, P., Young, E. T., & Lada, C. J. 1994, ApJ, 434, 614 [NASA ADS] [CrossRef] [Google Scholar]
- Gritschneder, M., Naab, T., Walch, S., Burkert, A., & Heitsch, F. 2009, ApJ, 694, L26 [NASA ADS] [CrossRef] [Google Scholar]
- Gutermuth, R. A., Myers, P. C., Megeath, S. T., et al. 2008, ApJ, 674, 336 [NASA ADS] [CrossRef] [Google Scholar]
- Gutermuth, R. A., Megeath, S. T., Myers, P. C., et al. 2009, ApJS, 184, 18 [NASA ADS] [CrossRef] [Google Scholar]
- Hayashi, M., Itoh, Y., & Oasa, Y. 2012, PASJ, 64 [Google Scholar]
- Hernández, J., Calvet, N., Briceño, C., Hartmann, L., & Berlind, P. 2004, AJ, 127, 1682 [NASA ADS] [CrossRef] [Google Scholar]
- Indebetouw, R., Mathis, J. S., Babler, B. L., et al. 2005, ApJ, 619, 931 [NASA ADS] [CrossRef] [Google Scholar]
- Ishii, M., Nagata, T., Sato, S., et al. 2001, AJ, 121, 3191 [NASA ADS] [CrossRef] [Google Scholar]
- Knödlseder, J. 2000, A&A, 360, 539 [NASA ADS] [Google Scholar]
- Kraus, S., Hofmann, K.-H., Benisty, M., et al. 2008, A&A, 489, 1157 [NASA ADS] [CrossRef] [EDP Sciences] [Google Scholar]
- Kronberger, M., Teutsch, P., Alessi, B., et al. 2006, A&A, 447, 921 [NASA ADS] [CrossRef] [EDP Sciences] [Google Scholar]
- Kroupa, P. 2001, MNRAS, 322, 231 [NASA ADS] [CrossRef] [Google Scholar]
- Kumar, M. S. N., Keto, E., & Clerkin, E. 2006, A&A, 449, 1033 [NASA ADS] [CrossRef] [EDP Sciences] [Google Scholar]
- Lada, C. J., & Wilking, B. A. 1984, ApJ, 287, 610 [NASA ADS] [CrossRef] [Google Scholar]
- Lejeune, T., & Schaerer, D. 2001, A&A, 366, 538 [NASA ADS] [CrossRef] [EDP Sciences] [Google Scholar]
- Li, M., & Xiao, L. 2016, ApJ, 820, 36 [NASA ADS] [CrossRef] [Google Scholar]
- Liszt, H. 2014, ApJ, 783, 17 [NASA ADS] [CrossRef] [Google Scholar]
- Luhman, K. L., Allen, P. R., Espaillat, C., Hartmann, L., & Calvet, N. 2010, ApJS, 186, 111 [NASA ADS] [CrossRef] [Google Scholar]
- Lumsden, S. L., Puxley, P. J., Hoare, M. G., Moore, T. J. T., & Ridge, N. A. 2003, MNRAS, 340, 799 [NASA ADS] [CrossRef] [Google Scholar]
- Megeath, S. T., Allen, L. E., Gutermuth, R. A., et al. 2004, ApJS, 154, 367 [NASA ADS] [CrossRef] [Google Scholar]
- Niwa, T., Tachihara, K., Itoh, Y., et al. 2009, A&A, 500, 1119 [NASA ADS] [CrossRef] [EDP Sciences] [Google Scholar]
- Offner, S. S. R., Clark, P. C., Hennebelle, P., et al. 2014, in Protostars and Planets VI, eds. H. Beuther, R. S. Klessen, C. P. Dullemand & T. Henning (Tucson: University of Arizona Press), 53 [Google Scholar]
- Palla, F., & Stahler, S. W. 1999, ApJ, 525, 772 [NASA ADS] [CrossRef] [Google Scholar]
- Reipurth, B., & Schneider, N. 2008, Handbook of Star Forming Region I, Vol. 4, 36 [Google Scholar]
- Rivera-Gálvez, S., Román-Zúñiga, C. G., Jiménez-Bailón, E., et al. 2015, AJ, 150, 191 [NASA ADS] [CrossRef] [Google Scholar]
- Rossi, C., Errico, L., Friedjung, M., et al. 1999, A&AS, 136, 95 [NASA ADS] [CrossRef] [EDP Sciences] [Google Scholar]
- Rygl, K. L. J., Brunthaler, A., Sanna, A., et al. 2012, A&A, 539, A79 [NASA ADS] [CrossRef] [EDP Sciences] [Google Scholar]
- Sarre, P. J. 2006, J. Mol. Spectrosc., 238, 1 [NASA ADS] [CrossRef] [Google Scholar]
- Schneider, N., Simon, R., Bontemps, S., Comerón, F., & Motte, F. 2007, A&A, 474, 873 [NASA ADS] [CrossRef] [EDP Sciences] [Google Scholar]
- Schneider, N., Güsten, R., Tremblin, P., et al. 2012, A&A, 542, L18 [Google Scholar]
- Schneider, N., Bontemps, S., Motte, F., et al. 2016, A&A, 591, A40 [NASA ADS] [CrossRef] [EDP Sciences] [Google Scholar]
- Sicilia-Aguilar, A., Roccatagliata, V., Getman, K., et al. 2014, A&A, 562, A131 [NASA ADS] [CrossRef] [EDP Sciences] [Google Scholar]
- Skrutskie, M. F., Cutri, R. M., Stiening, R., et al. 2006, AJ, 131, 1163 [NASA ADS] [CrossRef] [Google Scholar]
- Staude, H. J., Lenzen, R., Dyck, H. M., & Schmidt, G. D. 1982, ApJ, 255, 95 [NASA ADS] [CrossRef] [Google Scholar]
- Stetson, P. B. 1987, PASP, 99, 191 [NASA ADS] [CrossRef] [Google Scholar]
- Sugitani, K., Tamura, M., Nakajima, Y., et al. 2002, ApJ, 565, L25 [NASA ADS] [CrossRef] [Google Scholar]
- Testi, L., Palla, F., & Natta, A. 1998, A&AS, 133, 81 [NASA ADS] [CrossRef] [EDP Sciences] [Google Scholar]
- Thompson, M. A., Urquhart, J. S., Moore, T. J. T., & Morgan, L. K. 2012, MNRAS, 421, 408 [NASA ADS] [Google Scholar]
- Tremblin, P., Audit, E., Minier, V., Schmidt, W., & Schneider, N. 2012, A&A, 546, A33 [NASA ADS] [CrossRef] [EDP Sciences] [Google Scholar]
- Vink, J. S., Drew, J. E., Steeghs, D., et al. 2008, MNRAS, 387, 308 [NASA ADS] [CrossRef] [Google Scholar]
- Walborn, N. R. 1980, ApJS, 44, 535 [NASA ADS] [CrossRef] [Google Scholar]
- White, R. J., Greene, T. P., Doppmann, G. W., Covey, K. R., & Hillenbrand, L. A. 2007, Protostars and Planets V, eds. V. B. Reipurth, D. Jewitt, & K. Keil (Tucson: University of Arizona Press), 117 [Google Scholar]
- Wright, N. J., Parker, R. J., Goodwin, S. P., & Drake, J. J. 2014, MNRAS, 438, 639 [NASA ADS] [CrossRef] [Google Scholar]
- Wright, N. J., Drew, J. E., & Mohr-Smith, M. 2015, MNRAS, 449, 741 [NASA ADS] [CrossRef] [Google Scholar]
- Zacharias, N., Finch, C. T., Girard, T. M., et al. 2013, AJ, 145, 44 [NASA ADS] [CrossRef] [EDP Sciences] [Google Scholar]
All Tables
All Figures
|
Fig. 1 Spitzer2 IRAC 3.6 μm image of the central Cygnus X region including the globule (indicated by a dashed circle and located at α2000 = 20h33m49.3s and δ2000 = 40°08′52′′). The most massive stars of the Cyg OB2 association are indicated with grey stars and the approximate center (e.g. Wright et al. 2015) with a white cross. The H II regions DR15, 18, 20, and 22 are indicated. |
| In the text | |
|
Fig. 2 JHKS RGB combined image of a 15 ′ × 15′ field centred on the globule at α2000 = 20h33m49.3s and δ2000 = 40°08′52′′ obtained with Omega2000. North up and east left. |
| In the text | |
|
Fig. 3 IRAC [3.6] − [4.5] / [5.8] − [8.0] diagram for the sample of 316 sources with photometric errors <0.2 mag in all bands (black dots) and the selected Class I (red squares) and Class II (green circles) candidates using the criteria given in the text. The location of the three sources A, B and C are marked with blue star symbols. The direction and size of the reddening vector for AK = 3 mag is according to empirical relations for the IRAC bands by Indebetouw et al. (2005). |
| In the text | |
|
Fig. 4 J−H/K− [4.5] diagram for the sample of 2116 sources with photometric errors <0.2 mag in these bands (black dots). The already classified YSO candidates are shown with red squares (Class I) and green circles (Class II). The location of the bright sources A, B and C, of which A and C are resolved doubles in the near-IR, are marked with blue stars. Some sources have upper limits only in the J band. Some have lower limits due to saturation in the 4.5 μm band. The slope of the reddening band is indicated as a dashed line. |
| In the text | |
|
Fig. 5 Omega2000 J−H/H−KS diagram for 3435 sources with errors <0.06 mag in all bands (black dots). The empirical reddening vector (dashed line) has a slope of 1.97. We have overlaid the positions of known Class Is (red squares), Class IIs (green circles), and the stars A, B and C (blue stars). The nine new YSO candidates (magenta triangles) are sources with K-band excess not already extracted using the previous two CC diagrams. |
| In the text | |
|
Fig. 6 Spatial distribution of the YSO candidates overlaid on the Omega2000 15′ × 15′ H2v = 1–0 S(1) image. Class Is (red squares), Class IIs (green circles), additional YSOs with 4.5 μm excess (blue plus signs) and K-band excesses (magenta diamonds) not otherwise classified. The black circle has a radius of 1′ (0.4 pc) and shows the approximate extent of the cluster in the globule head. |
| In the text | |
|
Fig. 7 Close-up view of the globule in RGB-coded colours where red is the H2 image, green is H and blue is J from Omega2000, N up E left. YSOs are marked as in Fig. 6 and the three bright stars A, B and C are labeled above (north of) the stars. The two circles indicate radii of 0.2 and 0.4 pc from star A. |
| In the text | |
|
Fig. 8 NOTCam JHKS 9′′ zoom-in on star A, resolved in two components with separation 0 |
| In the text | |
|
Fig. 9 Observed SEDs of the stars A, B and C. The double sources A (0 |
| In the text | |
|
Fig. 10 Slit positions and widths overlaid on NOTCam high-resolution K-band image zoomed in to 50″× 40″. Three near-IR slit positions (red) across the double sources stars A and C, and the single source B, and the optical slit (blue) across stars A and B and the Nebula. |
| In the text | |
|
Fig. 11 Optical spectrum of star A. Note the absorption lines of helium at 5875 Å and 6678 Å. |
| In the text | |
|
Fig. 12 Optical spectrum of star B. Note the absorption lines of helium at 5875 Å and 6678 Å. |
| In the text | |
|
Fig. 13 Medium-resolution (R = 5500) normalised K-band spectra of the two 0 |
| In the text | |
|
Fig. 14 Low-resolution (R = 2100) K-band spectra of the three brightest stars. Star A shows both components unresolved, star B is apparently single, and star C is well resolved into the NE and SW components. The spectra are offset by unity on the y-axis. |
| In the text | |
|
Fig. 15 Histogram of the distribution of stellar masses in the globule aggregate, according to the derived values listed in Table 4. An age of 1 Myr has been assumed. |
| In the text | |
|
Fig. 16 Globule colour–coded with H2 emission (red), Brγ (green), and J-band (blue). |
| In the text | |
|
Fig. 17 Visible-red spectrum of the H II region. The intensity ratio of [S II] lines at 6717 and 6731 indicates an electron density ne ≃ 200 cm-3. The marginal detection of He I at 6678 Å (see inset) and the non-detection of He I at 5875 Å indicate a soft ionising radiation like that expected from the early B stars embedded in the globule. |
| In the text | |
Current usage metrics show cumulative count of Article Views (full-text article views including HTML views, PDF and ePub downloads, according to the available data) and Abstracts Views on Vision4Press platform.
Data correspond to usage on the plateform after 2015. The current usage metrics is available 48-96 hours after online publication and is updated daily on week days.
Initial download of the metrics may take a while.