Fig. 4
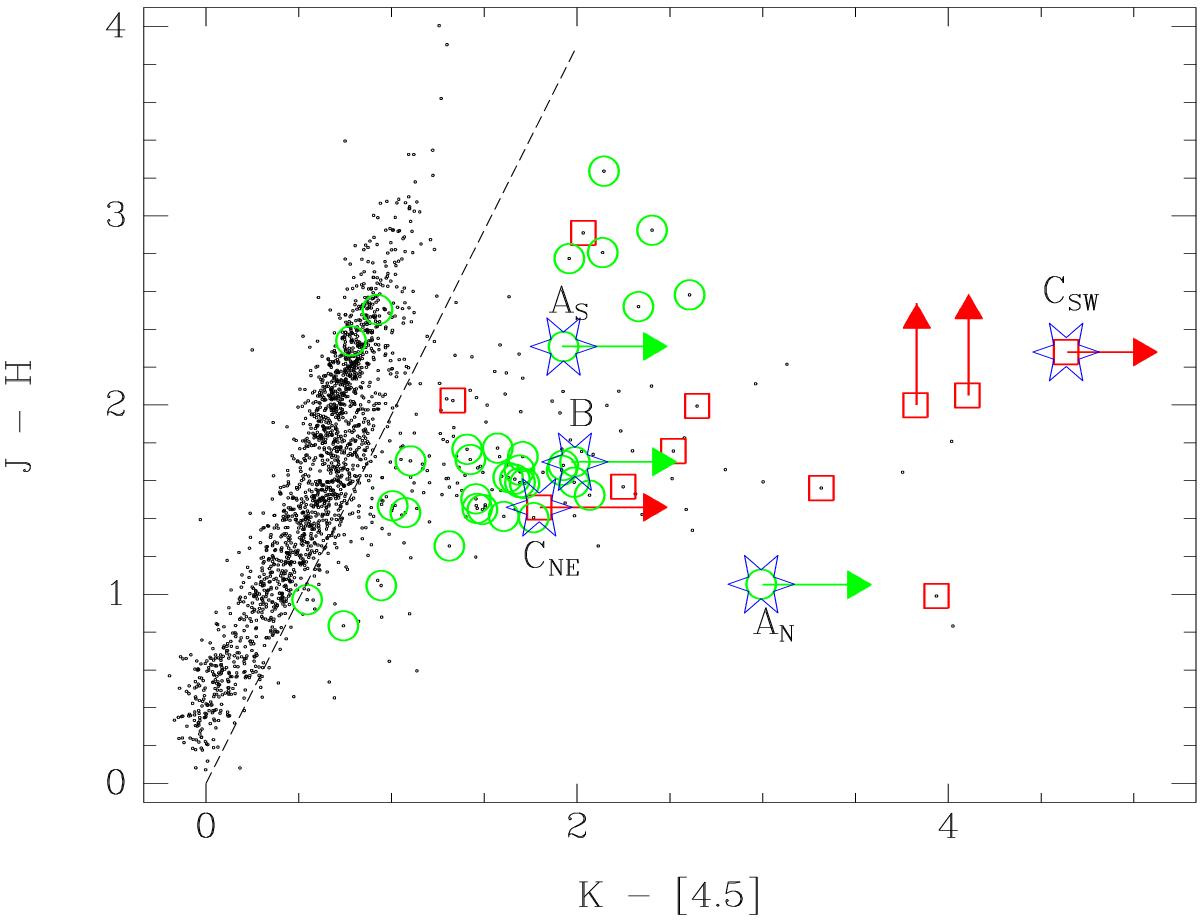
J−H/K− [4.5] diagram for the sample of 2116 sources with photometric errors <0.2 mag in these bands (black dots). The already classified YSO candidates are shown with red squares (Class I) and green circles (Class II). The location of the bright sources A, B and C, of which A and C are resolved doubles in the near-IR, are marked with blue stars. Some sources have upper limits only in the J band. Some have lower limits due to saturation in the 4.5 μm band. The slope of the reddening band is indicated as a dashed line.
Current usage metrics show cumulative count of Article Views (full-text article views including HTML views, PDF and ePub downloads, according to the available data) and Abstracts Views on Vision4Press platform.
Data correspond to usage on the plateform after 2015. The current usage metrics is available 48-96 hours after online publication and is updated daily on week days.
Initial download of the metrics may take a while.