Fig. 3
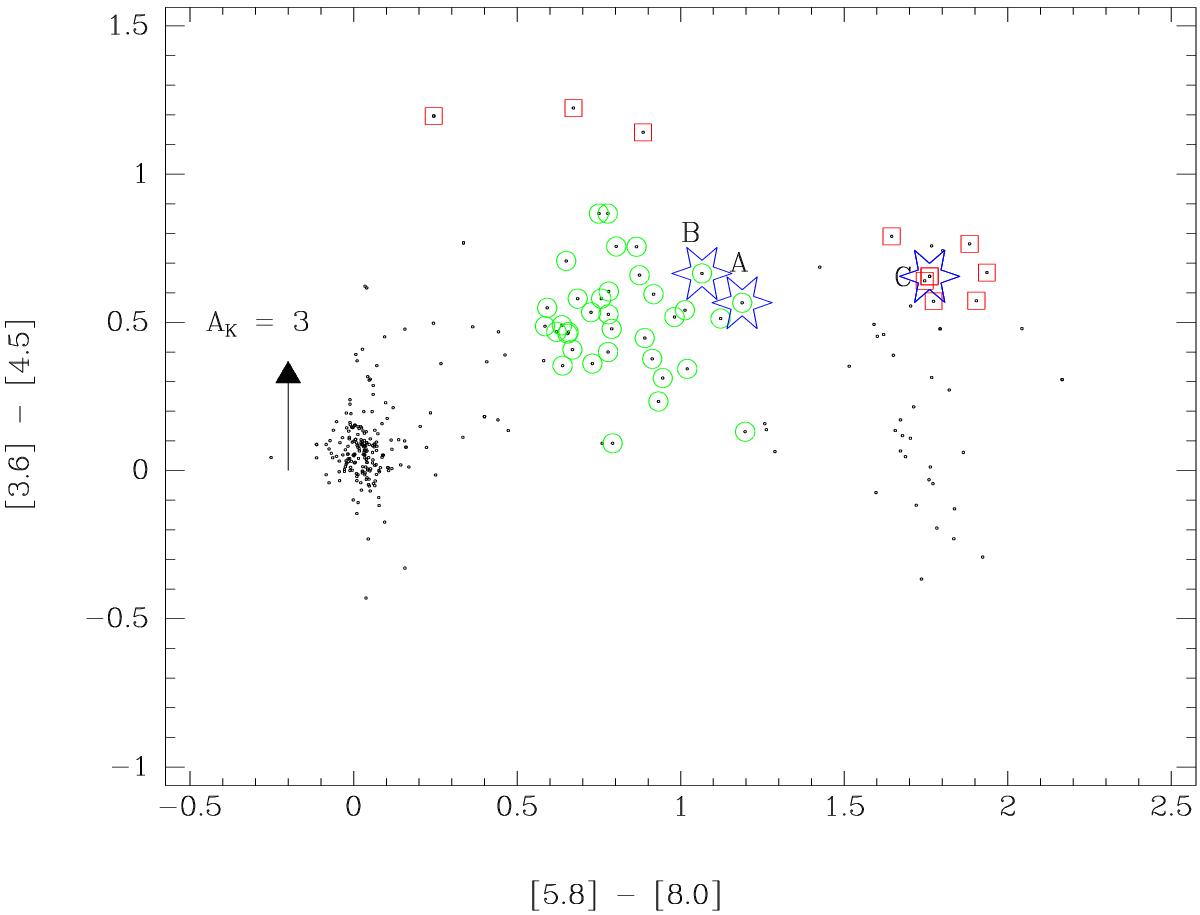
IRAC [3.6] − [4.5] / [5.8] − [8.0] diagram for the sample of 316 sources with photometric errors <0.2 mag in all bands (black dots) and the selected Class I (red squares) and Class II (green circles) candidates using the criteria given in the text. The location of the three sources A, B and C are marked with blue star symbols. The direction and size of the reddening vector for AK = 3 mag is according to empirical relations for the IRAC bands by Indebetouw et al. (2005).
Current usage metrics show cumulative count of Article Views (full-text article views including HTML views, PDF and ePub downloads, according to the available data) and Abstracts Views on Vision4Press platform.
Data correspond to usage on the plateform after 2015. The current usage metrics is available 48-96 hours after online publication and is updated daily on week days.
Initial download of the metrics may take a while.