| Issue |
A&A
Volume 598, February 2017
|
|
|---|---|---|
| Article Number | A69 | |
| Number of page(s) | 10 | |
| Section | Stellar structure and evolution | |
| DOI | https://doi.org/10.1051/0004-6361/201629744 | |
| Published online | 01 February 2017 | |
EXTraS discovery of two pulsators in the direction of the LMC: a Be/X-ray binary pulsar in the LMC and a candidate double-degenerate polar in the foreground
1 Max-Planck-Institut für extraterrestrische Physik, Giessenbachstraße, 85748 Garching, Germany
e-mail: This email address is being protected from spambots. You need JavaScript enabled to view it.
2 INAF, Osservatorio Astronomico di Roma, via Frascati 33, 00040 Monteporzio Catone, Italy
3 INAF, Istituto di Astrofisica Spaziale e Fisica Cosmica Milano, via E. Bassini 15, 20133 Milano, Italy
4 Anton Pannekoek Institute for Astronomy, University of Amsterdam, Postbus 94249, 1090- GE Amsterdam, The Netherlands
5 Scuola Universitaria Superiore IUSS Pavia, piazza della Vittoria 15, 27100 Pavia, Italy
6 INFN – Istituto Nazionale di Fisica Nucleare, Sezione di Pavia, via A. Bassi 6, 27100 Pavia, Italy
7 CNR, Istituto di Matematica Applicata e Tecnologie Informatiche, via de Marini 6, 16149 Genova, Italy
8 Warsaw University Observatory, Aleje Ujazdowskie 4, 00-478 Warsaw, Poland
Received: 19 September 2016
Accepted: 10 October 2016
Abstract
Context. The Exploring the X-ray Transient and variable Sky (EXTraS) project searches for coherent signals in the X-ray archival data of XMM-Newton.
Aims. XMM-Newton performed more than 400 pointed observations in the region of the Large Magellanic Cloud (LMC). We inspected the results of the EXTraS period search to systematically look for new X-ray pulsators in our neighbour galaxy.
Methods. We analysed the XMM-Newton observations of two sources from the 3XMM catalogue which show significant signals for coherent pulsations.
Results. 3XMM J051259.8-682640 was detected as a source with a hard X-ray spectrum in two XMM-Newton observations, revealing a periodic modulation of the X-ray flux with 956 s. As optical counterpart we identify an early-type star with Hα emission. The OGLE I-band light curve exhibits a regular pattern with three brightness dips which mark a period of ~1350 d. The X-ray spectrum of 3XMM J051034.6-670353 is dominated by a super-soft blackbody-like emission component (kT ~ 70 eV) which is modulated by nearly 100% with a period of ~1418 s. From GROND observations we suggest a star with r′ = 20.9 mag as a possible counterpart of the X-ray source.
Conclusions. 3XMM J051259.8-682640 is confirmed as a new Be/X-ray binary pulsar in the LMC. We discuss the long-term optical period as the likely orbital period which would be the longest known from a high-mass X-ray binary. The spectral and temporal properties of the super-soft source 3XMM J051034.6-670353 are very similar to those of RX J0806.3+1527 and RX J1914.4+2456 suggesting that it belongs to the class of double-degenerate polars and is located in our Galaxy rather than in the LMC.
Key words: galaxies: star clusters: individual: Large Magellanic Cloud / galaxies: stellar content / stars: emission-line, Be / stars: neutron / binaries: close / novae, cataclysmic variables
© ESO, 2017
1. Introduction
One of the aims of the Exploring the X-ray Transient and variable Sky (EXTraS) project is to search systematically for coherent X-ray pulsations in the data obtained by the XMM-Newton European Photon Imaging Cameras (EPIC), including pn (Strüder et al. 2001) and MOS-type (Turner et al. 2001) CCD detectors. Selected from the XMM-Newton EPIC Serendipitous Source Catalogue (3XMM, Rosen et al. 2016), the X-ray sources span six orders of magnitude in flux (10-9 to 10-15 erg cm-2 s-1 in the 0.2–12 keV energy band). For further information about the EXTraS project, which also covers other aspects of characterising the temporal properties of the XMM-Newton sources, see De Luca et al. (2016) or the project web site1. The results from the EXTraS project including analysis software will be made public after the end of the project.
One of the first results from the EXTraS project was the discovery of a 1.2 s modulation in the X-ray flux of a source located in an external spiral arm of our neighbour galaxy M 31 (Esposito et al. 2016). The source, 3XMM J004301.4+413017, is the first accreting neutron star found in M 31 in which the spin period has been detected (see also Zolotukhin et al. 2016). Many XMM-Newton observations covered the source, which revealed an orbital modulation at 1.27 d and made it possible to study the long-term properties of the source.
Inspired by the work on the X-ray pulsar in M 31, we inspected the EXTraS results of the automated period search from all currently available archival XMM-Newton observations (more than 400) in the direction of the Large Magellanic Cloud (LMC) to identify sources with hitherto unknown X-ray pulse periods.
XMM-Newton observations of 3XMM J051259.8−682640 and 3XMM J051034.6−670353.
A number of high-mass X-ray binary (HMXB) pulsars are known in this galaxy (for a recent compilation see Antoniou & Zezas 2016) with several recent discoveries based on the XMM-Newton survey of a ~10 square degree area covering the central part of the LMC (Maggi et al. 2013; Vasilopoulos et al. 2013, 2014, 2016). To date, pulse periods from 17 HMXBs in the LMC have been published with periods between 0.069 s and 2567 s, with the bulk between 10 s and 300 s. HMXBs are binary systems composed of a compact object and an early-type star. In a subgroup of HMXBs, namely the Be/X-ray binaries (BeXRBs, e.g. Reig 2011), the compact object (typically a neutron star) accretes matter from the equatorial decretion disk surrounding a Be star (Okazaki 2001; Ziolkowski 2002). Pulsations detected in the X-ray flux from these systems indicate the spin period of the neutron star.
The LMC is also well known for its super-soft X-ray sources (SSSs), which form a heterogeneous class of objects (Greiner 1996; Kahabka et al. 2008). Many SSSs are luminous (~1036 to ~1038 erg s-1) and have soft blackbody-like X-ray spectra with kT ~ 20–80 eV and can be detected in external galaxies. They can be explained by stable nuclear burning white dwarfs (WDs) accreting H-rich matter from a companion star (van den Heuvel et al. 1992). In M 31, optical novae constitute the major class of SSSs (Pietsch et al. 2006; Henze et al. 2014). Pulsations in the X-ray flux, suggesting the spin period of the WD, have been detected in several SSSs in M 31. The bright persistent SSS XMMU J004252.5+411540 shows a periodic modulation with a period of 217 s (Trudolyubov & Priedhorsky 2008) in the X-ray emission, which is most likely powered by steady burning of H-rich matter on the surface of the WD. Two other sources are likely associated with optical novae in their SSS state: XMMU J004319.4+411759 with a period of 865 s, which decreased significantly in flux (by a factor ~8) between two XMM-Newton observations about half a year apart (Osborne et al. 2001), and M31N 2007-12b, discovered in the optical during its nova outburst and detected by XMM-Newton in its SSS state, which shows 1110 s pulsations (Pietsch et al. 2011). The luminosity of M31N 2007-12b during maximum was around the Eddington limit of a massive WD and dropped by ~30% in an observation 60 d after outburst. The size of the photosphere with a radius of about 6000 km is consistent with emission from the full WD surface.
Soft blackbody-like emission is also observed from magnetic cataclysmic variables like AM Her-type systems (polars, Cropper 1990) or soft intermediate polars (Haberl & Motch 1995; Burwitz et al. 1996; Anzolin et al. 2008). While in polars the rotation of the highly magnetised WD is synchronous with the orbital revolution (typical periods longer than 1 h), the rotation period of WDs in intermediate polars can be as short as one-thousandth of the orbital period with typical spin periods of a few hundred seconds (Kuulkers et al. 2006). Double-degenerate binaries, i.e. systems hosting two interacting WDs, can have orbital periods as short as a few minutes. Such a framework is discussed for RX J1914.4+2456 (Cropper et al. 1998) and RX J0806.3+1527 (Esposito et al. 2014).
In this paper we present the discovery of X-ray pulsations from two sources located in the direction of the LMC, in the context of the EXTraS project. 3XMM J051259.8−682640 is a known candidate as a BeXRB from positional coincidence, but no pulse period has been detected yet. Apart from a possible detection with ROSAT, nothing is known about 3XMM J051034.6−670353. In Sect. 2 we describe the X-ray observations and the analysis methods and in Sect. 3 the results from our temporal and spectral analyses. We discuss our results in Sect. 4.
2. XMM-Newton observations and analysis
From the inspection of the EXTraS results we found two sources from the 3XMM-DR6 catalogue (Rosen et al. 2016) located in the direction of the LMC which show significant pulsations (close to or above the 3.5σ confidence threshold). The first, 3XMM J051259.8−682640, was observed twice by XMM-Newton in August 2012 within six days (see Table 1), unfortunately not covered by all the instruments because of the large off-axis angle in observation 0690742301 and the missing CCDs. The second source, 3XMM J051034.6−670353, was observed in May and June 2014.
We re-processed the EPIC data using XMM-Newton SAS 15.0.02 to create event lists using the most recent software and calibration files. In particular, SAS 15 includes a correction of the conversion between celestial and detector coordinate systems3 while the 3XMM catalogue contains source positions determined with older SAS versions (up-to-date at the time of the observation). We extracted the events to produce spectra and light curves from circular regions around the source positions and nearby blank-sky areas. Single- and double-pixel events (PATTERN 0−4) were selected from pn data, while we used singles to quadruples (PATTERN 0−12) from MOS, in both cases excluding bad CCD pixels and columns (FLAG 0). For the EPIC spectra we removed times of increased flaring activity when the background was above a threshold of 8 and 2.5 counts ks-1 arcmin-2 (7.0−15.0 keV band) for the EPIC-pn and EPIC-MOS detectors, respectively. To avoid time gaps in the time series we did not use this technique in the production of light curves. In particular the low energy bands are barely affected by the flares. EPIC spectra were re-binned to have at least 20 counts per bin and the SAS tasks arfgen and rmfgen were used to generate the corresponding detector response files. The X-ray spectra were analysed with the spectral fitting package XSPEC 12.9.0o4 (Arnaud 1996). Errors are specified for 68% confidence, unless otherwise stated.
3. Results
3.1. Temporal and spectral X-ray analysis
The EXTraS pipeline to detect periodic signals in power spectra of time series from 3XMM sources is based on the algorithm described in Israel & Stella (1996). The pipeline uses archival event files selecting a standard energy band of 0.2−10 keV. After the identification of new candidate pulsators, we performed a more detailed analysis of the sources using the re-processed event files. To determine the most probable spin period together with the 1σ uncertainty, we followed the Bayesian approach as described by Gregory & Loredo (1996) and applied by Haberl et al. (2008).
3.1.1. 3XMM J051259.8−682640
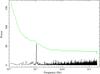 |
Fig. 1 Power spectrum for 3XMM J051259.8−682640 obtained from EPIC pn data (observation 0690742601) produced by the EXTraS project in the 0.2−10 keV band. The green line indicates the 3.5σ confidence level. |
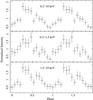 |
Fig. 2 EPIC pn light curves in different energy bands for 3XMM J051259.8−682640 folded at a period of 956.2 s (observation 0690742601). |
Spectral fit results.
The power spectrum of 3XMM J051259.8−682640 revealed a peak at a frequency near 10-3 Hz (Fig. 1). Using the EPIC-pn data in the 0.2−10 keV band from observation 0690742601 we determined the period to 956.2 ± 1.5 s. The folded light curve in the full energy band of 0.2−10 keV exhibits a slightly skewed sinusoidal profile (Fig. 2) with a pulsed fraction of 47% (uncertainty of 6%, pulsed flux relative to the total). Dividing the energies into two bands (0.2−1.5 keV and 1.5−10 keV) produces no significant differences in the pulse profiles and pulsed fractions compatible within the uncertainties (60% ± 8.5% and 46% ± 7.5%, respectively). For a more detailed analysis of the energy dependence of the pulse profile, data with higher statistical quality are needed.
We modelled the EPIC spectra of 3XMM J051259.8–682640 with a simple power law, attenuated by two photoelectric absorption components (model phabs*vphabs*powerlaw in XSPEC). For the foreground absorption in the Galaxy we assumed a column density of NH,gal = 5.8 × 1020 cm-2 (Dickey & Lockman 1990) with solar abundances according to Wilms et al. (2000) and a free column density, NH,lmc, with abundances set to 0.5 solar accounting for absorption by the interstellar medium of the LMC and local to the source. This model provides acceptable fits to the spectra of observation 0670742301 (pn) and 0670742601 (simultaneous fit to pn and MOS2 with a normalisation factor – best-fit value 1.06 – to allow for cross-calibration uncertainties; see Table 2). The spectra with the best-fit model from observation 0670742601 are presented in Fig. 3. There is evidence for a spectral change between the two observations with a steeper spectrum during the later observation. Confidence contours for NH,lmc and photon index for the two observations are compared in Fig. 4.
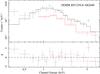 |
Fig. 3 EPIC pn and MOS2 spectra of 3XMM J051259.8−682640 from observation 0690742601 together with the best-fit model consisting of an absorbed power law. |
3.1.2. 3XMM J051034.6−670353
The power spectra of 3XMM J051034.6−670353 revealed highly significant peaks at a frequency of ~7.1 × 10⁻⁴ Hz (Fig. 5). Using the Bayesian technique, periods of 1417.4 ± 1.1 s and 1419.4 ± 1.2 s were derived for observations 0741800201 and 0741800301, respectively. The folded light curve (Fig. 6) exhibits a deep modulation with little flux for more than one-third of the period.
We modelled the EPIC spectra of 3XMM J051034.6–670353 with blackbody emission and a free column density with solar abundances. To account for a weak hard tail in the pn spectrum we added a bremsstrahlung component attenuated by the same amount of absorption (model phabs*(brems+bbody) in XSPEC). This component is not well constrained and we fixed the temperature at 10 keV. With this model, we fitted the spectra from the two observations individually, simultaneously assuming no change in spectral shape, i.e. allowing only a constant factor between the spectra. The EPIC pn spectra together with the simultaneous best-fit model are shown in Fig. 7. The best-fit parameters for both types of fit are listed in Table 2. During observation 0741800301 the observed flux was lower by about 15%, but with consistent spectral parameters. This is consistent with the results of the simultaneous fit with acceptable quality of the fit for a constant factor of 0.84 ± 0.10 (90% confidence).
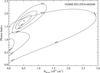 |
Fig. 4 Confidence contours for the LMC part of the column density, NH,lmc, and the photon index for 3XMM J051259.8−682640. The smaller contours are obtained from the second observation (0690742601). |
Given the higher statistical quality due to higher flux and longer exposure time (31.2 ks vs. 18.2 ks after background flare screening), we examine observation 0741800201 in the following. In the 0.2−10 keV band the observed flux of the bremsstrahlung component accounts for 29% of the total, which decreases to 12% when correcting for absorption, demonstrating the dominance of the soft component. If we assume the source is located in the LMC, at a distance of 50 kpc the bolometric luminosity of the blackbody component would be 1.05 × 1035 erg s-1, well below the range in which H-burning is expected to be stable (Wolf et al. 2013). The blackbody luminosity depends somewhat on the temperature and absorption derived from the spectral fit, but should be at most a factor of ~2 higher than the best-fit value (see Fig. 8). In addition, the radius of the emitting area of 180 km would be much smaller than the size of a WD. On the other hand, the X-ray luminosity would be too high to be explained by a magnetic cataclysmic variable in the LMC. If we assume the source to be located in the Milky Way, luminosity and radius of the emitting area are correspondingly smaller (e.g. for distances of 1 to 5 kpc: Lbol = 4.2 × 1031 to 1.05 × 1033 erg s-1 and r = 3.6 to 18 km).
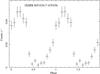 |
Fig. 6 Background-subtracted EPIC pn light curve of 3XMM J051034.6−670353 (observation 0741800201) in the 0.2−2 keV band folded at the period of 1417.4 s. |
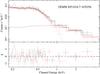 |
Fig. 7 EPIC pn spectra of 3XMM J051034.6−670353 (observation 0741800201 in black, 0741800301 in red) together with the best-fit model (full lines) consisting of absorbed blackbody and bremsstrahlung emission (dotted lines, dominating at low and high energies, respectively). |
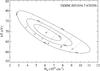 |
Fig. 8 Confidence contours for blackbody temperature and absorption column density derived from the EPIC pn spectrum of observation 0741800201, together with lines (dotted) of constant X-ray luminosity (0.1–2.4 keV, corrected for absorption). Luminosities are given in units of 1032 erg s-1 for an assumed distance of 5 kpc or 1034 erg s-1 for a source located in the LMC at 50 kpc. |
3.2. X-ray position and optical identification
X-ray coordinates of our two sources provided by the 3XMM-DR6 catalogue are listed in Table 1. For comparison, we performed source detection using SAS 15 following the standard procedures described in Sturm et al. (2013). The resulting positions differ by up to 3.7′′, considerably larger than the statistical errors and indicating dominant systematic errors.
3.2.1. 3XMM J051259.8−682640
The position of 3XMM J051259.8−682640 in the 3XMM-DR6 catalogue (combining the two detections) is given as RA (J2000) = 05h12m59 81 and Dec (J2000) = −68°26′40.̋7 with an uncertainty of ~0.7′′. This is ~3′′ from likely counterparts found in optical catalogues. Therefore, we considered only the EPIC data from observation 060742601 for our source detection with SAS 15. During this observation the source was closer to the optical axes of the telescopes, providing a factor of two more net counts at better spatial resolution than the other observation. This X-ray position (Table 1) is within 0.55′′ of 2MASS05125997−6826382 with J = 14.23 mag, H = 14.00 mag and K = 13.72 mag. This star is also listed in the Magellanic Clouds Photometric Survey (MCPS) catalogue of Zaritsky et al. (2004) with U = 13.883 mag, B = 14.874 mag and V = 14.740 mag, resulting in the reddening-free Q parameter (Q = U−B−0.72 × (B−V)) of −1.087 mag which together with optical brightness and colours is very typical for a BeXRB system (Haberl & Sturm 2016). Moreover, the star is known as a Hα emission line star, [BE74] 226 (Bohannan & Epps 1974), further supporting the identification of 3XMM J051259.8−682640 as BeXRB.
GROND photometry of stars near 3XMM J051034.6−670353.
3.2.2. 3XMM J051034.6−670353
The soft X-ray source 3XMM J051034.6−670353 was detected in both XMM-Newton observations which covered the source. The combined position in the 3XMM-DR6 catalogue is given with RA (J2000) = 05h10m3464 and Dec (J2000) = −67°03′53.3′′ (error ~0.74′′).
A marginal ROSAT PSPC detection (existence likelihood 13.3) of a weak source with (5.7 ± 4.0) × 10-3 cts s-1 was found in the LMC catalogue of Haberl & Pietsch (1999, entry 470). The angular distance of 5.3′′ is well within the positional uncertainty of 38′′ of the PSPC detection. The PSPC observation was performed between 1992 February 05 and 1992 April 28. Using the spectral model parameters derived from the EPIC pn spectrum (see below) an expected PSPC count rate of 5.8 × 10⁻³ cts s-1 was estimated. Considering the relatively large error on the count rate of the PSPC detection, this allows changes in flux by at most a factor of 3.5 (increase) or 1.7 (decrease) in 22 yr, suggesting a relatively stable source flux on long time scales.
Within 3′′ of the 3XMM-DR6 position, only one star with V ~ 21 is listed in the MCPS (angular separation 2.3′′) and the Optical Gravitational Lensing Experiment (OGLE) catalogue (Udalski et al. 2000, 2.6′′). With B = 21.11, V = 20.81, and I = 20.20 (MCPS) this object is relatively red.
To obtain deeper images of the area around 3XMM J051034.6−670353, we performed observations with the Gamma-ray Burst Optical Near-ir Detector (GROND, Greiner et al. 2008) at the MPG 2.2 m telescope in La Silla, Chile, on 2016 August 4. Integration times of 2160 s were obtained for the g′, r′, i′, and z′ filters and 1800 s for the J, H, and K bands. We analysed the data with the standard tools and methods described in Krühler et al. (2008). Photometric calibration for the g′, r′, i′, and z′ filter bands was obtained from an observation of a Sloan Digital Sky Survey (SDSS) standard star field. The J, H, and K photometry was calibrated using selected 2MASS stars (Skrutskie et al. 2006). We derived the AB magnitudes (without correction for foreground reddening) for the three brightest objects near the X-ray position of 3XMM J051034.6−670353 (see Fig. 9); they are listed in Table 3. In Fig. 9 we also show for comparison the SDSS magnitudes (data release 7, Abazajian et al. 2009) for the double degenerate system RX J0806.3+1527 and for the soft intermediate polar PQ Gem.
The position of the MCPS star (RA = 05h10m3494 and Dec = −67°03′54.7′′) is consistent with Star 2. The GROND colours are also consistent with a red object. Among the three stars only Star 1 shows a blue spectral energy distribution in the GROND filters which resembles that of RX J0806.3+1527, although not as steep as that of the likely double degenerate system. The DR6 and SAS 15 X-ray positions derived from observation 0741800201 are both compatible with Star 1 being the optical counterpart, while Star 3 is probably too far away (Fig. 9). The coordinates derived from observation 0741800301 (DR6 and SAS 15) are 2−3′′ away from Star 1 and are not compatible with those from observation 0741800201. Therefore, we inspected the EPIC images and our SAS 15 source detection lists to identify potential QSOs which can be used as reference system for astrometric alignment. Using Vizier5 we found three QSOs which all show a systematic shift between optical and X-ray positions derived from observation 0741800301 (average +0.18 s in RA and +2.1′′ in Dec). This correction is applied to the coordinates given in Table 1. For observation 0741800201 the shifts are negligible with respect to the statistical errors and no correction was applied. From positional coincidence, we consider Star 1 to be the most likely counterpart of the X-ray source.
 |
Fig. 9 GROND r′ band image of the region around 3XMM J051034.6−670353 obtained on 2016 August 4, with an exposure time of 2160 s. For each of the two XMM-Newton observations the X-ray positions as provided in the 3XMM-DR6 catalogue (yellow circles) and from our source detection with SAS 15 (red circles) are marked. The green circle is centred on the position we derived (SAS 15) from observation 0741800301 after astrometric alignment using three QSOs. For the other observation no astrometric correction was required. Positional errors (1σ) listed in Table1 are used for the circle radii. For the three brightest objects closest to the X-ray positions (labelled Star 1, 2, and 3, anticlockwise with increasing distance) photometry was conducted in the seven GROND bands. |
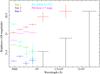 |
Fig. 10 GROND photometry for the three brightest stars (see Fig. 9) near the X-ray position of 3XMM J051034.6−670353. The black symbols indicate upper limits (the same for all stars with non-detections). The SDSS magnitudes for RX J0806.3+1527 and PQ Gem (shifted by 7 mag) are also plotted. |
3.3. OGLE data
The regions around both of our X-ray sources were monitored regularly in the I and V bands during phases III and IV of the OGLE (Udalski et al. 2008, 2015). Images were taken in both V and I filter bands, while photometric magnitudes are calibrated to the standard VI system. The optical counterpart of 3XMM J051259.8−682640 and Star 2 in the error circle of 3XMM J051034.6−670353 were covered by OGLE III and IV; unfortunately, Star 1 was located just outside of the CCD frame during phase IV.
3.3.1. 3XMM J051259.8−682640
From the optical counterpart of 3XMM J051259.8−682640 almost 15 yr of OGLE I-band data are available (see Fig. 11). The light curve exhibits a remarkable pattern with three deep intensity dips which are equally spaced by about 1350 d and are ~100 d wide. The first of the dips was preceded by an increase in brightness of ~0.1 mag in the I band followed by a decrease of ~0.25 mag. The next two dips occurred without brightening; however, they reached about the same minimum of 14.8 mag, in comparison to the level of ~14.6 mag before the dips. After recovery from the last dip, the brightness only reached a level of 14.65 mag, and no fourth dip is seen at the expected time.
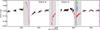 |
Fig. 11 OGLE I-band light curve of 3XMM J051259.8−682640 between October 2001 and April 2016. The vertical solid lines mark the minima of the dips with a recurrence time of 1350 d. The vertical dashed lines indicate the times of the XMM-Newton observations. |
OGLE V-band observations provided a less frequent coverage of the BeXRB system than the I-band observations. To compute the I−V colour index we directly used I- and V-band values when available from the same night. Additionally, if I-band magnitudes were obtained less than four days before and after the V-band measurements, we interpolated the I-band magnitudes. The colour index I−V is shown as a function of the I magnitude in Fig. 12. Data taken around the intensity dips are marked in red in Figs. 11 and 12.
3.3.2. 3XMM J051034.6−670353
The OGLE I-band light curves of Star 1 and Star 2 are presented in Fig. 13. The brightness of both stars is constant on time scales of years, but shows some scatter (2 mag and 1.2 mag for Star 1 and 2, respectively) around the average that is larger than the typical error bar drawn in the figure.
4. Discussion
From a systematic search for periodic variations in the X-ray flux of sources in the 3XMM catalogue within the EXTraS programme, we discovered two pulsators in the direction of the LMC.
4.1. 3XMM J051259.8−682640
The first pulsar, 3XMM J051259.8−682640, is characterised by a period of 956 s and a power-law X-ray spectrum. It can clearly be identified as a new BeXRB pulsar in the LMC, making it the 18th high-mass X-ray binary pulsar in our neighbour galaxy. We identify the optical counterpart as an Hα emission line star with brightness and colours typically found for BeXRBs in the Magellanic Clouds. The OGLE I-band light curve spans almost 15 yr of data and shows three remarkable dips which are equally spaced by about 1350 d (Fig. 11). The regular occurrence of the three dips might indicate the orbital period of the binary system with the dips caused by interaction of the neutron star with the circumstellar disk when the neutron star approaches the Be star in an eccentric orbit. Between the dips, the optical brightness steadily increases, which in this picture can be explained by a recreation of the disk when the neutron star retreats. The recreation might not always be complete, as suggested by the missing dip (which should have occurred around the middle of March 2016) and the somewhat lower brightness level after the last dip. An orbital period of 1350 d would be by far the longest known from an HMXB (for the Galaxy see Liu et al. 2006), with several of the longest orbital periods reported for the Small Magellanic Cloud (SMC) of around 400 d (Haberl & Sturm 2016). A similar period of 1180 d, determined from recurring outbursts seen in the OGLE light curve, was suggested as an orbital period (Maggi et al. 2014) only for CXOU J010744.51-722741.7 (=Swift J010745.0-722740). Alternatively, the long period is more typical for a super-orbital period. These long-term periods, which are seen in most SMC BeXRBs, are likely caused by the formation and depletion of the circumstellar disk (Rajoelimanana et al. 2011). However, the long-term variations seen in MACHO and OGLE data are more sinusoidal and do not exhibit the deep and sharp brightness dips seen from 3XMM J051259.8−682640.
During the brightness variations, the OGLE photometric data taken nearly simultaneously in the V and I bands show that the optical emission from the system becomes redder when increasing in brightness, similar to what is observed from other BeXRBs in the Magellanic Clouds (e.g. Vasilopoulos et al. 2014; Coe et al. 2012). The majority of BeXRBs with optical brightness variations in the SMC shows this behaviour with only 4 or 5 out of 31 becoming bluer with increasing brightness (Rajoelimanana et al. 2011). To explain this, these authors suggest a geometrical viewing effect. The build-up of the circumstellar disk leads to an overall reddening of the combined rising star/disk emission when the disk is viewed face-on, and a reddening when more of the (hotter) star is obscured (decreasing brightness) when the system is seen edge-on. The colour evolution, bluer during the dips and redder with increasing brightness after the dips, is consistent with disruption or truncation (Okazaki & Negueruela 2001) and re-formation of the disk. By chance, the two XMM-Newton observations of 3XMM J051259.8−682640 were performed during the last dip seen in the I-band light curve. The X-ray detection at a luminosity level of 4 × 1034 erg s-1 during the optical minimum is at least consistent with the picture described above. Unfortunately, no sensitive observations were performed at other phases of the optical light curve. Upper limits from pointed ROSAT PSPC observations (assuming the spectral models derived from the EPIC pn spectra) are at a flux level that is similar to or higher than the XMM-Newton detections.
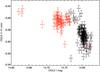 |
Fig. 12 OGLE colour (I−V) magnitude (I) diagram. Red crosses mark data points during the intensity dips, as shown in Fig. 11. |
4.2. 3XMM J051034.6−670353
In contrast, 3XMM J051034.6−670353 shows a very soft X-ray spectrum which can be nicely modelled by absorbed blackbody emission and a weak hard emission component. The derived temperature of kT ~ 70 eV is typical for soft emission seen from SSSs. In particular the LMC is well-known for its SSSs of various types (Kahabka et al. 2008). However, the derived luminosity for an LMC distance is, on the one hand, too low to be explained by steady H-burning on the surface of a WD (Wolf et al. 2013) and, on the other hand, too high to originate from a magnetic cataclysmic variable (e.g. Brunschweiger et al. 2009). Located closer within the Galaxy, the reduced X-ray luminosity would be well within the range of luminosities observed from cataclysmic variables and the small emission area is then consistent with that of a small fraction of the WD surface heated around the accreting poles.
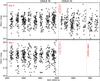 |
Fig. 13 OGLE light curves of the two candidate counterparts for 3XMM J051034.6−670353 since October 2001. The symbols in red indicate typical error bars where 50% of the data points have errors smaller than the boxes, while the emerging error bars enclose 75% of the errors. |
Cataclysmic variables with blackbody-like soft X-ray emission and fast spinning white dwarfs.
The pulse profile of 3XMM J051034.6−670353 is reminiscent of those of cataclysmic variables of polar type (AM Her) or intermediate polar type (e.g. Haberl & Motch 1995). While a pulse period of 1418 s is too short for a classical polar (with much longer synchronised WD-spin/orbital period), it could be explained by the orbital period of an AM CVn system. In particular, the folded X-ray light curve of 3XMM J051034.6−670353 shows little or no flux for about one-third of the pulse period, very similar to RX J0806.3+1527 and RX J1914.4+2456, which are both discussed as double-degenerate polars. Esposito et al. (2014) estimate a distance of 0.9 kpc to RX J0806.3+1527 and report an unabsorbed X-ray flux of 1.5 × 10⁻¹² erg cm-2 s-1, which is about a factor of 8 higher than we see from 3XMM J051034.6−670353. Assuming that both sources have similar X-ray luminosity would place 3XMM J051034.6−670353 at a distance of ~2.5 kpc, well within the old stellar population of the thick disk of the Milky Way (Bensby & Feltzing 2010).
A GROND observation of the field around 3XMM J051034.6−670353 revealed a possible counterpart (Star 1 in Fig. 9), which is the closest of three r′ = 20.9 to 21.6 mag objects to the X-ray positions derived from the two XMM-Newton observations. The SED of Star 1 in the optical GROND filter bands resembles that of RX J0806.3+1527, although less steep.
Two main groups of models were proposed to explain the X-ray emission from double-degenerate polars. Accretion models which invoke mass transfer from a Roche-lobe filling WD predict a widening of the orbit in contradiction to the observed decreases in orbital period from both RX J0806.3+1527 and RX J1914.4+2456 (see Esposito et al. 2014, and references therein). Alternatively, the “unipolar inductor” model, with a secondary WD that does not fill its Roche lobe and non-synchronous rotation of the primary, has difficulties providing enough energy by magnetic interactions to explain the observed X-ray luminosities (Eq. (25) in Lai 2012). Given the strong dependence of the dissipation efficiency on the orbital period with Ldiss ∝ P− 13/3, the maximum luminosity for 3XMM J051034.6−670353 is expected to be ~1000 times smaller than that of RX J0806.3+1527. This would require that 3XMM J051034.6−670353 is much closer than RX J0806.3+1527 at ~100 pc. This is inconsistent with the faintness of the optical counterpart (I ~ 20 mag or fainter). From the information we currently have, we conclude that 3XMM J051034.6−670353 is more likely powered by accretion. However, to further address this we need to measure the orbital evolution of the binary system. Determining whether 3XMM J051034.6−670353 indeed belongs to the class of double-degenerate systems with two interacting WDs or to the soft intermediate polars requires deep optical observations to search for a second period longer than 1418 s. Orbital periods exceeding three hours are expected for soft intermediate polars (see Table 4) and if found, would identify the 1418 s modulation as spin period of the white dwarf.
Science Analysis Software (SAS), http://www.cosmos.esa.int/web/xmm-newton/sas
Available at http://heasarc.gsfc.nasa.gov/xanadu/xspec/
Acknowledgments
EXTraS is funded by the EU’s Seventh Framework Programme under grant agreement No. 607452. This research is based on observations obtained with XMM-Newton, an ESA science mission with instruments and contributions directly funded by ESA Member States and NASA. The OGLE project has received funding from the National Science Centre, Poland, grant MAESTRO 2014/14/A/ST9/00121 to AU. This research has made use of the VizieR catalogue access tool, CDS, Strasbourg, France. The original description of the VizieR service was published in A&AS, 143, 23. G.V. acknowledges support from the BMWI/DLR grant FKZ 50 OR 1208 and P.E. acknowledges funding in the framework of the NWO Vidi award A.2320.0076.
References
- Abazajian, K. N., Adelman-McCarthy, J. K., Agüeros, M. A., et al. 2009, ApJS, 182, 543 [NASA ADS] [CrossRef] [Google Scholar]
- Antoniou, V., & Zezas, A. 2016, MNRAS, 459, 528 [NASA ADS] [CrossRef] [Google Scholar]
- Anzolin, G., de Martino, D., Bonnet-Bidaud, J.-M., et al. 2008, A&A, 489, 1243 [NASA ADS] [CrossRef] [EDP Sciences] [Google Scholar]
- Arnaud, K. A. 1996, in Astronomical Data Analysis Software and Systems V, ASP Conf. Ser., 101, 17 [NASA ADS] [Google Scholar]
- Bensby, T., & Feltzing, S. 2010, in Chemical Abundances in the Universe: Connecting First Stars to Planets, eds. K. Cunha, M. Spite, & B. Barbuy, IAU Symp., 265, 300 [Google Scholar]
- Bohannan, B., & Epps, H. W. 1974, A&AS, 18, 47 [NASA ADS] [Google Scholar]
- Brunschweiger, J., Greiner, J., Ajello, M., & Osborne, J. 2009, A&A, 496, 121 [NASA ADS] [CrossRef] [EDP Sciences] [Google Scholar]
- Burwitz, V., Reinsch, K., Beuermann, K., & Thomas, H.-C. 1996, A&A, 310, L25 [NASA ADS] [Google Scholar]
- Coe, M. J., Haberl, F., Sturm, R., et al. 2012, MNRAS, 424, 282 [NASA ADS] [CrossRef] [Google Scholar]
- Cropper, M. 1990, Space Sci. Rev., 54, 195 [NASA ADS] [CrossRef] [Google Scholar]
- Cropper, M., Harrop-Allin, M. K., Mason, K. O., et al. 1998, MNRAS, 293, L57 [NASA ADS] [CrossRef] [Google Scholar]
- De Luca, A., Salvaterra, R., Tiengo, A., et al. 2016, in The Universe of Digital Sky Surveys, eds. N. R. Napolitano, G. Longo, M. Marconi, M. Paolillo, & E. Iodice, Astrophys. Space Sci. Proc., 42, 291 [Google Scholar]
- de Martino, D., Bonnet-Bidaud, J.-M., Mouchet, M., et al. 2006a, A&A, 449, 1151 [NASA ADS] [CrossRef] [EDP Sciences] [Google Scholar]
- de Martino, D., Matt, G., Mukai, K., et al. 2006b, A&A, 454, 287 [NASA ADS] [CrossRef] [EDP Sciences] [Google Scholar]
- Dickey, J. M., & Lockman, F. J. 1990, ARA&A, 28, 215 [NASA ADS] [CrossRef] [MathSciNet] [Google Scholar]
- Esposito, P., Israel, G. L., Dall’Osso, S., & Covino, S. 2014, A&A, 561, A117 [NASA ADS] [CrossRef] [EDP Sciences] [Google Scholar]
- Esposito, P., Israel, G. L., Belfiore, A., et al. 2016, MNRAS, 457, L5 [NASA ADS] [CrossRef] [Google Scholar]
- Evans, P. A., & Hellier, C. 2007, ApJ, 663, 1277 [NASA ADS] [CrossRef] [Google Scholar]
- Gregory, P. C., & Loredo, T. J. 1996, ApJ, 473, 1059 [NASA ADS] [CrossRef] [Google Scholar]
- Greiner, J. 1996, Proc. Supersoft X-Ray Sources (Berlin: Springer Verlag), Lect. Notes Phys., 472, 299 [Google Scholar]
- Greiner, J., Bornemann, W., Clemens, C., et al. 2008, PASP, 120, 405 [NASA ADS] [CrossRef] [Google Scholar]
- Haberl, F., & Motch, C. 1995, A&A, 297, L37 [NASA ADS] [Google Scholar]
- Haberl, F., & Pietsch, W. 1999, A&AS, 139, 277 [NASA ADS] [CrossRef] [EDP Sciences] [Google Scholar]
- Haberl, F., & Sturm, R. 2016, A&A, 586, A81 [NASA ADS] [CrossRef] [EDP Sciences] [Google Scholar]
- Haberl, F., Motch, C., & Zickgraf, F.-J. 2002, A&A, 387, 201 [NASA ADS] [CrossRef] [EDP Sciences] [Google Scholar]
- Haberl, F., Eger, P., & Pietsch, W. 2008, A&A, 489, 327 [NASA ADS] [CrossRef] [EDP Sciences] [Google Scholar]
- Hellier, C. 1997, MNRAS, 288, 817 [NASA ADS] [CrossRef] [Google Scholar]
- Henze, M., Pietsch, W., Haberl, F., et al. 2014, A&A, 563, A2 [NASA ADS] [CrossRef] [EDP Sciences] [Google Scholar]
- Israel, G. L., & Stella, L. 1996, ApJ, 468, 369 [NASA ADS] [CrossRef] [Google Scholar]
- Israel, G. L., Covino, S., Stella, L., et al. 2003, ApJ, 598, 492 [NASA ADS] [CrossRef] [Google Scholar]
- Kahabka, P., Haberl, F., Pakull, M., et al. 2008, A&A, 482, 237 [NASA ADS] [CrossRef] [EDP Sciences] [Google Scholar]
- Krühler, T., Küpcü Yoldaş, A., Greiner, J., et al. 2008, ApJ, 685, 376 [NASA ADS] [CrossRef] [Google Scholar]
- Kuulkers, E., Norton, A., Schwope, A., & Warner, B. 2006, in X-rays from cataclysmic variables, eds. W. H. G. Lewin, & M. van der Klis (Cambridge University Press), 421 [Google Scholar]
- Lai, D. 2012, ApJ, 757, L3 [NASA ADS] [CrossRef] [Google Scholar]
- Liu, Q. Z., van Paradijs, J., & van den Heuvel, E. P. J. 2006, A&A, 455, 1165 [NASA ADS] [CrossRef] [EDP Sciences] [Google Scholar]
- Maggi, P., Haberl, F., Sturm, R., et al. 2013, A&A, 554, A1 [NASA ADS] [CrossRef] [EDP Sciences] [Google Scholar]
- Maggi, P., Sturm, R., Haberl, F., Vasilopoulos, G., & Udalski, A. 2014, The Astronomer’s Telegram, 5778, 1 [NASA ADS] [Google Scholar]
- Mason, K. O., Watson, M. G., Ponman, T. J., et al. 1992, MNRAS, 258, 749 [NASA ADS] [CrossRef] [Google Scholar]
- Okazaki, A. T. 2001, PASJ, 53, 119 [NASA ADS] [CrossRef] [Google Scholar]
- Okazaki, A. T., & Negueruela, I. 2001, A&A, 377, 161 [NASA ADS] [CrossRef] [EDP Sciences] [Google Scholar]
- Osborne, J. P., Borozdin, K. N., Trudolyubov, S. P., et al. 2001, A&A, 378, 800 [NASA ADS] [CrossRef] [EDP Sciences] [Google Scholar]
- Patterson, J., Thorstensen, J. R., Sheets, H. A., et al. 2011, PASP, 123, 130 [NASA ADS] [CrossRef] [Google Scholar]
- Pietrzyński, G., Graczyk, D., Gieren, W., et al. 2013, Nature, 495, 76 [NASA ADS] [CrossRef] [PubMed] [Google Scholar]
- Pietsch, W., Fliri, J., Freyberg, M. J., et al. 2006, A&A, 454, 773 [NASA ADS] [CrossRef] [EDP Sciences] [Google Scholar]
- Pietsch, W., Henze, M., Haberl, F., et al. 2011, A&A, 531, A22 [NASA ADS] [CrossRef] [EDP Sciences] [Google Scholar]
- Rajoelimanana, A. F., Charles, P. A., & Udalski, A. 2011, MNRAS, 413, 1600 [NASA ADS] [CrossRef] [Google Scholar]
- Reig, P. 2011, Ap&SS, 332, 1 [NASA ADS] [CrossRef] [Google Scholar]
- Rosen, S. R., Webb, N. A., Watson, M. G., et al. 2016, A&A, 590, A1 [NASA ADS] [CrossRef] [EDP Sciences] [Google Scholar]
- Schlegel, E. M. 2005, A&A, 433, 635 [NASA ADS] [CrossRef] [EDP Sciences] [Google Scholar]
- Skillman, D. R. 1996, PASP, 108, 130 [NASA ADS] [CrossRef] [Google Scholar]
- Skrutskie, M. F., Cutri, R. M., Stiening, R., et al. 2006, AJ, 131, 1163 [NASA ADS] [CrossRef] [Google Scholar]
- Staude, A., Schwope, A. D., Krumpe, M., Hambaryan, V., & Schwarz, R. 2003, A&A, 406, 253 [NASA ADS] [CrossRef] [EDP Sciences] [Google Scholar]
- Strüder, L., Briel, U., Dennerl, K., et al. 2001, A&A, 365, L18 [NASA ADS] [CrossRef] [EDP Sciences] [Google Scholar]
- Sturm, R., Haberl, F., Pietsch, W., et al. 2013, A&A, 558, A3 [NASA ADS] [CrossRef] [EDP Sciences] [Google Scholar]
- Trudolyubov, S. P., & Priedhorsky, W. C. 2008, ApJ, 676, 1218 [NASA ADS] [CrossRef] [Google Scholar]
- Turner, M. J. L., Abbey, A., Arnaud, M., et al. 2001, A&A, 365, L27 [NASA ADS] [CrossRef] [EDP Sciences] [Google Scholar]
- Udalski, A., Szymanski, M., Kubiak, M., et al. 2000, Acta Astron., 50, 307 [Google Scholar]
- Udalski, A., Szymanski, M. K., Soszynski, I., & Poleski, R. 2008, Acta Astron., 58, 69 [NASA ADS] [Google Scholar]
- Udalski, A., Szymański, M. K., & Szymański, G. 2015, Acta Astron., 65, 1 [NASA ADS] [Google Scholar]
- van den Heuvel, E. P. J., Bhattacharya, D., Nomoto, K., & Rappaport, S. A. 1992, A&A, 262, 97 [NASA ADS] [Google Scholar]
- Vasilopoulos, G., Maggi, P., Haberl, F., et al. 2013, A&A, 558, A74 [NASA ADS] [CrossRef] [EDP Sciences] [Google Scholar]
- Vasilopoulos, G., Haberl, F., Sturm, R., Maggi, P., & Udalski, A. 2014, A&A, 567, A129 [NASA ADS] [CrossRef] [EDP Sciences] [Google Scholar]
- Vasilopoulos, G., Haberl, F., Delvaux, C., Sturm, R., & Udalski, A. 2016, MNRAS, 461, 1875 [NASA ADS] [CrossRef] [Google Scholar]
- Wilms, J., Allen, A., & McCray, R. 2000, ApJ, 542, 914 [NASA ADS] [CrossRef] [Google Scholar]
- Wolf, W. M., Bildsten, L., Brooks, J., & Paxton, B. 2013, ApJ, 777, 136 [NASA ADS] [CrossRef] [Google Scholar]
- Zaritsky, D., Harris, J., Thompson, I. B., & Grebel, E. K. 2004, AJ, 128, 1606 [NASA ADS] [CrossRef] [Google Scholar]
- Ziolkowski, J. 2002, Mem. Soc. Astron. It., 73, 1038 [NASA ADS] [Google Scholar]
- Zolotukhin, I., Bachetti, M., Sartore, N., Chilingarian, I., & Webb, N. A. 2016, ApJ, submitted [arXiv:1602.05191] [Google Scholar]
All Tables
Cataclysmic variables with blackbody-like soft X-ray emission and fast spinning white dwarfs.
All Figures
|
Fig. 1 Power spectrum for 3XMM J051259.8−682640 obtained from EPIC pn data (observation 0690742601) produced by the EXTraS project in the 0.2−10 keV band. The green line indicates the 3.5σ confidence level. |
| In the text | |
|
Fig. 2 EPIC pn light curves in different energy bands for 3XMM J051259.8−682640 folded at a period of 956.2 s (observation 0690742601). |
| In the text | |
|
Fig. 3 EPIC pn and MOS2 spectra of 3XMM J051259.8−682640 from observation 0690742601 together with the best-fit model consisting of an absorbed power law. |
| In the text | |
|
Fig. 4 Confidence contours for the LMC part of the column density, NH,lmc, and the photon index for 3XMM J051259.8−682640. The smaller contours are obtained from the second observation (0690742601). |
| In the text | |
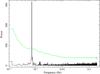 |
Fig. 5 As Fig. 1: power spectrum for 3XMM J051034.6−670353 derived from observation 0741800201. |
| In the text | |
|
Fig. 6 Background-subtracted EPIC pn light curve of 3XMM J051034.6−670353 (observation 0741800201) in the 0.2−2 keV band folded at the period of 1417.4 s. |
| In the text | |
|
Fig. 7 EPIC pn spectra of 3XMM J051034.6−670353 (observation 0741800201 in black, 0741800301 in red) together with the best-fit model (full lines) consisting of absorbed blackbody and bremsstrahlung emission (dotted lines, dominating at low and high energies, respectively). |
| In the text | |
|
Fig. 8 Confidence contours for blackbody temperature and absorption column density derived from the EPIC pn spectrum of observation 0741800201, together with lines (dotted) of constant X-ray luminosity (0.1–2.4 keV, corrected for absorption). Luminosities are given in units of 1032 erg s-1 for an assumed distance of 5 kpc or 1034 erg s-1 for a source located in the LMC at 50 kpc. |
| In the text | |
|
Fig. 9 GROND r′ band image of the region around 3XMM J051034.6−670353 obtained on 2016 August 4, with an exposure time of 2160 s. For each of the two XMM-Newton observations the X-ray positions as provided in the 3XMM-DR6 catalogue (yellow circles) and from our source detection with SAS 15 (red circles) are marked. The green circle is centred on the position we derived (SAS 15) from observation 0741800301 after astrometric alignment using three QSOs. For the other observation no astrometric correction was required. Positional errors (1σ) listed in Table1 are used for the circle radii. For the three brightest objects closest to the X-ray positions (labelled Star 1, 2, and 3, anticlockwise with increasing distance) photometry was conducted in the seven GROND bands. |
| In the text | |
|
Fig. 10 GROND photometry for the three brightest stars (see Fig. 9) near the X-ray position of 3XMM J051034.6−670353. The black symbols indicate upper limits (the same for all stars with non-detections). The SDSS magnitudes for RX J0806.3+1527 and PQ Gem (shifted by 7 mag) are also plotted. |
| In the text | |
|
Fig. 11 OGLE I-band light curve of 3XMM J051259.8−682640 between October 2001 and April 2016. The vertical solid lines mark the minima of the dips with a recurrence time of 1350 d. The vertical dashed lines indicate the times of the XMM-Newton observations. |
| In the text | |
|
Fig. 12 OGLE colour (I−V) magnitude (I) diagram. Red crosses mark data points during the intensity dips, as shown in Fig. 11. |
| In the text | |
|
Fig. 13 OGLE light curves of the two candidate counterparts for 3XMM J051034.6−670353 since October 2001. The symbols in red indicate typical error bars where 50% of the data points have errors smaller than the boxes, while the emerging error bars enclose 75% of the errors. |
| In the text | |
Current usage metrics show cumulative count of Article Views (full-text article views including HTML views, PDF and ePub downloads, according to the available data) and Abstracts Views on Vision4Press platform.
Data correspond to usage on the plateform after 2015. The current usage metrics is available 48-96 hours after online publication and is updated daily on week days.
Initial download of the metrics may take a while.