Free Access
Fig. 11
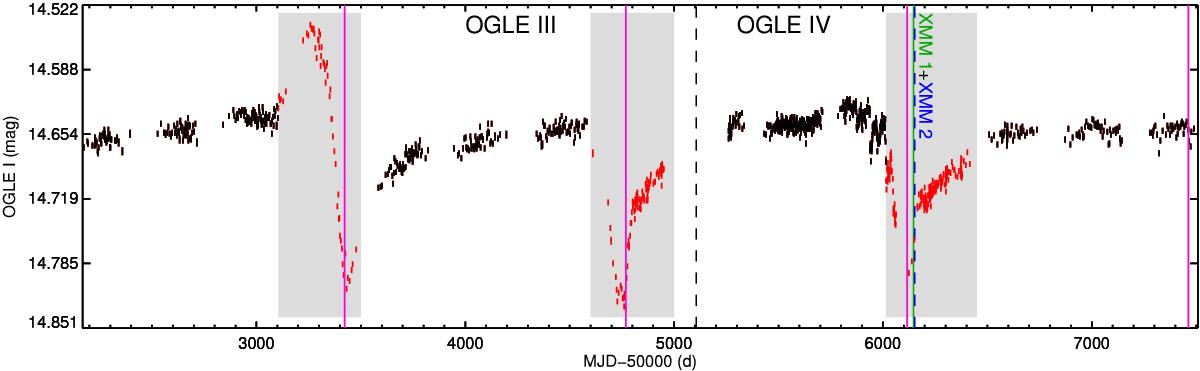
OGLE I-band light curve of 3XMM J051259.8−682640 between October 2001 and April 2016. The vertical solid lines mark the minima of the dips with a recurrence time of 1350 d. The vertical dashed lines indicate the times of the XMM-Newton observations.
Current usage metrics show cumulative count of Article Views (full-text article views including HTML views, PDF and ePub downloads, according to the available data) and Abstracts Views on Vision4Press platform.
Data correspond to usage on the plateform after 2015. The current usage metrics is available 48-96 hours after online publication and is updated daily on week days.
Initial download of the metrics may take a while.